Subjective Voice Quality Evaluation of Artificial Bandwidth Extension: Comparing Different Audio Bandwidths and Speech Codecs Hannu Pulakka1 , Anssi R¨am¨o2 , Ville Myllyl¨a1 , Henri Toukomaa2 , Paavo Alku3 Nokia Smart Devices, Tampere, Finland Nokia Research Center, Tampere, Finland 3 Department of Signal Processing and Acoustics, Aalto University, Espoo, Finland 1
2
[email protected]
Abstract Artificial bandwidth extension (ABE) methods have been developed to improve the quality and intelligibility of telephone speech. In many previous studies, however, the evaluation of ABE has not fully reflected the use of ABE in mobile communication (e.g., evaluation with clean speech without coding). In this study, the subjective quality of ABE was evaluated with absolute category rating (ACR) tests involving both clean and noisy speech, two cutoff frequencies of highpass filtering, and input encoded at different bit rates. Three ABE methods were evaluated, two for narrowband-to-wideband extension and one for wideband-to-superwideband extension. Several speech codecs with different audio bandwidths were included in the tests. Narrowband-to-wideband ABE methods were found to significantly improve the speech quality when no background noise was present, and the mean quality scores were slightly but not significantly increased for noisy speech. Widebandto-superwideband ABE also showed significant improvement in certain conditions with no background noise. ABE did not cause significant decrease of the mean scores in any of the tests. Index Terms: artificial bandwidth extension, subjective evaluation, listening test, speech coding
1. Introduction Speech transmission in communication networks is still commonly limited to narrowband speech with an audio band constrained below 4 kHz. The adaptive multi-rate (AMR) codec [1] widely used in mobile networks is an example of a narrowband speech codec. Better speech quality and intelligibility can be obtained by transmitting wideband speech with an audio band of 50–7000 Hz. Wideband speech services are currently being deployed in a growing number of mobile networks [2] using the adaptive multi-rate wideband (AMR-WB) codec [3]. However, natural speech contains frequency content beyond the wideband range and the speech quality can be further enhanced using superwideband codecs such as the superwideband mode of the Opus codec [4], which covers frequencies up to 12 kHz, or ITU-T G.722.1 Annex C [5] or ITU-T G.718 Annex B [6], which transmit frequencies up to 14 kHz. Artificial bandwidth extension (ABE) methods (e.g., [7, 8, 9]) have been developed to extend the audio band of narrowband speech to the wideband frequency range (NB-to-WB) at the receiving end without additional transmitted information. The goal of ABE is to improve the quality and intelligibility of narrowband speech. Furthermore, ABE reduces the difference between narrowband and wideband speech perceived between and within telephone calls [10]. ABE techiques have also been
proposed to extend the bandwidth of wideband speech to the superwideband range (WB-to-SWB) [11, 12, 13]. The subjective quality of ABE output can be evaluated with listening test methods defined in [14], which are typically used for the quality characterization of speech codecs. For example, ABE has been evaluated with absolute category rating (ACR) tests in [10, 15] and with comparison category rating (CCR) tests in [16, 17, 9]. The MUSHRA test method described in [18] has also been used (e.g., [19]). Furthermore, conversational evaluations of ABE have been organized [20, 21]. In most of the published evaluations, ABE has been found to improve the speech quality (e.g., [16, 19, 9]), but especially the listening tests reported in [22] and recently in [23] did not show significant improvement over narrowband speech. Intelligibility evaluations have also been arranged (e.g., [10, 24]) showing that ABE can improve the intelligibility of narrowband speech. ABE methods have often been evaluated with clean speech without speech coding or background noise. However, realistic use of ABE in mobile communication implies that a speech codec is used and downlink noise may be present. ABE evaluations with coded speech have been presented, e.g., in [25, 9], and noise-robust ABE has been considered, e.g., in [26, 22]. This paper presents a subjective evaluation of ABE methods for both clean and noisy speech encoded with different bit rates of the AMR and AMR-WB codecs. Three ABE methods were evaluated: the NB-to-WB ABE method proposed in [9], a new NB-to-WB ABE method based on [9] but employing a different estimation technique, and a similar method for WB-to-SWB extension. The evaluation comprised ACR listening tests similar to those used for codec performance characterization, e.g., in [27, 28]. Several standardized speech codecs with different audio bandwidths were included in the tests, and two highpass filtering cutoff frequencies were also involved.
2. Artificial bandwidth extension methods This section describes the ABE methods evaluated in this work. 2.1. ABE1: Estimation using a neural network An ABE method for the extension of narrowband speech (0– 4 kHz, 8-kHz sampling) to the wideband frequency range (0– 8 kHz, 16-kHz sampling) was proposed in [9]. This method is referred to as ABE1 in this paper. ABE1 uses a neural network to estimate the highband spectrum parameters and a filter bank technique to shape the spectrum. The method was earlier shown to improve the quality of narrowband speech with CCR listening tests in [9] and with conversational tests in [20, 21].
snb
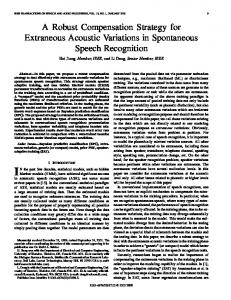
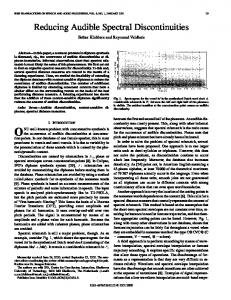
2.2. ABE2: Estimation using a HMM and linear mapping A new ABE method was developed with the goal of improving the consistency of output quality for different talkers and reducing artifacts for non-speech sounds such as breathing. A flow diagram of the method is shown in Figure 1. The method is referred to as ABE2 in this work. ABE2 shares the basic structure with ABE1 with the following main differences: • The synthesis filter bank consists of four subbands with linear spacing in the range 4–8 kHz. • The feature vector was modified: The number of subbands of the input spectrum was increased to 18. The voice activity detector was removed and a new feature based on the modulation spectrum [29] was added to represent temporal modulation in the input spectrum. • The neural network was replaced by a hidden Markov model (HMM) and state-specific linear mapping to estimate the highband spectral shape. The estimation technique is similar to the Gaussian mixture model (GMM) based piecewise linear mapping techniques in [26] and [30], but a HMM is used instead of a GMM. HMMbased ABE techniques have been described, e.g., in [8, 31]. Input features of three successive frames are concatenated to form the feature vector x. The input dimension is reduced using a transformation matrix L precomputed with linear discriminant analysis (LDA). The resulting vector z = Lx is employed by a HMM to compute the probability p(k|z) of each state k. An estimate y ˆ of the subband energy levels in the highband is obtained as a weighted sum of state-specific estimates that are calculated from the input features x with linear mapping matrices Ak : K X y ˆ= p(k|z)Ak [x 1]T (1) k=1
The HMM, mapping matrices Ak , and LDA matrix L were trained using 128 minutes of conversational recordings in Finnish with additive noise in part of the training material. 2.3. SWB-ABE: WB-to-SWB extension based on ABE2 Another ABE method was developed for the bandwidth extension of wideband speech (0–8 kHz, 16-kHz sampling) to superwideband speech (0–16 kHz, 32-kHz sampling). This method is referred to as SWB-ABE. The method is based on the same structure as ABE2 with the following major differences: • The following input features were selected based on mutual information analysis [32] and experiments: gradient index [32], spectral centroid [32], spectral flatness [32], energy quotient [33], differential energy ratio [17], and the input spectrum represented by the energy levels of linearly spaced subbands in the range of 0–7 kHz. • The excitation signal is constructed from the linear prediction coding (LPC) residual of the input by bandpass filtering, modulation, and spectral folding so that the extension band is filled with spectral components copied from the residual in the 2–6 kHz range. • The synthesis filter bank comprises four linearly spaced subbands in the frequency band 7–15 kHz. • The extension band is attenuated by 10 dB relative to the level based on training. The attenuation was set experimentally with the aim of reducing the audibility of occasional artifacts and a buzzing character of the extension but maintaining the effect of the extended bandwidth.
2
framing
low-pass filter
FFT
delay
feature extraction HMM
LPC analysis 2 overlapadd
matrix mapping
filter bank
band levels to gains
weighting and summing + sabe
Figure 1: Flow diagram of ABE2. Narrowband input speech is denoted by snb and bandwidth-extended output speech by sabe .
3. Subjective evaluation A subjective listening evaluation was organized to characterize the quality of ABE-processed speech in comparison with narrowband, wideband, and superwideband speech codecs. A similar test setting was used for codec evaluation, e.g., in [27] and [28]. The following conditions were included in the evaluation: • Direct reference conditions with no speech coding but limited frequency range. Four lowpass cutoff frequencies were evaluated: 4 kHz, 7 kHz, 10 kHz, and 14 kHz. • AMR codec [1] commonly used for narrowband speech in mobile networks. The audio bandwidth covers frequencies up to 4 kHz. Four bit rate modes were evaluated: 4.75 kbit/s, 7.95 kbit/s, 10.2 kbit/s, and 12.2 kbit/s. • AMR + ABE: AMR codec followed by ABE processing. Four combinations were evaluated: AMR at 7.95 kbit/s and 12.2 kbit/s followed by ABE1 and ABE2. • AMR-WB codec [3] for wideband speech, currently being deployed in an increasing number of mobile networks [2]. The audio bandwidth extends up to 7 kHz. Four bit rate modes were evaluated: 6.6 kbit/s, 8.8 kbit/s, 12.65 kbit/s, and 23.85 kbit/s. • AMR-WB + SWB-ABE: AMR-WB codec followed by SWB-ABE processing. Two bit rate modes of AMR-WB were evaluated: 12.65 kbit/s and 23.85 kbit/s. • Opus [4], a real-time, variable and fixed bit rate codec with the highest voice quality currently available in open source. Four constant bit rates (CBR) were evaluated. The corresponding bandwidths were selected by the codec based on bit rate: 10.2 kbit/s (narrowband, 4 kHz), 12.65 kbit/s (mediumband, 6 kHz), 16 kbit/s (wideband, 8 kHz), and 20 kbit/s (superwideband, 12 kHz). • ITU-T G.722.1 Annex C [5], a low-complexity superwideband voice codec widely deployed in video teleconferencing services. The audio bandwidth is 14 kHz. Two bit rate modes were evaluated: 24 kbit/s and 32 kbit/s.
Clean speech, 150-Hz highpass
Clean speech, 50-Hz highpass
Noisy speech, 50-Hz highpass
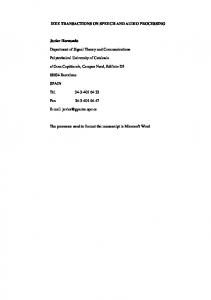
Direct 14 kHz Direct 10 kHz Direct 7 kHz Direct 4 kHz AMR 4.75 AMR 7.95 AMR 10.2 AMR 12.2 AMR 7.95 + ABE1 AMR 12.2 + ABE1 AMR 7.95 + ABE2 AMR 12.2 + ABE2 AMR-WB 6.6 AMR-WB 8.8 AMR-WB 12.65 AMR-WB 23.85 AMR-WB 12.65 + SWB-ABE AMR-WB 23.85 + SWB-ABE Opus 10.2 NB Opus 12.65 MB Opus 16 WB Opus 20 SWB G.722.1C 24 G.722.1C 32 G.718B 28 G.718B 40 1
2
3
4 5 6 MOS9
7
8
9
1
2
3
4 5 6 MOS9
7
8
9
1
2
3
4 5 6 MOS9
7
8
9
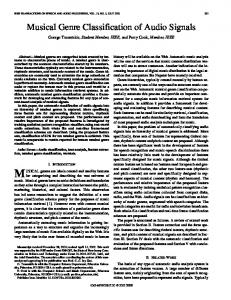
Figure 2: Mean opinion scores and 95-percent confidence intervals of all three tests. Numbers after codec names correspond to the bit rates in kbit/s. For clarity, the ABE conditions and the corresponding reference conditions are indicated by the same text color. • ITU-T G.718 Annex B [6], the latest and most efficient standardized embedded (8–64 kbit/s) speech codec for narrowband, wideband, and superwideband services. Two bit rate modes with 14-kHz audio bandwidth were evaluated: 28 kbit/s and 40 kbit/s. Additionally, ten experimental conditions were included in the tests for internal use but they are not reported in this paper. 3.1. Listening tests Three tests were arranged with different background noise conditions and highpass filter cutoff frequencies. All speech samples were filtered with a highpass filter having a flat response in the passband and a cutoff frequency of 150 Hz (test 1) or 50 Hz (tests 2 and 3). The 150-Hz cutoff corresponds to the response of a mobile phone in the far end where low-frequency noise is reduced by highpass filtering. In practice, low frequencies are attenuated also if a mobile phone is used in the near end because earpieces have limited low-frequency reproduction capabilities. On the other hand, codec characterization tests commonly employ a highpass filter with a cutoff of 50 Hz and thus minimal limitation of the passband at low frequencies. Since ABE quality is known to vary from talker to talker, short speech samples were chosen in tests 1 and 2 so that 8 talkers could be included. • Test 1: Clean speech, highpass cutoff 150 Hz, 8 talkers (4 females, 4 males), sentence pairs of about 6 seconds. • Test 2: Clean speech, highpass cutoff 50 Hz, 8 talkers (4 females, 4 males), single sentences of about 4 seconds. • Test 3: Noisy speech, highpass cutoff 50 Hz, 4 talkers (2 females, 2 males), sentence pairs of about 7 seconds. Four noise types: car noise with signal-to-noise
ratio (SNR) of 15 dB, street noise (SNR 15 dB), cafeteria noise (SNR 20 dB), and office noise (SNR 20 dB). Modified ACR tests were used for evaluation. Instead of the 5-point scale defined in [14], a discrete 9-point scale was used and only the extreme categories (1 “very bad” and 9 “excellent”) were labeled with verbal descriptions [27]. The tests were arranged in the listening test laboratory of Nokia Research Center [34]. Subjects were seated in soundproof booths and listened to samples diotically (the same signal to both ears) through an RME Multiface II audio interface and Sennheiser HD-650 headphones. The listening level was set to a sound pressure level (SPL) of 76 dB and could not be changed by the listeners. Listeners heard each test sample once (no relistening allowed) and gave their opinion using a discrete 9-step scale. A training session with 12 samples preceded each test. Twenty-eight listeners participated in each test. In all the tests, 5–6 of the participants were expert listeners (35–47 years of age) working in the field of audio signal processing. The remaining participants were naive listeners (15–23 years of age).
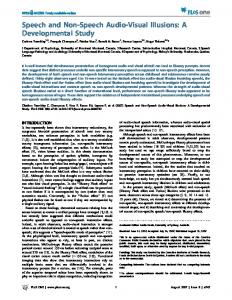
4. Results The mean opinion scores on the 9-point scale (MOS9) and 95percent confidence intervals of all three tests are shown in Figure 2. Additionally, the mean scores and 95-percent confidence intervals of AMR, AMR-WB, ABE, and Opus conditions are presented in Figure 3 as a function of codec bit rate. Two-tailed independent-samples t tests were conducted to compare the mean scores within each test. Statistically significant differences (α = 0.05) between ABE conditions and the conditions used as input to ABE are presented in Table 1. For clean speech and 150-Hz highpass filtering, all ABE conditions
Clean speech, 150-Hz highpass
9
AMR AMR + ABE1 AMR + ABE2 direct 14 kHz AMR-WB AMR-WB + SWB-ABE Opus direct 7 kHz
8
MOS9
7
Clean speech, 50-Hz highpass
9
direct 14 kHz
8
direct 7 kHz
7
6
6
5
5
8 7
direct 4 kHz
4
4
3
3
3
5
10 15 20 Bit rate (kbit/s)
25
2
direct 7 kHz
5
4
0
direct 14 kHz
6
direct 4 kHz
2
Noisy speech, 50-Hz highpass
9
0
5
10 15 20 Bit rate (kbit/s)
25
2
direct 4 kHz
0
5
10 15 20 Bit rate (kbit/s)
25
Figure 3: Mean opinion scores as a function of codec bit rate. 95-percent confidence intervals are shown. were significantly better than the corresponding reference conditions. For clean speech with 50-Hz highpass filtering, all NBto-WB ABE conditions were significantly better than the reference conditions and the improvement by SWB-ABE following AMR-WB at 23.85 kbit/s was close to statistical significance (p = 0.064). There were no significant differences between ABE conditions and the corresponding reference conditions in the test with noisy speech. Also, no significant differences were found between ABE1 and ABE2 in any of the tests. Table 1: Statistically significant differences between ABE conditions and the corresponding reference conditions. In each case, condition 2 is the same codec as condition 1 followed by the indicated ABE method. df = 446 in all these cases. condition 1
MOS9 condition 2 MOS9
Clean speech, 150-Hz highpass AMR 7.95 3.46 ABE1 AMR 7.95 3.46 ABE2 AMR 12.2 3.75 ABE1 AMR 12.2 3.75 ABE2 AMR-WB 12.65 5.78 SWB-ABE AMR-WB 23.85 5.70 SWB-ABE Clean speech, 50-Hz highpass AMR 7.95 3.48 ABE1 AMR 7.95 3.48 ABE2 AMR 12.2 3.87 ABE1 AMR 12.2 3.87 ABE2
t
p
3.88 3.89 4.20 4.27 6.11 6.12
2.61 2.63 2.74 3.18 2.24 2.74
0.009 0.009 0.006 0.002 0.025 0.006
3.89 3.98 4.49 4.44
2.64 0.009 3.14 0.002 3.65