2ND NORDIC CONFERENCE ON PRODUCT LIFECYCLE MANAGEMENT - NORDPLM’09, GÖTEBORG, JANUARY 28-29 2009
COMPARING REPRESENTATIONS FOR PRODUCT ARCHITECTURE DESIGN THROUGH LIFE-CYCLE EVALUATION METHODS David F Wyatt, David C Wynn, P John Clarkson
Abstract Product architectures are important determinants of life-cycle performance. Many modelling languages have been proposed to represent such architectures and thereby support their design. This paper assesses product architecture modelling languages with respect to their ability to support assessment against different life-cycle performance objectives. In order to do so, the information represented by 15 product modelling languages is compared with the information requirements of 27 assessment methods. The MOKA Modelling Language was determined to be the most comprehensive modelling language of those reviewed. However, even this most comprehensive language only includes the information required to evaluate 33% of the assessment methods we reviewed. In conclusion, there is a need to bridge the gap between the information provided by product modelling languages and that required by assessment methods. Possible approaches to achieve this include simplifying assessment methods, extending product modelling languages or developing methods for predicting detailed information about the design from preliminary design decisions. However, the potential complexity of such methods must be balanced with usability to ensure architecture modelling languages and life-cycle evaluation methods can support real engineering projects. Keywords: product architecture, life-cycle evaluation, multi-objective design, Design for X
1
Introduction
The architecture of a product can influence many aspects of its life-cycle performance – from the design phase through to the recycling of a product and the reuse of fragments of its design. Product architecture choice therefore deserves careful consideration, which would be facilitated by the ability to represent and assess alternatives at an early stage. In this context, product architecture refers to the conceptual structure of a design. It has been defined by Ulrich [1] as the arrangement of functional elements, the mapping from functional elements to physical components, and the specification of the interfaces among interacting physical components. Others extend this definition to include the division of a product into functional modules [2] and component-sharing relationships within a family of products [3]. Product architecture may be represented using a product modelling language. There are many such languages, which vary in the types of information they represent and the way in which they do so. Models of a product’s architecture constructed in such languages may be used for various purposes, including communication between the client and a design team or within a design team, or (the focus of this paper) for assessing the product against life-cycle objectives. These objectives may be classified into performance-related objectives and those related to other aspects of the product’s existence. Many objectives in the second class, also termed
1
2ND NORDIC CONFERENCE ON PRODUCT LIFECYCLE MANAGEMENT - NORDPLM’09, GÖTEBORG, JANUARY 28-29 2009
non-functional requirements, are addressed by Design for X (DfX) methods (where “X” may be “Assembly”, “Manufacture”, “Environment” etc.) [4]. If a model of a product architecture is to be used as the basis for assessment, the information contained in the modelling language must cover that required by the assessment methods. In principle, it would be desirable for a product architecture modelling language to allow assessment against any conceivable objective. However, only the finished product itself can guarantee to allow this. This paper evaluates some of the main product modelling languages found in the literature against the information needs of current design assessment methods, in order to quantify how well this correspondence is achieved for each one. The remainder of the paper is structured as follows. Section 2 motivates the research and outlines our method. Section 3 describes approaches for assessing engineering artefacts with particular reference to the “Design for X” field. Section 4 reviews modelling languages for representing engineering artefacts. Section 5 describes the comparison of modelling languages on the basis of the assessment methods they support, and Section 6 discusses the results. Finally, Section 7 presents conclusions and identifies opportunities for future work.
2
Background and method
Many companies are under pressure to ensure that their new products meet multiple life-cycle objectives. One way of achieving this is to assess alternative designs against these objectives at an early stage of the design process – when only the architecture of the product, and not a detailed design, is available. Only the most appropriate designs can then be taken forward. However, carrying out such life-cycle assessments demands time and resources, as many analysis methods require input data to be specifically compiled. This limits the number of analyses that can realistically be undertaken in the course of a design project. Such assessment would be greatly facilitated by integrating different assessment methods such that they use the information from a single product model to produce their results. Previous work in this field is outlined in Section 3.4. The overall aim of this research project is to combine such integrated assessment methods with a framework for supporting the design of alternative product architectures, in order to optimise the results of the early stages of design. The comparison of product modelling languages described in this paper contributes to this objective by establishing the “common ground” between the generation and evaluation stages of such a system.
2.1 Comparison approach 1. Methods for evaluating product architectures (“metrics”) were identified through a search of the literature and discussions with industry. The information needed by each of these was tabulated as distinct “data items”. 2. In parallel, product modelling languages (“representations”) were identified from the literature. The data items representable in each modelling language were tabulated. 3. The information needs of the metrics were compared with the information provided by the modelling languages to establish the “compatibility” between each modelling language and each metric. 4. Modelling languages were ranked according to how well they satisfied the overall data item requirements of the set of metrics considered.
2
2ND NORDIC CONFERENCE ON PRODUCT LIFECYCLE MANAGEMENT - NORDPLM’09, GÖTEBORG, JANUARY 28-29 2009
The review of metrics from step 1 is presented in Section 3, the review of representations from step 2 is presented in Section 4, and the overall compatibility scores calculated in step 4 are shown in Section 5.
3
Assessment of engineering artefacts
The diversity of literature on the assessment of engineering artefacts is difficult to capture within a single review. Drawing on previous work ([4], [5], [6]) this section first proposes a conceptual framework for classifying such literature. We then present taxonomies of the objectives against which a design maybe assessed; a review of previous work on integrating the diversity of tools; a description of the different possible information relationships in an assessment process; the shortcomings of existing research in this area; and examples of the metrics that were used in the comparison of product modelling languages.
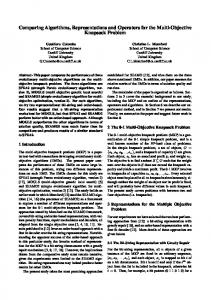
3.1 Conceptual framework When assessing engineering products, an objective may be defined as one facet of overall quality. A product’s “goodness” with respect to that objective is indicated by one or more properties; the values of these properties are determined by characteristics, which are the design parameters that may be set directly by the designer. While at the design stage, property values cannot be established definitively but can only be estimated based on subsets of the design information, although such estimates may be made closer to the true value by using more sophisticated methods and more accurate input information. Metrics are specific methods by which such estimates may be calculated. This structure is indicated in Figure 1. For example, in the case of Design for Assembly the objective is “ease of assembly”, one relevant property of a design may be the assembly time, and one of several metrics developed to estimate this property at the design stage is the Boothroyd-Dewhurst Design for Assembly tool [7]. In this case, the property is the actual assembly time as determined by conducting measurements on the assembly line, while the metric result is a prediction or estimate based on the geometry of the parts and the assembly order.
Figure 1. A property indicates ‘goodness’ in the context of an objective. Its value may be estimated by a metric.
A different type of tool is the collection of guidelines or heuristics: rules describing how to improve a design, instead of methods to assess a design as-is. However, metrics and guidelines are not totally distinct. Guidelines can be deduced from the experience of applying metrics repeatedly on different projects [6], and within a single project it is possible for a metric to indicate both where a design is weak and how it may be improved. Similarly, metrics may be created by using a set of guidelines as a “checklist” to evaluate a design.
3
2ND NORDIC CONFERENCE ON PRODUCT LIFECYCLE MANAGEMENT - NORDPLM’09, GÖTEBORG, JANUARY 28-29 2009
3.2 Classifications of objectives A number of authors have proposed high-level criteria for the “goodness” of engineering systems. Pahl and Beitz [8] described the “general objectives” of an artefact as fulfilment of the technical function, economic feasibility and (individual and environmental) safety. Aguirre Esponda [9] proposed a similar list of objectives comprising performance, reliability and economy. Olesen [10] lists the “fundamental virtues” as costs, time, quality, efficiency, flexibility, risk and environment. However, it is difficult both to assess such broad objectives and to interpret the results in order to improve the design. At a more detailed level there is a profusion of objectives – over 140 were identified by reviewing the literature, ranging from manufacturability by micro-milling to cultural compatibility. Bauer [11] presents a hierarchical classification of objectives, in which the toplevel categories are Profit, Resources and Staff; for example, Design for Assembly [Cost] is classified under Profit→Contemporary Profit→Low Effort→Production→Low Running Costs. An alternative 2-dimensional classification is presented by Reik et al. [12], who classify objectives according to the “downstream activities likely to affect the product's life cycle” or Life Cycle Processes (LCPs) in which they occur and the Product Performance Characteristics (PPCs) they affect. Each LCP forms part of one of the four Life Cycle Stages (LCSs): Production, Delivery, Use, and End-of-Life. Likewise, the three PPCs are Cost, Quality and Regulation Conformance. The last PPC includes safety, environment and “industry specific”. It could be alternatively viewed as representing the externality properties of a product’s life-cycle, in the economic sense of those properties which affect third parties not directly involved in the transaction between supplier and customer – and hence may be subject to regulation in a free-market environment. It would also be possible to extend Reik et al.’s framework through adding Design as an LCP, since one objective of a good product architecture is to reduce the time and costs involved in the design stage.
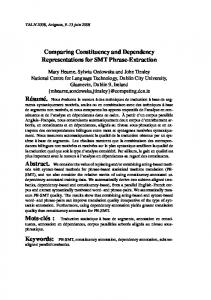
3.3 Information structure of metrics In order to understand the use of metrics in a design context, Watson and Radcliffe [13] provide a framework for understanding the information relationships and dependencies between them. They consider two aspects of a metric: “level” – whether it uses information directly from the design or the result of a sub-metric; and “focus” – upon the overall assembly, overall components, or component details. They state that in original design a higher-level metric which can only be used once its sub-metrics have been evaluated should have its focus later in the design process, as otherwise improvements to the design will require iterating back to an earlier point in the design process. For routine or redesign projects, on the other hand, information at the detailed level is available immediately so any pattern is acceptable. The same authors in an earlier work [14] considered the issue of conflicts from interacting DfX metrics by evaluating the “net worth” of a tool for a given design phase and comparing this to the usage of that tool in that design phase. If multiple tools are valuable in a single phase, they consider it likely that contradictions will occur. This discussion indicates that, contrary to the simple picture presented in Figure 1 (and Figure 2a), metrics can be related to each other in various ways as indicated in Figure 2: •
Metric results may not be readily interpretable as corresponding to a property value, for example “assembly efficiency” in Boothroyd-Dewhurst Design for Assembly [7]. These metrics may nonetheless be useful for comparing alternatives. (Figure 2b)
•
One metric’s result may be used as the input for another metric. (Figure 2c)
4
2ND NORDIC CONFERENCE ON PRODUCT LIFECYCLE MANAGEMENT - NORDPLM’09, GÖTEBORG, JANUARY 28-29 2009
•
Multiple metrics may assess a single objective: either considering different properties associated with the objective (Figure 2d), for example maximum speed and fuel consumption as aspects of performance; or considering the same property using increasing levels of detail to give increasingly accurate estimates (Figure 2e).
•
Metrics associated with different objectives may use the same characteristics of a candidate architecture but may have contradicting notions of “goodness”, leading to conflicts if it is necessary to maximise both properties. (Figure 2f)
•
Finally, engineers can estimate property values directly from design information without using formal metrics. (Figure 2g)
Figure 2. Relationships between objectives (O), metric results (M) and property values (P) based on subsets (S) of the complete design information.
3.4 Integrating multiple metrics and guideline sets There are at least as many metrics and guidelines as there are objectives. Reik et al. [12] reported over 150 different “methodologies or philosophies”; Huang [4] presents a selection of such methods. The sheer number of different tools would present a problem for practising designers looking to use such tools to improve their products, even without evidence that some tools contradict each other in their recommendations [15]. One approach to taming this diversity is to group tools according to the objectives they assess, following one of the classifications presented in the previous subsection. More integrated approaches involve a model of the product that guides the use of the tool. For example, Huang and Mak [16] propose a general framework which can be customised to construct new metrics, the “DfX shell”. They use a hierarchical Bill of Materials (BoM) and associate key characteristics with each component (the key characteristics chosen are specific to the objective to be addressed). They also model the manufacturing and assembly processes carried out to create the product. However, they do not address explicitly the way in which several such metrics could be integrated. Meerkamm and Koch [17] describe a more sophisticated system, the “Engineering Workbench mfk”, in which CAD is coupled to a “knowledge base” capable of evaluating a design against different objectives (they describe stress, machining, casting, tolerancing, cost estimation and recycling). Their product model is again organised through the BoM and contains components’ attributes in the areas of function, geometry, technology (material and tolerances) and organisation (person responsible and design status). In order to evaluate a concept for a product family, rather than just an individual product, Otto and Hölttä-Otto [18] describe a procedure involving 19 metrics in 6 groups (portfolio customer satisfaction, product variety, after sale support, organizational alignment, upgrade
5
2ND NORDIC CONFERENCE ON PRODUCT LIFECYCLE MANAGEMENT - NORDPLM’09, GÖTEBORG, JANUARY 28-29 2009
flexibility and development complexity). All 19 evaluation methods were scaled to the same numerical range. However, there was no explicit use of a product model – the case study involved a range of commercially-available cordless hand drills and thus the products could be directly assessed. They acknowledge that the lack of detailed product information could be an issue in performing assessments earlier in the design process. Whereas the above describes the integration of different metrics, Watson, Radcliffe and Dale [6] propose a structured method for integrating guidelines. They rank guidelines by their importance for a current design project, taking into account conflicts between different guidelines. Similarly, Faerber et al. [19] propose a hierarchical structuring of DfX guidelines, or “design suggestions”, using the objectives with which they are associated. In their support system, high-level choices of the objectives that are important for a project will then lead to relevant guidelines being presented to a design engineer at the appropriate stage in the design process. Again, neither approach makes use of an explicit product model. A key limitation of these integrated approaches is that they neglect a significant fraction of the tools available, concentrating on a few well-known examples such as BoothroydDewhurst Design for Assembly [7]. In addition, neither the authors of the categorisations nor the developers of the individual tools explicitly indicate the set of information required to evaluate a given metric or the uncertainty in the result. The implicit assumption shared by many published metrics seems to be that a finished product is available when carrying out the assessment. However, this is too late to make effective use of the information generated by the metric to improve the design without requiring significant and expensive rework. To overcome this mismatch between metrics’ information requirements and the information which is available earlier in the design process where their results would be of greatest benefit, it is necessary to estimate parameter values. Methods which have been used to do so include: Experience drawn from previous products or “rules of thumb” [7] (Figure 2g); Statistical analysis of previous products [20]; First-principles computational exploration of the performance limits of a particular “configuration” [21]. However, this “information gap” remains an issue in using metrics to support architecture design.
3.5 Metrics selected for review As observed above, over 150 metrics have been presented in the literature associated with more than 140 objectives. To attempt a comprehensive review would have been beyond the scope of this paper; instead, 27 metrics were selected which cover the major objectives of interest to engineering designers. The relevant life cycle stage(s), product performance characteristic(s) and specific information needs of these metrics were then determined (as “data items”). Three examples from the 27 metrics included in this review are shown in Table 1.
6
2ND NORDIC CONFERENCE ON PRODUCT LIFECYCLE MANAGEMENT - NORDPLM’09, GÖTEBORG, JANUARY 28-29 2009 Table 1. Three examples of the 27 metrics considered.
Objective
Metric
Environment EcoIndicator 99 [22]
Life cycle stage
Product performance characteristic
Production, Externalities delivery, use, end-oflife
Data items required
Part geometry, part materials, manufacturing processes, assembly processes, distribution parameters, disposal means, energy usage
Assembly
Boothroyd- Production Cost Dewhurst Design for Assembly [7]
Bill of materials, allocation of functions to components, relative motions, part geometry, part weight, securing method
Logistics
STORE [23] Distribution Cost
Box size, pallet size, warehouse size, type of picking, picking costs
4
Representations of engineering artefacts
Product modelling languages, or representations, are sets of conventions for representing information about an engineering artefact, usually in graphical form. Many such languages have been proposed, and have previously been classified based on the phases of a product’s lifecycle in which a model is useful and its perspective on a business’ activities [24], or the domains included in the modelling language [25]. In the following subsections, two aspects of product modelling languages are proposed as a basis for classification: the type(s) of information represented and the degree of abstraction of the resulting models.
4.1 Categories and completeness of information The type of information represented in a given modelling language can be divided into a number of major categories: 1. Schematic: this category covers information about the entities present in a design (e.g. components), their attributes (e.g. mass, cost) and their relationships (e.g. interconnection, specialisation, or hierarchy relationships). More abstract entities such as functions are also included in this category, although the mapping from functions to components may be complex. Example: circuit diagramming conventions. 2. Parametric: this category covers the mathematical relationships between design variables in a system. Example: differential equations. 3. Domain-specific: this category describes the geometry of mechanical parts and assemblies, or other non-geometric implementation details in the case of other domains. Examples: engineering drawing conventions, printed circuit board layout templates or computer programming language definitions. 4. Procedural: whereas categories 1-3 concern an artefact as a “blueprint” (a snapshot in time), some modelling languages allow description of a process associated with an artefact (usually, a process of which an artefact is the result). Examples: modelling
7
2ND NORDIC CONFERENCE ON PRODUCT LIFECYCLE MANAGEMENT - NORDPLM’09, GÖTEBORG, JANUARY 28-29 2009
languages for defining the design process, assembly instruction templates or shape grammar rules [26]. Within these categories a modelling language may be more or less complete. In other words, it may focus on a specific subset of the information related to a product in that category (e.g. component DSMs), or may be more comprehensive (e.g. a CAD system capable of modelling assemblies of multiple components). A single modelling language may also cover more than one of these categories. For example, the commercial system Simulink [27] is primarily a parametric modelling environment for dynamic systems but includes elements of schematic modelling by hierarchically grouping mathematical elements into “blocks”. Another, the MOKA Modelling Language (MML) [28] [29], is largely schematic but includes the provision for adding geometry information to entities representing components. Very few representations were found to include both schematic and procedural information. Of those that do, the information was exclusively about the design process and did not include manufacturing, assembly or other downstream life-cycle processes – which are among the most important data items for the group of metrics that were used as a benchmark.
4.2 Degree of abstraction Modelling languages can also be classified by their degree of abstraction from the physical reality of a product. For example, a three-dimensional CAD model could be described as having a low degree of abstraction, whereas a functional model describing the same artefact in terms of flows of physical quantities and operations on these flows [8] could be described as a more abstract model. Some modelling languages are capable of spanning multiple levels of abstraction, such as the Chromosome model [30] which defines four domains of entities for modelling a technical system: “processes” (referring to the behaviour that characterises the operation of a product); “functions” that implement processes; “organs” or function carriers that produce the functions; and “parts” that “materialise” the organs. Such modelling languages can facilitate understanding of the concrete levels of the architecture of a product through direct references to more abstract levels of its structure.
4.3 Selected representations Since geometric, parametric and procedural information are not necessarily available at the conceptual design stage, the comparison of modelling languages focused on those that include a schematic component. The desire for compatibility with software systems (such as PLM) biased the review towards formal or de facto standard representations [24]. Fifteen representations in total were included in the review. The data items about a product that each of the representations contained were identified in a similar fashion to the data required by assessment metrics. Three examples of the 15 representations reviewed are shown in Table 3. Table 2. Three examples of the 15 product representations considered.
Representation
Information types
Data items represented
Bill of Materials
Schematic
Component list
Component DSM [31]
Schematic
Component list, interconnections
MOKA Modelling Schematic, domainLanguage (MML) [28] specific, procedural
Component list, interconnections, functions, geometry, materials, design process structure and relation to components
8
2ND NORDIC CONFERENCE ON PRODUCT LIFECYCLE MANAGEMENT - NORDPLM’09, GÖTEBORG, JANUARY 28-29 2009
5
Comparison of metrics and representations
To evaluate the representations against the assessment methods which were reviewed, “compatibility” and “coverage” scores were calculated for each representation. Compatibility values were defined as the fraction of the information needs of a metric that a given representation could provide, as indicated in equation (1) below. The individual compatibilities were then averaged for each representation to give its overall compatibility scores, as shown in equation (2) below. A second overall score, the coverage score, was defined as the fraction of metrics for which a given representation provides all the required information, as shown in equation (3) below. These scoring methods assumed that it was equally important to be able to evaluate different metrics (a separate consideration from the importance of the corresponding objectives); if not, different methods – such as weighting factors – could be used. D
∑ compatibility ij=
k =1 D
pik u jk
∑ u jk
(1)
k= 1 M
∑ compatibilityij compatibility score i=
j= 1
(2)
M M
∑ cij coverage score i=
j= 1
(3)
M
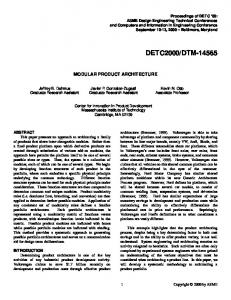
Where: compatibilityij = the compatibility between representation i and metric j pik = 1 if data item k is provided by representation i, or 0 otherwise ujk = 1 if data item k is used by metric j, or 0 otherwise {R, M, D} = the total number of {representations, metrics, data items} considered (15, 27 and 55 respectively) compatibility scorei = the overall compatibility score of representation i coverage scorei = the coverage score of representation i cij = 1 if compatibilityij is 1, or 0 otherwise. Figure 3 gives a diagrammatic overview of how the scores were calculated. The compatibility and coverage scores for each representation are shown in Figure 4.
9
2ND NORDIC CONFERENCE ON PRODUCT LIFECYCLE MANAGEMENT - NORDPLM’09, GÖTEBORG, JANUARY 28-29 2009
Figure 3. A diagrammatic overview illustrating how compatibility and coverage scores were calculated.
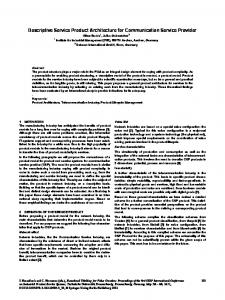
Figure 4. The compatibility and coverage scores of the representations under consideration.
6
Discussion
As shown in Figure 4, 14 of the 15 modelling languages reviewed fall into one of 3 clusters: those with compatibility scores of 21-33%; those with compatibility scores of 38-49% and coverage scores of 7-11%; and those with compatibility scores of 58-64% and coverage scores of 30-33%. The boundary of Cluster 3 is drawn in order to group the three modelling languages that incorporate procedural information as well as schematic information (ISO standard 10303 (STEP) [32], the MOKA modelling language (MML) [28] and the Cambridge Product Data Model [33]). In particular, they allow the modeller to represent the design tasks
10
2ND NORDIC CONFERENCE ON PRODUCT LIFECYCLE MANAGEMENT - NORDPLM’09, GÖTEBORG, JANUARY 28-29 2009
associated with components. The NIST CPM [34] does not include this and thus falls outside the cluster. The most complete modelling language studied is MML. However its coverage score is still only 33% and thus it cannot support, even in principle, the majority of the metrics considered. In particular, MML does not represent: specifications and requirements; processes apart from the design process; effects of engineering change; or component attributes apart from geometry (e.g. reliability). The lack of these data items means that many objectives relating to downstream life-cycle processes, such as assembly and reliability, cannot be assessed using product modelling languages found in the literature. The “information gap” identified in these results could be addressed, for instance, by extending the MML representation to use its existing design process modelling syntax for describing other processes such as assembly, and additions to the component attributes for describing engineering change, reliability and other component details. However, extending MML or any of the other Cluster 3 modelling languages to include such information would further increase their (already significant) complexity and make them more difficult to apply in an industry context. This could be addressed by steering the user through the complexity of the full modelling language using a dynamic user interface in an appropriate software implementation. Alternatively it may prove more appropriate to adapt existing metrics to use a simpler representation using one of the tactics suggested in Section 3.4. These two approaches point to evaluation of the metrics earlier or later in the design process, respectively. A third alternative would be to make use of separate systems to predict the “detailed” data of a product architecture from the “early” data (with a possibility to update the predictions as more detailed designs become available), which would allow the use of unaltered metrics. Shortcomings of the comparison method described in Section 5 include:
7
•
Levels of detail: The links between representations/metrics and data items have been represented as binary – assuming that a given representation/metric either incorporates/requires a given data item or not. In reality, though, information may be represented or required at different levels of detail. The presence or absence of such information may therefore affect the uncertainty of a metric result, or whether a metric can be evaluated at all.
•
Mapping of similarities between representations or metrics: More detailed analysis could establish patterns underlying the results presented above – in particular, what groups or clusters of metrics and representations are present (defined in terms of the information items they share).
•
Errors: The mappings from metrics and representations to data items were manually compiled based on the published literature. Due to misinterpretation there may therefore be inaccuracies in the results.
Conclusions and further work
Representing a product’s architecture within a product modelling language can support its assessment against numerous life-cycle objectives. This paper has reviewed life-cycle metrics and product modelling languages from the perspectives of the information they respectively require and provide. Organising frameworks were developed for both the metrics and the representations. By considering the information needs of a set of 27 metrics, 15 different representations were evaluated quantitatively for their “completeness”. Overall, the MOKA 11
2ND NORDIC CONFERENCE ON PRODUCT LIFECYCLE MANAGEMENT - NORDPLM’09, GÖTEBORG, JANUARY 28-29 2009
Modelling Language [28] was judged to be the most complete of the representations reviewed, representing the types of information needed by 33% of metrics studied. Although it or other modelling languages could potentially be extended to represent the information required by a wider range of life-cycle metrics, such a comprehensive representation would be complex and might be difficult to use in practice. There is therefore a need to bridge the gap between the information required by life-cycle assessment methods and that which may feasibly be provided by product architecture representations, in order that these approaches can better support architecture selection early in the design process.
Acknowledgements The authors would like to thank the Schiff Foundation for supporting this research, as well as the members of the KIM Project, Claudia Eckert and Warren Kerley for insightful comments.
References [1] Ulrich K., "The role of product architecture in the manufacturing firm", Research Policy, Vol. 24, 1995, pp 419-440. [2] Stone R.B., Wood K.L. and Crawford R.H., "A heuristic method to identify modules from a functional description of a product", Proceedings of the ASME Design Engineering Technical Conference (DETC98), 1998. [3] Otto K. and Wood K., "Product Design – Techniques in reverse engineering and new product development", Prentice-Hall, Upper Saddle River, New Jersey, USA, 2001. [4] Huang G.Q., "Design for X - Concurrent Engineering Imperatives", Chapman & Hall, London, 1996. [5] Weber C., Steinbach M., Botta C. and Deubel T., "Modelling of Product-Service Systems (PSS) based on the PDD approach", Proceedings of the International Design Conference (DESIGN 2004), Dubrovnik, Croatia, 2004. [6] Watson B.A., Radcliffe D.F. and Dale P., "A meta-methodology for the application of DfX guidelines", in Design for X - Concurrent Engineering Imperatives (Huang G.Q. (Ed.)), Chapman & Hall, 1996, pp 441-462. [7]
"Boothroyd-Dewhurst, Inc.", http://www.dfma.com/.
[8] Pahl G. and Beitz W., "Engineering Design: A Systematic Approach", Wallace K. (Ed.), Springer, London, 1996. [9] Aguirre-Esponda G.J., "Evaluation of Technical Systems at the Design Stage" (PhD thesis, Engineering Design Centre, University of Cambridge), 1992. [10] Olesen J., "Concurrent development in manufacturing - based on dispositional mechanisms" (PhD thesis, Institute of Engineering Design, Technical University of Denmark), 1992. [11] Bauer S., "Design for X – Ansätze zur Definition und Strukturierung", 14th DfX Symposium, Neukirchen, Germany, 2003. [12] Reik M.P., Culley S.J., Owen G.W., Mileham A.R. and McIntosh R.I., "A Novel Product Performance Driven Categorisation of DFX Methodologies", Proceedings of the Second International Conference on Manufacturing Research (ICMR2004), 2004.
12
2ND NORDIC CONFERENCE ON PRODUCT LIFECYCLE MANAGEMENT - NORDPLM’09, GÖTEBORG, JANUARY 28-29 2009
[13] Watson B.A. and Radcliffe D.F., "Structuring Design for X Tool Use for Improved Utilization", Journal of Engineering Design, Vol. 9, 1998, pp 211-223. [14] Watson B.A. and Radcliffe D.F., "A comparison of DfX evaluation tools", Proceedings of the International Conference on Engineering Design (ICED 95), Vol. 3, Praha, Czech Republic, 1995. [15] Meerkamm H., "Design for X - A Core Area of Design Methodology", Journal of Engineering Design, Vol. 5, 1994, pp 145-163. [16] Huang G.Q. and Mak K.L., "The DfX shell: a generic framework for developing Design for X tools", Robotics & Computer-Integrated Manufacturing, Vol. 13, 1997, pp 271280. [17] Meerkamm H. and Koch M., "Design for X", in Design Process Improvement: A Review of Current Practice (Clarkson P.J. and Eckert C.M. (Eds.)), Springer-Verlag UK, 2005, pp 306-323. [18] Otto K. and Hölttä-Otto K., "A multi-criteria assessment tool for screening preliminary product platform concepts", Journal of Intelligent Manufacturing, Vol. 18, 2007, p 59–75. [19] Faerber M., Jochaud F., Stöber C., Jablonski S. and Meerkamm H., "Knowledge oriented process management for DfX", Proceedings of the International design conference (DESIGN 2008), Dubrovnik, Croatia, 2008. [20] Sousa I. and Wallace D., "Product classification to support approximate life-cycle assessment of design concepts", Technological Forecasting and Social Change, Vol. 73, 2006, pp 228-249. [21] Murdoch T., "Configuration evaluation and optimisation of technical systems" (PhD thesis, Engineering Design Centre, University of Cambridge), 1993. [22] PRé Consultants, "Eco-indicator 99 Manual for Designers", Ministry of Housing, Spatial Planning and the Environment, The Hague, The Netherlands, 2000. [23] Gopalakrishnan B., Chintala S., Adhikari S. and Bhaskaran G., "Design for storage and distribution", in Design for X - Concurrent Engineering Imperatives (Huang G.Q. (Ed.)), Chapman and Hall, 1996, pp 230-244. [24] Subrahmanian E., Rachuri S., Bouras A., Fenves S.J., Foufou S. and Sriram R.D., "The Role of Standards in Product Lifecycle Management Support", (Technical Report, National Institute of Standards and Technology, number NISTIR 7289), 2006. [25] Malmqvist J., "A classification of matrix-based methods for product modelling", Proceedings of the International Design Conference (DESIGN 2002), Dubrovnik, Croatia, 2002. [26] Stiny G., "Introduction to Shape and Shape Grammars", Environment and Planning B, Vol. 7, 1980, pp 343-351. [27] "Simulink® - Simulation and Model-Based Design", http://www.mathworks.com/products/simulink/. [28] MML Working Group, "MOKA User Guide (MOKA Modelling Language Core Definition)" (Technical Report), 2000.
13
2ND NORDIC CONFERENCE ON PRODUCT LIFECYCLE MANAGEMENT - NORDPLM’09, GÖTEBORG, JANUARY 28-29 2009
[29] Brimble R. and Sellini F., "The MOKA Modelling Language", Proceedings of the 12th International Conference on Knowledge Engineering and Knowledge Management (EKAW2000), 2000. [30] Andreasen M.M., "Designing on a 'designer's workbench' (DWB)", Proceedings of the 9th WDK Workshop, Rigi, Switzerland, 1992. [31] Browning T.R., "Applying the design structure matrix to system decomposition and integration problems: a review and new directions", IEEE Transactions on Engineering Management, Vol. 48, 2001, pp 292-306. [32] International Organization for Standardization, "ISO 10303-233 - Industrial automation systems and integration - Product data representation and exchange - Part 233: Systems engineering data representation", 2008. [33] Murdoch T.N.S. and Ball N.R., "The development of an EDC product data model", (Technical Report, Engineering Design Centre, University of Cambridge, number CUED/CEDC/TR21), 1995. [34] Sudarsan R., Fenves S.J., Sriram R.D. and Wang F., "A product information modeling framework for product lifecycle management", Computer-Aided Design, Vol. 37, 2005, pp 1399-1411. [35] Girard P., Castaing A. and Noel F., "Product – Process – Organisation Integration to Support Design Performance", Proceedings of the Pacific Conference on Manufacturing (PCM 2002), Bangkok, 2002. [36] Simons C.S., "Change propagation in product design: a change prediction method" (MPhil thesis, Engineering Design Centre, University of Cambridge), 2000. [37] Stephenson J.A. and Wallace K.M., "Design for reliability in mechanical systems", Proceedings of the 10th International Conference on Engineering Design (ICED'95), Vol. 3, 1995. [38] Albers A., Matthiesen S. and Ohmer M., "An innovative new basic model in design methodology for analysis and synthesis of technical systems", Proceedings of the 14th International Conference on Engineering Design (ICED ’03), Stockholm, Sweden, 2003. [39] Object Management Group, "OMG Systems Modeling Language (OMG SysML) v1.0 available specification", 2007. [40] Paynter H.M., "Analysis and Design of Engineering Systems", MIT Press, Cambridge, MA, USA, 1961. [41] Chasiotis C., "Prozessbegleitende Wissensdokumentation und integrierte Wissensvisualisierung in der Digitalen Produktentwicklung" (PhD thesis, University Bochum), 2006. Corresponding author: David Wyatt Cambridge Engineering Design Centre Department of Engineering, Trumpington Street, Cambridge CB2 1PZ, United Kingdom Telephone: +44 (0)1223 332 673 Fax: +44 (0)1223 766 963 E-mail:
[email protected] URL: http://www-edc.eng.cam.ac.uk
14