1.3.4.2 Could substratum choice affect the climax community in a biofilm? ...... An algal mat, on the other hand, will have diurnally changing anaerobic regions ...
Comparing the Distribution of Pathogenic Bacteria and Common Indicator Microorganisms in Biofilms on Different Surface Types in an Agricultural Watershed in British Columbia (Canada) by Rasha Maal-Bared
A THESIS SUBMITTED IN PARTIAL FULFILLMENT OF THE REQUIREMENTS FOR THE DEGREE OF DOCTOR OF PHILOSOPHY in THE FACULTY OF GRADUATE STUDIES (Resource Management and Environmental Studies)
THE UNIVERSITY OF BRITISH COLUMBIA (Vancouver) May 2008 © Rasha Maal-Bared, 2008
Abstract Little is known about the distribution of bacterial indicators and pathogens in biofilms on different surface types in natural aquatic environments. This study was conducted to examine the distribution of pathogens and indicator bacteria in biofilms in an agricultural watershed. The study particularly focused on whether biofilms can act as sinks for pathogenic organisms and could be monitored to protect public health. To do so, we monitored the presence of faecal contamination indicators (heterotrophic plate counts, faecal coliforms, enterococci, and E. coli) and particular pathogens (E. coli 0157, Campylobacter sp. and Salmonella sp.) in water, sediment, and in biofilms on river and slate rock, wood, sandpaper, and LexanTM in Elk Creek (British Columbia, Canada) from December 2005 to April 2007. Faecal indicator concentrations and pathogen presence were evaluated using standard culturing and isolation methods. The results showed that both faecal indicators and pathogens were present at the headwaters and that the use of water column grab samples underestimated faecal indicator numbers. Also, water column grab samples during the dry season were not representative of pathogens present in the creek. This indicates that biofilms might be the main reservoir of Salmonella sp. and pathogenic E. coli O157 in the summer when rainfall (which results in flow changes and sloughing) is limited. Campylobacter sp. was not retrieved in the dry season. Campylobacter on sediment, slate rock and wood showed high correlations with nitrates and enterococci, which could be used as faecal contamination surrogates. Numbers of indicator organisms and pathogens in one-month biofilms were compared to those in long-term biofilms (colonized 12 and 24 weeks) and short-term biofilms (colonized one to three weeks). The comparison showed that surface type, colonization period and water quality all affected the concentration of indicator organisms and pathogens present in biofilms. Finally, results showed high levels of phenotypic antibiotic resistance of E. coli and pathogenic E. coli O157 isolated from the watershed (even at the headwaters), particularly to tetracycline, ampicillin and streptomycin. This study highlights the potential biofilms could play in prediction of water quality changes, the improvement of sampling methods, and the study of aquatic environments.
ii
Table of Contents Abstract ............................................................................................................................................... ii Table of Contents................................................................................................................................ iii List of Tables.......................................................................................................................................vi List of Figures................................................................................................................................... viii Acknowledgements...............................................................................................................................x Co-Authorship statement......................................................................................................................xi 1 Introduction..................................................................................................................................1 1.1 Monitoring microbial water quality: Are we doing the best job we can?.............................. 1 1.2 Effects of agriculture on microbial water quality................................................................. 1 1.2.1 Sources of pathogens in agricultural watersheds ...........................................................1 1.2.2 Pathogen transport and storm events ............................................................................2 1.2.3 Monitoring microbial water quality ..............................................................................3 1.3 Biofilms .............................................................................................................................. 4 1.3.1 What are Biofilms? ......................................................................................................4 1.3.2 Biofilm Characteristics.................................................................................................7 1.3.3 Maturation and succession in biofilms..........................................................................8 1.3.3.1 Formation ............................................................................................................... 8 1.3.3.2 Detachment .......................................................................................................... 10 1.3.4 Can biofilms be used as monitoring tools ...................................................................11 1.3.4.1 Presence of pathogens in biofilms ......................................................................... 11 1.3.4.2 Could substratum choice affect the climax community in a biofilm?...................... 12 1.4 Research objectives and hypotheses................................................................................... 13 1.4.1 Main research objective .............................................................................................13 1.4.2 Research questions and hypotheses ............................................................................13 1.5 References ........................................................................................................................ 20 2 Seasonal and spatial distribution of indicators and pathogens in biofilms in agricultural watersheds: is monitoring water column grab samples sufficient?........................................................30 2.1 Introduction ...................................................................................................................... 30 2.2 Methods ............................................................................................................................ 32 2.2.1 Sampling location- Elk Creek.....................................................................................32 2.2.2 Biofilm samplers........................................................................................................34 2.2.3 Sample collection.......................................................................................................35 2.2.4 Microbial analyses .....................................................................................................36 2.2.4.1 Bacterial indicator organisms and E. coli O157 analysis........................................ 36 2.2.4.2 Salmonella spp. analysis ....................................................................................... 36 2.2.4.3 Campylobacter spp. analysis ................................................................................. 37 2.2.4.4 Controls................................................................................................................ 37 2.2.5 Standardizing across different substrata......................................................................37 2.2.6 Statistical Analyses ....................................................................................................38 2.3 Results .............................................................................................................................. 39 2.3.1 Comparing indicator organism numbers and pathogen frequencies recovered from water column, sediment and biofilms samples at each site...........................................................39 2.3.2 Indicator concentrations .............................................................................................41 2.3.3 Pathogen presence......................................................................................................42 2.4 Discussion......................................................................................................................... 46 2.5 Conclusion ........................................................................................................................ 52 2.6 Acknowledgements ........................................................................................................... 52 2.7 References ........................................................................................................................ 54
iii
3 Effects of surface types, water quality indicators and colonization period on the distribution of indicator bacteria and pathogenic organisms in biofilms in an agricultural watershed ..........................59 3.1 Introduction ...................................................................................................................... 59 3.2 Methods ............................................................................................................................ 61 3.2.1 Sampling location- Elk Creek.....................................................................................61 3.2.2 Biofilm samplers........................................................................................................62 3.2.3 Sample collection.......................................................................................................62 3.2.4 Microbial analysis......................................................................................................63 3.2.5 Standardizing across different substrata......................................................................63 3.2.6 Other water quality parameters...................................................................................63 3.2.7 Statistical analyses .....................................................................................................65 3.3 Results .............................................................................................................................. 65 3.3.1 Water quality in Elk Creek.........................................................................................65 3.3.2 Variations in one-month biofilm samplers analyzed by substratum type and site.........69 3.3.3 Long- and short-term biofilms....................................................................................73 3.3.4 Relationships between water quality variables, indicator organisms and pathogens in biofilms in short and long-term biofilms .....................................................................................76 3.4 Discussion......................................................................................................................... 78 3.5 Conclusions ...................................................................................................................... 84 3.6 Acknowledgements ........................................................................................................... 85 3.7 References ........................................................................................................................ 86 4 Campylobacter spp. distribution in Elk Creek British Columbia: improving sampling techniques 90 4.1 Introduction ...................................................................................................................... 90 4.2 Methods ............................................................................................................................ 92 4.2.1 Evaluating substrata for Campylobacter spp. monitoring purposes..............................92 4.2.2 Sampling location- Elk Creek.....................................................................................93 4.2.3 Biofilm samplers........................................................................................................93 4.2.4 Sample collection.......................................................................................................94 4.2.5 Campylobacter spp. analysis ......................................................................................94 4.2.6 Sample analysis .........................................................................................................95 4.2.7 Standardizing across different substrata......................................................................95 4.2.8 Water quality parameters ...........................................................................................95 4.2.9 Statistical Analyses ....................................................................................................95 4.3 Results and Discussion ...................................................................................................... 95 4.3.1 Campylobacter prevalence on different substrata........................................................95 4.3.2 Campylobacter correlation with other microbial water quality indicator bacteria.........98 4.3.3 Correlating Campylobacter prevalence in different biofilms with physical and chemical water quality characteristics ......................................................................................................100 4.3.4 Substrata evaluation for Campylobacter spp. monitoring ..........................................104 4.4 Conclusion ...................................................................................................................... 104 4.5 Acknowledgements ......................................................................................................... 106 4.6 References ...................................................................................................................... 107 5 Distribution and patterns of phenotypic antibiotic resistant Escherichia coli isolates from an agricultural watershed (Elk Creek, British Columbia)........................................................................111 5.1 Introduction .................................................................................................................... 111 5.2 Methods................................................................................................................................. 112 5.2.1 Sample collection.............................................................................................................112 5.2.2 Sample preparation ..........................................................................................................113 5.2.3 Broth microdilution MIC..................................................................................................113 5.2.4 Water quality data............................................................................................................114 5.2.5 Statistical analyses ...........................................................................................................114 5.3 Results ................................................................................................................................... 114 5.3.1 General phenotypic antibiotic resistance patterns in the watershed based on broth microdilution MIC results.........................................................................................................114
iv
5.3.2 Differences in phenotypic antibiotic resistance by site ......................................................117 5.3.3 Differences in phenotypic antibiotic resistance by substratum...........................................121 5.3.4 Pathogenic E. coli O157 antibiotic resistance ...................................................................121 5.3.5 Relationships between antibiotic resistance and other water quality parameters in the watershed 122 5.4 Discussion ............................................................................................................................. 126 5.5 Acknowledgements................................................................................................................ 132 5.6 References ............................................................................................................................. 133 6 Discussion ................................................................................................................................139 6.1 Summary of results and status of working hypotheses ............................................................ 139 6.2 Significance of the research.................................................................................................... 144 6.3 Strengths and limitations of the research................................................................................. 145 6.4 Future research....................................................................................................................... 147 6.5 References ............................................................................................................................. 149 Appendix A Elk Creek Pictures .................................................................................................. 153 Appendix B Biofilm Sampler Pictures ........................................................................................ 157 Appendix C Protozoa numbers within biofilms colonizing different substrata in Elk Creek ......... 159
v
List of Tables Table 2.1 Descriptive statistics and Kruskal-Wallis test results for indicator organism numbers (heterotrophic plate counts (HPC CFU/mg), faecal coliforms (FC MPN/mg), E. coli (EC MPN/mg), and enterococci (ENT MPN/mg)) in biofilms on different substrata in the wet season (n=11, total number of analyzed samples for all substrata=132) Descriptive statistics are shown as means, standard error in means (SE), medians, and variances (σ). Kruskal-Wallis analysis of variance test results are shown in terms of χ2 statistics, and p-values, and statistically significant results are bolded....................................................................................................................... 43 Table 2.2 Descriptive statistics and Kruskal-Wallis test results for indicator organism numbers (heterotrophic plate counts (HPC CFU/mg), faecal coliforms (FC MPN/mg), E. coli (EC MPN/mg), and enterococci (ENT MPN/mg)) in biofilms on different substrata in the dry season (n=6, total number of analyzed samples=72). Descriptive statistics are shown as means, standard error in means (SE), medians, and variances (σ). Kruskal-Wallis analysis of variance test results are shown in terms of χ2 statistics and p-values, and statistically significant results are bolded.... 44 Table 2.3 Percentage of samples positive for Campylobacter sp., Salmonella sp. and pathogenic E. coli O157 in biofilms, water and sediment on different surface types in the wet and the dry seasons. Table also presents number of samples tested in both seasons (nwet and nDry) and results of χ2 test. .................................................................................................................................................. 45 Table 3.1 Physical water quality variables measured at four sites in Elk Creek (BC) between December 2005 and April 2007 presented as means, medians, standard deviations, and sample sizes (n)..... 67 Table 3.2 Chemical water quality variables measured at four sites in Elk Creek (BC) between December 2005 and April 2007 presented as means, medians, standard deviations, and sample sizes (n). .................................................................................................................................... 68 Table 3.3 Biological water quality variables measured at four sites in Elk Creek (BC) between December 2005 and April 2007 presented as means, medians, standard deviations, and sample sizes (n). .................................................................................................................................... 69 Table 3.4 Results of Spearman correlations between indicators organisms numbers (Heterotrophic plate counts (HPC), faecal coliforms (FC), E. coli (EC) and enterococci (ENT)), pathogen frequencies (Campylobacter sp. (Campy), Salmonella sp. (Sal), and pathogenic E. coli O157 (EC O157)), ashfree dry weights (AFDW) in water, sediment and biofilms colonized for one month and water quality variables at different sites in Elk Creek (BC). A positive sign (+) indicates a positive relationship, while a negative sign (-) indicates a negative relationship....................................... 71 Table 3.5 Trends and variations in the concentrations of indicator organisms and presence of pathogens in biofilms collected from short- and long-term samplers across different sites........................... 73
vi
Table 3.6 Comparing water quality variables relationships with indicator bacteria concentrations and pathogen presence in biofilms on different surfaces, which were colonized for short- and longterm periods............................................................................................................................... 77 Table 4.1 Prevalence of Campylobacter sp. during the wet and the dry season in water and in biofilms on different surface types in Elk Creek, British Columbia. ......................................................... 97 Table 4.2 Spearman coefficients and p-values for associations between Campylobacter sp. (Camp) presence in water, slate rock, wood and sediment and the average numbers of heterotrophic plate counts (HPC), faecal coliforms (FC), E. coli (EC) and enterococci (ENT) found in the same media between December 2005 and December 2006. Statistically significant relationships (p64
0.5
0.25
0.125
Total
>64
1
0.5
0.25
0.125
Total
>64
1
0.5
0.25
0
0.125
10
4
MIC 5 0% w ith in Site
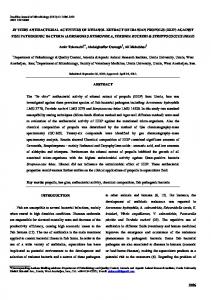
Figure 5.2 Total number of E. coli isolates resistant to Ampicillin, Cefotaxime, and Ciprofloxacin at the stated minimum inhibitory concentration (MIC 50%) at sites 1 to 4 in Elk Creek (British Columbia).
119
D) Nalidixic Acid 80
Sum(Frequency)
70 60 50 40 30 20
1 2 4 8 16 32 64 128 >512 Total
1 2 4 8 16 32 64 128 >512 Total
1 2 4 8 16 32 64 128 >512 Total
0
1 2 4 8 16 32 64 128 >512 Total
10
1
2
3
4
MIC 50% w ithin Site
E) Streptomycin 80 70 Sum(Frequency)
60 50 40 30 20
1
3
512
Total
256
64
128
8
16
4
2
512
Total
256
64
128
8
2
16
4
2
512
Total
256
64
128
8
16
4
2
512
Total
256
64
128
8
16
2
0
4
10
4
MIC 5 0 % w ith in S ite
F) Tetracycline
Sum(Frequency)
70 60 50 40 30 20
0.5 2 4 8 16 32 64 128 256 >256 Total
0.5 2 4 8 16 32 64 128 256 >256 Total
0.5 2 4 8 16 32 64 128 256 >256 Total
0
0.5 2 4 8 16 32 64 128 256 >256 Total
10
1
2
3
4
MIC 50% w ith in Site
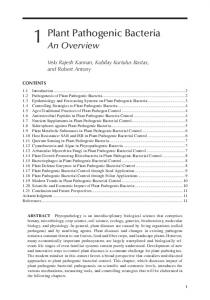
Figure 5.2 Total number of E. coli isolates resistant to Nalidixic Acid, Streptomycin and Tetracycline at the stated minimum inhibitory concentration (MIC 50%) at sites 1 to 4 in Elk Creek (British Columbia).
120
5.3.3 Differences in phenotypic antibiotic resistance by substratum Table 5.3 shows the distribution of susceptible, moderately susceptible and resistant E. coli on different surface types at all sites in Elk Creek. The frequencies of antibiotic resistance level were reported in percentages to take into account the fact that isolation frequencies of E. coli differed based on substratum type. Table 5.3 shows that resistance was most common in sediment and river rock isolates. Lexan and sandpaper biofilms, as well as water, were the substrata most likely to be associated with antibiotic susceptible E. coli. Two chi-square tests were performed to evaluate whether the differences in E. coli resistance levels among different substrata types were statistically significant. The first tests evaluating general E. coli resistance levels (susceptible, moderately susceptible and resistant) on different substrata were not statistically significant (pvalue=0.432). Table 5.3 Distribution of susceptible, moderately susceptible, and resistant E. coli in water, sediment and in biofilms on river rock, slate rock, wood, Lexan, and sandpaper isolated from all sites at Elk Creek British Columbia Resistance Level (% Isolates) Substratum Susceptible
Moderately Susceptible Resistant
Water River Rock Slate Rock Wood Lexan Sandpaper Sediment
6% 8% 5% 0% 12 % 4% 3%
71 % 53 % 68 % 72 % 76 % 74 % 53 %
24 % 39 % 27 % 28 % 12 % 22 % 44 %
Total number of isolates 17 36 22 25 17 23 34
The second chi-square test evaluated the differences in E. coli antibiotics resistance levels for each antibiotic and each substratum separately using the actual MICs. The differences in ampicillin, cefotaxime and tetracycline were statistically significant, with p-values of