c ESO 2008
Astronomy & Astrophysics manuscript no. hsmodeling April 2, 2008
Comparing various multi-component global heliosphere models H.-R. M¨ uller1,2 , V. Florinski2 , J. Heerikhuisen2 , V.V. Izmodenov3,5 , K. Scherer4 , D. Alexashov5 , and H.-J. Fahr6
arXiv:0804.0125v1 [astro-ph] 1 Apr 2008
1
2
3
4
5 6
Department of Physics and Astronomy, Dartmouth College, Hanover NH 03755, USA e-mail:
[email protected] Institute of Geophysics and Planetary Physics, University of California, Riverside CA 92521, USA e-mail:
[email protected];
[email protected] Lomonosow Moscow State University, Department of Mechanics and Mathematics & Institute of Mechanics, Moscow 119899, Russia e-mail:
[email protected] Ruhr-Universit¨ at Bochum, Institut f¨ ur Theoretische Physik IV: Weltraum- und Astrophysik, 44780 Bochum, Germany e-mail:
[email protected] Institute for Problems in Mechanics, Russian Academy of Sciences, Moscow 119526, Russia Argelander Institute for Astronomy, Dept. of Astrophysics, University of Bonn, Auf dem H¨ ugel 71, 53121 Bonn, Germany e-mail:
[email protected]
Received September 19, 2007; accepted March 31, 2008 ABSTRACT Context. Modeling of the global heliosphere seeks to investigate the interaction of the solar wind with the partially ionized local interstellar medium. Models that treat neutral hydrogen self-consistently and in great detail, together with the plasma, but that neglect magnetic fields, constitute a sub-category within global heliospheric models. Aims. There are several different modeling strategies used for this sub-category in the literature. Differences and commonalities in the modeling results from different strategies are pointed out. Methods. Plasma-only models and fully self-consistent models from four research groups, for which the neutral species is modeled with either one, three, or four fluids, or else kinetically, are run with the same boundary parameters and equations. They are compared to each other with respect to the locations of key heliospheric boundary locations and with respect to the neutral hydrogen content throughout the heliosphere. Results. In many respects, the models’ predictions are similar. In particular, the locations of the termination shock agree to within 7% in the nose direction and to within 14% in the downwind direction. The nose locations of the heliopause agree to within 5%. The filtration of neutral hydrogen from the interstellar medium into the inner heliosphere, however, is model dependent, as are other neutral results including the hydrogen wall. These differences are closely linked to the strength of the interstellar bow shock. The comparison also underlines that it is critical to include neutral hydrogen into global heliospheric models. Key words. heliosphere – interstellar neutral hydrogen – numerical models – kinetic models – multi-fluid models
1. Introduction The interstellar medium in the immediate solar neighborhood is part of the “local interstellar cloud” (LIC). The flow of the partially ionized LIC past the Sun constitutes a pressure that balances and terminates the expansion of the coronal solar wind. These two winds create a morphology that includes the termination shock transition of the supersonic solar wind to a hot heliosheath or heliotail flow. An interstellar bow shock is likely to be necessary as well to decelerate the LIC flow. The ionized flows of the LIC and the solar wind are separated by the heliopause. The LIC also supplies the system with interstellar neutrals, predominantly with neutral hydrogen (H). Neutral H interacts weakly with the plasma, mainly through charge exchanges with plasma protons. The distance even to the termination shock is large enough that there are only a few in-situ measurements Send offprint requests to: H. M¨ uller
to date in the outer heliosphere. Notable sources of information are the two Voyager spacecraft at a distance of 104 AU and 84 AU from the Sun (2007 September), respectively, with Voyager 1 having passed into the heliosheath region on 2004 December 16 (e.g., Stone et al. 2005), and Voyager 2 on 2007 August 30. For examples of in-depth analyses of observations relating to the outer heliosphere, we refer to other contributions in this special issue (Bzowski et al. 2008; Pryor et al. 2008; Richardson et al. 2008; Slavin & Frisch 2008). Data from the outer heliosphere are sparse, and numerical modeling of the global heliosphere/LIC system plays an important role for the analysis and interpretation of observations. It is needed to relate the undisturbed LIC flow and its physical parameters to the processed and changed flow that we observe in the heliosphere inside the termination shock. In fundamental ways all the LIC constraints formulated in the accompanying papers (Bzowski et al. 2008; Pryor et al. 2008; Richardson et al. 2008; Slavin & Frisch
2
H.-R. M¨ uller et al.: Comparing multi-component global heliosphere models
2008) involve global heliosphere modeling. Also the evaluation of future data sets from the Interstellar Boundary Explorer (IBEX) mission, which focuses on secondary neutrals created in the heliosphere and on the LIC oxygen and helium flow through the heliosphere (McComas et al. 2004), depends crucially on this kind of modeling. All such global models make assumptions and simplifications, most often with the goal of isolating the influence of a specific physical effect (e.g., the tilt of the LIC magnetic field with respect to the LIC flow vector), or in order to keep computation times reasonable. The identification of heliospheric asymmetries with respect to the helium LIC flow vector (M¨ obius et al. 2004; Lallement et al. 2005, and references therein) has increased interest in the development of realistic, three-dimensional (3D) MHD models, as different orientations and strengths of the interstellar magnetic field can help to explain these asymmetries. However, the fact remains that neutral interstellar H entering the heliosphere has a more decisive influence on the heliospheric shape, extent, and particle content. For this reason, we focus here on numerical models that treat the plasma/neutral interaction in a self-consistent way, but neglect the influence of interplanetary or interstellar magnetic fields. The models are, in principle, 3D plasma/neutral codes for which plasma and neutrals are coupled by charge exchange. Wherever it is possible, the assumption of azimuthal symmetry reduces the numerical methods effectively to 2D while still calculating the 3D heliosphere. The results of our investigation will be also applicable to 3D MHD models (for a recent overview, see Pogorelov et al. (2008)), as long as the latter also include neutrals self-consistently, as is essential for models of the global heliosphere. The charge exchange interaction is weak enough that the mean free path lengths of neutral H are often large compared to typical heliospheric distances (see the discussion in section 3.2). Neutral H is thought to be in local thermodynamic equilibrium in the LIC, but as charge exchange proceeds in the heliosphere, secondary neutrals arise, and they also can exchange charge with plasma ions. This effectively drives neutrals out of equilibrium in the heliosphere, and plasma and neutrals equilibrate again only far away from the heliosphere. In H-p charge exchange, the newly born (secondary) neutral H has the velocity characteristics of the plasma protons at the location of interchange. However, the neutral is no longer bound to the plasma flow and follows a simpler trajectory than the underlying plasma parcel. Due to this, it is convenient to sort the neutrals into different populations depending on their origin. We will label here as component 1 the primary neutrals directly from the ISM as well as those born in charge exchange outside the bow shock. Component 2 are those secondary neutrals that are created by charge exchange between bow shock and heliopause. They reflect the conditions of the warmer interstellar plasma decelerated in the bow shock. Because of the deceleration, there is a neutral density increase downstream of the bow shock, the hydrogen wall. We label as component 3 neutrals those that are born from the hot heliosheath and heliotail plasma, and component 4 those born in the supersonic solar wind between the Sun and the termination shock. Component 3 neutral velocities are dominated by the large thermal proton velocity of the heliosheath and heliotail, and hence their direction is mostly random. Since a fraction of component 3 neutrals
are directed to the innermost heliosphere and can be detected as energetic neutral H, this whole component 3 is often referred to as “heliospheric ENA” (energetic neutral atoms). The fourth neutral component has recently been called “neutral solar wind” (NSW) because its cold, fast velocity characteristics are similar to those of the supersonic wind of the inner heliosphere. Note that in spite of its name, the NSW as defined here is distinct from the neutral hydrogen originating from the Sun (e.g., Blum & Fahr 1970; Olsen et al. 1994), which has been called neutral solar wind earlier as well. In the non-MHD models that are currently applied to the global heliosphere problem there is agreement that due to the out-of-equilibrium nature of neutral H it needs to be modeled separately from the ionized matter. The plasma is commonly modeled by gas-dynamic methods. There are two different popular methods for treating the neutrals, to be coupled to the plasma in a self-consistent way. The first method is kinetic, where particle methods such as MonteCarlo simulate the neutral populations on a Boltzmannmicroscopic level. The kinetic treatment is motivated by the usually large mean free paths of neutrals. The second approach, the multi-fluid method, is to simulate each of the four neutral components as a separate fluid on an Euler-macroscopic level, and assumes that the superposition of the resulting four Maxwellian distributions represents the true, generalized distribution function of heliospheric neutral H well. Sometimes, fluid models are being restricted further (by choice) by decreasing the number of fluids to less than four, as in the Zank et al. (1996) multifluid model (component 1 and 2 combined into one fluid) and the Fahr et al. (2000) Bonn model (components 1–4 combined, but fluids describing pickup ions and cosmic rays introduced). Without going into any detail, the two neutral modeling approaches can be summarized as follows. The main advantage of the kinetic approach is that it does not restrict the shape of the neutral distribution function, and thus allows the irregularity of the neutral distribution in the heliosphere to persist everywhere in the heliosphere. The main advantage of the fluid approaches is that they are orders of magnitude faster computationally, and that their usual field variables (density, velocity, pressure) are smooth down to the grid and timestep resolution. The main disadvantage of particle kinetic methods is that their accuracy is driven by particle statistics, i.e. to increase the accuracy of results for a particular location at a particular time, more particles have to be generated to coincide there at the desired time. Both kinetic models below (section 3) employ variable particle weights to allow trajectories to be split, leading to a significant improvement in the statistical accuracy (to a targeted ∼2% level) at reasonable computational costs. The splitting procedure used in the Baranov & Malama (1993) model is described by Malama (1991), while the Heerikhuisen et al. (2006) model uses a similar method based on splitting during charge exchange. The main disadvantage of fluid models is that each neutral component is forced into local thermal equilibrium, which, at the very least, constitutes a loss of information (Maxwellians instead of a more general distribution). Two studies have recently engaged in detailed comparisons of kinetic models versus multi-fluid gasdynamic models of neutral hydrogen in the heliosphere, and put forward some of the possible physical reasons for the differ-
H.-R. M¨ uller et al.: Comparing multi-component global heliosphere models
ences that invariably occur (Alexashov & Izmodenov 2005; Heerikhuisen et al. 2006). For their study comparing global heliospheric models, Alexashov & Izmodenov (2005, hereinafter AI05) set out using the Moscow kinetic code developed over the years in Moscow starting from the original Baranov et al. (1991) kinetic-gasdynamic model. A certain set of solar wind and interstellar boundary parameters is used throughout their study. AI05 compare the kinetic result, and non-self consistent variants of it, to multi-fluid models in which neutral H is modeled by one to four fluids, coupled self-consistently to the same gas-dynamic plasma code used also for the kinetic model. They find that kinetic and multi-fluid models never agree completely. The agreement with the kinetic method is best for the four-fluid model, and worst for the one-fluid model. The boundary locations are further out in the four-fluid case when compared to the kinetic model, namely, the upwind bow shock (BS) by 4%, the termination shock (TS) by 5%, and the heliopause (HP) by 9%. The hydrogen wall material is more decelerated and consequently the peak density is larger, and the filtration more severe (less H entering through the termination shock). This discrepancy is started by the kinetic model having a weaker (plasma) bow shock than the four-fluid model, which in turn is likely caused by more secondary neutrals passing to the interstellar side of the bow shock than in the fluid case, as displayed by AI05. In a similar investigation, Heerikhuisen et al. (2006, hereinafter HFZ06) use their own kinetic code and compare the result with their own version of a four-fluid model. They, too, find a weaker bow shock in the kinetic case compared with the fluid case, and the same chain of consequences, including a larger H density in the hydrogen wall and a smaller density passing through the termination shock for the fluid case. While TS and HP are farther out for the fluid case, the BS is less far than in their kinetic model. At four representative locations in the heliosphere, HFZ06 compare the parallel velocity distribution function between kinetic and multi-fluid models, the latter being a superposition of 4 individual Maxwellians. At least for those 4 points on the stagnation axis, they find that the two interstellar neutral components coincide very well with the Maxwellians from a four-fluid model, and only the two heliospheric neutral components deviate. AI05 and HFZ06 agree that the NSW component is much hotter (i.e., broader velocity distributions) in the kinetic model than in the fluid model. The ENA-“fluid” is the most problematic to be fit by a Maxwellian, at least outside the inner heliosheath and the heliotail. HFZ06 also compare their results to those obtained by AI05 with their codes. This comparison is possible because HFZ06 use the same boundary parameters. The two fourfluid codes correspond very well to each other, minus a subtle difference that comes about by the different internal treatment of the bow shock in the two plasma codes. The two kinetic code results also differ in hydrogen density between bow shock and heliopause, which again might have to do with the internal treatment of the bow shock in the underlying plasma codes. In this paper, we take one step further back and compare the results of sophisticated, comparable global heliosphere models (albeit all axisymmetric and non-MHD), run on the same boundary data set characterizing the solar wind at 1 AU and the pristine interstellar medium. Since the modeling strategies even for the plasma gas-dynamic
3
model are different across the four groups considered (they are compared in section 2), the differences between the models are going to be larger than for the case of the internal comparisons of AI05 and HFZ06. In this sense, the paper focuses not on discovering additional physical reasons for differences between the kinetic and the multi-fluid approach. Rather, we are trying to state quantitatively how far apart or close some key results are, in order to give the wider community a sense how accurate statements derived from current neutral/plasma models likely are. The models used within the observational contributions of this special issue all are related to the global models outlined below, and all make use of specific additions or modifications depending on the specific issues addressed. The Richardson and Wang one-dimensional MHD model (Richardson et al. 2008) concentrates on the solar wind interstellar flow interaction to describe the slowdown in the supersonic solar wind. It does not include many of the intricacies of the global models beyond the termination shock as discussed below, but incorporates the detailed solar wind temporal structure to come to a meaningful comparison between inner and outer heliosphere. Bzowski et al. (2008) take the interstellar flow from a kinetic model similar to the one in AI05, and then add a Monte Carlo calculation of the history of individual particle trajectories in the inner heliosphere to get the pickup ion characteristics between 1 and 5 AU. For Pryor et al. (2008) it is important to add the radiation transport of solar Ly-α, including multiple scattering on a global heliospheric model. In this sense, the global models discussed below may serve as proxies for the modeling used for the entire special section. The remainder of the paper is organized as follows. In section 2, we compare results from single fluid, plasma-only models, and in section 3, from five neutral/plasma global heliospheric models for one particular parameter set. In section 4, we attempt to qualify our results and put them into perspective of the overall goal of realistic models of the global heliosphere.
2. Comparison of plasma-only models The five self-consistent global heliospheric models that are compared in this paper are the Baranov & Malama (1993) Moscow model (“BM”), the IGPP-UCR kinetic model by Heerikhuisen et al. (2006) (“Hee”) and the multi-fluid model by Florinski et al. (2005) (“Flo”) extended from the Florinski et al. (2003) two-fluid model, the Pauls et al. (1995) style multi-fluid model modified by M¨ uller et al. (2006) (“Mue”), and the Bonn five-fluid model (Fahr et al. 2000) as used by Scherer & Fahr (2003) (“Sch”). All these models use a gas-dynamic description of the plasma, and therefore we start with a comparison of the plasma-only part, i.e. the Euler equation solvers used by these groups for their plasma part under the assumption that there are no source terms on the right-hand-sides of the fluid equations (no neutrals in the system). All groups ran their plasma code with the solar wind and interstellar boundary conditions listed in Table 1. It was assumed that the plasma consists of equal (comoving) densities of protons and electrons, in other words, the thermal plasma pressure equals twice the thermal proton pressure. The magnetic field, as well as the solar gravity, were neglected. As can be expected, the results from the four groups are very close to each other (the plasma parts of the Hee and
4
H.-R. M¨ uller et al.: Comparing multi-component global heliosphere models 10 0
10 -2 10
0.15 -3
-1
BM Flo Mue Sch BM Flo Mue Sch BM Flo Mue Sch
n [cm ]
-3
n [cm ]
10
0.2 n000 n000 n000 n000 n090 n090 n090 n090 n180 n180 n180 n180
-3
0.1
0.05
n000 n000 n000 n000
BM Flo Mue Sch
10 -4 100
300 r [AU]
500
700
900
0 300
325
350
r [AU]
375
400
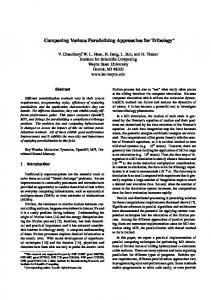
Fig. 1. (a) Number density profiles for the plasma-only models of all four groups, in the directions upwind (0), crosswind (90), and downwind (180) with respect to the LIC flow, respectively. (b) Detail around upwind BS. Table 1. Boundary parameters, plasma-only models. Variable
1AU LIC [units]
proton density velocity temperature
7 0.06 [cm−3 ] 375 26.4 [km s−1 ] 73,640 6530 [K]
Table 2. Key results from plasma-only models. Result upwind TS [AU] upwind HP [AU] upwind BS [AU] downwind TS
BM F lo M ue Sch 149 196 340 385
148 199 340 319
153 204 365 396
mean
152 150.5 ± 2.4 212 202.8 ± 7.0 380 356 ± 18 304 351 ± 46
the Flo models are identical, and not listed separately). Figure 1 shows this with the number density profiles of all four models, in three representative directions in the commonly used heliocentric reference frame. In all three directions, all the densities follow a r−2 power law in the supersonic solar wind before encountering the termination shock. The upwind termination shock (TS) distances are very close to each other, whereas downwind there is more variability. The shock strengths (ratio of downstream to upstream density) are more or less the same. Also the density contrast across the heliopause (HP) is similar across the four models. Also obvious is that the BM model uses capturing methods to identify and enforce discontinuities, whereas the other three models do not employ such techniques, and transitions are spread over a few grid points (see the bow shock of the Mue model for an example, Fig. 1b). Table 2 lists some key results for the shock and heliopause locations. The similarities in the results are evident. The last column comprises a simple average across the four models for each result, and the standard deviation hints at the range that the results span. The different models basically agree on the upwind TS and HP locations, and are a little bit more spread for the BS, and yet more for the downwind TS results. Besides the treatment of shocks and discontinuities, there are obviously many other reasons why the four models vary from each other. Each of the four models makes different choices related to the grid configuration, resolu-
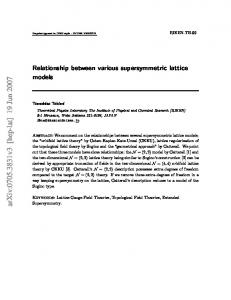
tion, and the extent of the simulation domain. Also, there are four different choices of the numerical transport and diffusion schemes to solve the Euler equations. BM use a Godunov-type numerical scheme with moving adaptive grid while capturing three discontinuities — the heliopause as contact discontinuity, and the termination and bow shocks. The accuracy of the numerical scheme resolution is improved by using a “minmod” limiter. The plasma part of the numerical algorithm of the Flo multi-fluid model uses the total variation diminishing (TVD) finite volume scheme based on the Courant-Isaacson-Rees approximate Riemann solver. Conservation laws for the neutral components (section 3) are solved using the more diffusive TVD Lax-Friedrichs method. The Hee plasma part is identical to that of Flo. The ZEUS-3D algorithm underlying the Mue model is based on the method of finite differences on a staggered mesh, incorporating a van Leer monotonic advection scheme, and von Neumann-Richtmyer artificial viscosity at shock fronts. For all fluids in the Sch model the Euler equations are formulated for quantities conserving the flux of mass, momentum, and energy, and are subjected to second order Riemann solvers using the Lax-Friedrichs method with an entropy fix. For large pressure gradients a Harten-Lax-van Leer solver is implemented. The high-Mach number regime of the supersonic solar wind is an instructive example of the modeling technique differences, and their consequence for heliospheric studies. While each technique is optimized to conserve crucial quantities (for example, mass flux from grid cell to grid cell), the calculations of density, velocity and pressure deviate from model to model. Small flux errors are evident in Figure 2 showing the conserved total particle flux nvr2 , where the ideal value (2.625×10⁸ AU2 cm−2 s−1 ) is approximated well by the BM model. The Flo model also conserves this quantity, albeit a smaller value was introduced at the boundary. Immediately upstream of the TS, the modeled densities range from 6.75 to 7.35 cm−3 /r2 , and the velocities (ideally 375 km s−1 ) range from 376 to 383 km s−1 . As the location of the TS is determined by the ram pressure at the TS balancing the ISM pressure, the subtle variations in ram pressure are a natural explanation of the TS differences in Table 2. Similar effects explain the other discrepancies. The BS distances basically follow the trend of the HP distances, as the BS shock compression ratios are quite similar between all four models (2.2–2.3; cf. Fig. 1b). We note in passing that the stagnation axis from which data for Table 2 and Figures 1 (except for 90o ) and 2 are taken, is numerically somewhat problematic in that for the axisymmetric
H.-R. M¨ uller et al.: Comparing multi-component global heliosphere models
5
-1
s ]
Table 3. Boundary parameters, full models. 2.8x10 +08
2.6x10
proton density H density velocity temperature
+08
2
2
n v r [AU cm
-2
Variable
n000 n000 n000 n000
2.4x10 +08 10 1
r [AU]
BM Flo Mue Sch
1AU LIC [units] 7 − 375 73,640
0.06 0.18 26.4 6530
[cm−3 ] [cm−3 ] [km s−1 ] [K]
10 2
Fig. 2. Upwind profiles of flux conservation n v r2 in the supersonic solar wind. models at hand, it actually consists of boundary grid zones and not of interior zones. One specific difficulty faced by every model of the heliosphere is the treatment of outflow boundary conditions in the heliotail. Because the tail plasma flow is subsonic, the boundary is influenced by waves and disturbances entering from downstream, i.e., from the regions not included in the simulation. Simple outflow boundary conditions are used by the Mue and Sch models, in effect copying interior solutions to boundary shadow zones and thus making derivatives at the boundary small. This approach could lead to waves reflected off the boundary and reentering the simulation, an unphysical situation. A somewhat more complicated approach, employed by the Flo model, is to apply a “non-reflective” outflow boundary condition, whereby the flow is reaccelerated to a sonic point through an insertion of a rarefaction fan at the boundary of the domain. In the BM model the tail computation region is extended up to the region where the solar wind is supersonic again. While the other models agreed to an outer boundary at 1000 AU, the BM model extends the simulation domain to 6000 AU tailward for this reason (Izmodenov & Alexashov 2003; Aleksashov et al. 2004), at the expense of resolution and computation time. Regardless of their degree of sophistication, it should be realized that all tail boundary conditions used by heliospheric models are not physically exact in the strict sense, except for the BM model where the outer tail flow is supersonic and, therefore, the boundary conditions are correct. The boundary handling contributes to noticeable differences in the distances of the TS in the downwind direction predicted by different models (see Table 2), yet it is not the only issue involved, as there is a curious pairing of BM and Mue model distances on the the one hand, and Flo and Sch models on the other hand.
3. Comparison of self-consistent plasma/neutral models 3.1. Model results We now proceed to introduce neutral interstellar hydrogen (H) into the system and, using the plasma codes of section 2, switch on the full, self-consistent plasma/neutral codes in which the plasma and neutral H influence each other through appropriate source terms. All groups calculate their global heliosphere with the solar wind and interstellar boundary conditions listed in Table 3. Again, the magnetic fields are neglected, as are gravity and radiation pressure. The H-p charge exchange cross section depends
on the relative velocity; for this paper all five models use the Maher & Tinsley (1977) cross section. A photoionization rate of 10−8 s−1 (1 AU / r)2 is assumed, and other ionization channels such as electron impact ionization are neglected throughout. Figure 3 gives a good overview of the results for the two available plasma - kinetic neutral models BM and Hee, and the three multi-fluid models Flo, Mue, and Sch. The left panel shows the plasma density profiles for upwind (solid), crosswind (dotted), and downwind (dashed) directions, and the right panel displays the information for total neutral density in the same format. The plasma results exhibit a level of similarity to each other that is comparable or slightly better than the level of similarity of the plasma results in the previous section (Fig. 1). In particular, the upwind HP location nearly coincides in all five models. The first four entries of Table 4 contain the key locations of the heliosphere for the full models. Again, the standard deviations in the last column express the range of the results against a simple arithmetic mean of the values in each row. It can be seen that also the upwind TS locations agree to within 7%, and only BS and downwind TS disagree (up to 14% each). While this type of disagreement was also found in the plasma-only cases of section 2, it tends to now be larger, especially for the bow shock. We note in passing the dramatic effect on the heliosphere boundary locations that the inclusion of neutrals has. The results of Table 2 are significantly larger than those of Table 4 even though the boundary parameters of the plasma-only case are identical to those of the plasma/neutral case. In the neutral H density (Fig. 3, right) all models exhibit an overdensity (hydrogen wall) downstream of the bow shock, and a subsequent rapid drop in the density approaching the heliopause and further inside. For this and similar diagnostics, the neutral multi-fluid results are summed (averaged) into a single total neutral P hydrogen quantity, in the simplest manner as ntot = i ni for total density, P −1 P vtot = n−1 tot · i ni Ti for i ni vi for velocity, and T = ntot · temperature. The two fluid models with less than four neutral fluids (Mue, Sch) almost agree in the sharpness and the peak height of the hydrogen wall. As in previous findings (Baranov et al. (1998); Figure 2 by McNutt (2004); AI05; HFZ06), the hydrogen wall is quite a bit higher for these two fluid models compared to the kinetic models BM and Hee. The two latter models match each other well in neutral hydrogen. The hydrogen wall of five-fluid model Flo is higher than the kinetic ones, but closer to those than to the other multi-fluid models. The peak densities in the hydrogen wall are listed in Table 4. The hydrogen wall profiles fit the general trend displayed in Figure 3 of AI05: There, the onefluid model (most similar to the Sch model) resulted in the highest-peaked hydrogen wall, the three-fluid model (most
6
H.-R. M¨ uller et al.: Comparing multi-component global heliosphere models
0.5
10 -1 -3
n [cm ]
0.4
-3
n [cm ]
10
0.3
-2
0.2
10
-3
n000 n000 n000 n000 n000 n090 n090 n090 n090 n090 n180 n180 n180 n180 n180
BM Hee Flo Mue Sch BM Hee Flo Mue Sch BM Hee Flo Mue Sch
0.1
100
r [AU]
300
0 0 10
500 700 900
10
1
r [AU]
10
2
10
3
Fig. 3. Density profiles of plasma (left), and of neutral H (right), for three directions, for the five self-consistent plasma/neutral models. Table 4. Key results from plasma/neutral models. Result
BM
Hee
F lo M ue
Sch
upwind TS [AU] 87 85 90 94 96 upwind HP [AU] 130 126 132 130 138 upwind BS [AU] 245 274 260 236 209 downwind TS 177 166 190 214 192 BS compression ratio 1.2 1.2 1.4 1.7 2.3 peak nH [cm−3 ] 0.27 0.27 0.30 0.43 0.46 nH at TS [cm−3 ] 0.134 0.125 0.109 0.094 0.126 filtration f 0.74 0.69 0.61 0.52 0.70 vH at TS [km s−1 ] 20.7 20.8 23.4 21.3 19.2 TH at TS [K] 26800 30900 15500 21000 12000
similar to the Mue model) exhibited a somewhat smaller hydrogen wall with a very sharp rise on the interstellar side, and the BM model had a small peak, with a smooth H density rise and fall, that was relatively closely matched by a four-fluid model (most similar to the Flo model). Note that the neutral H column density through the upwind direction is basically constant; the displayed different hydrogen walls are either tall and narrow, or smaller and broad. The largest contributor to the differences between the simulated hydrogen walls is the distribution of plasma velocities, notably the component parallel to the ISM flow. Figure 4 shows an overview of the radial velocity component as a function of heliocentric distance in the left panel, and the right panel zooms in around the bow shock distance. The two kinetic models display a plasma deceleration upstream of the bow shock due to charge exchange with component 3 and 4 neutrals that are streaming antisunward and have passed the bow shock. To a lesser extent, the Flo and Mue models exhibit a similar deceleration, whereas the Sch model cannot resolve such counterstreaming fluid elements (they deposit their energy already far downstream of the BS). As a consequence of the deceleration both upstream and downstream of the BS, the BS is the weakest in the
mean 90.4 ± 4.6 131.2 ± 4.4 245 ± 25 188 ± 18 1.6 ± 0.5 0.346 ± 0.092 0.118 ± 0.016 0.65 ± 0.08 21.1 ± 1.5 21200 ± 7800
kinetic cases, followed in shock strength by the Flo model, and is the strongest in the one-fluid case, with the Mue model in between (Table 4). The shock-capturing method of BM arrives at a very weak BS. This range of bow shock strengths explains the more gradual hydrogen wall in the kinetic cases. The hydrogen wall is of lesser amplitude in the kinetic cases because the velocities downstream of the BS are distinctly larger (absolute magnitude) than those in the fluid cases, and therefore charge-exchanged neutrals are not decelerated as much as in the one-fluid case where the plasma velocity is the smallest. To appreciate this difference, one has to mentally shift the plots of Fig. 4 (right) so that the individual bow shocks line up. As expected, a stronger bow shock results in a more decelerated plasma, and therefore a larger peak density of the hydrogen wall. Typically, this also means a lesser distance of the BS to the Sun, and this trend is evident in Table 4. The exception is model BM that experiences additional deceleration downstream of the BS, such that the BS standoff distance is not as far outward as the shock strength would suggest. The different hydrogen walls result in different neutral densities downwind of the TS, where the neutrals enter region 4 of the supersonic solar wind. The filtration ratio
H.-R. M¨ uller et al.: Comparing multi-component global heliosphere models
7
20
400 350
10
300
200 150 -1
vr [ km s ]
100 50 0
BM Hee Flo Mue Sch BM Hee Flo Mue Sch BM Flo Hee Mue Sch
-1
vr [ km s ]
250
v000 v000 v000 v000 v000 v090 v090 v090 v090 v090 v180 v180 v180 v180 v180
0
v000 v000 v000 v000 v000 v090 v090 v090 v090 v090
-10
-20
BM Hee Flo Mue Sch BM Hee Flo Mue Sch
-50 -100 0 10
10
1
r [AU]
10
2
10
3
-30 100
200
300
r [AU]
400
500
600
Fig. 4. Plasma radial velocity profiles of all models for three directions (left), and a magnification around the upwind bow shock (right). nH (T S)/nH (∞) is listed in Table 4, along with the two absolute densities discussed above. In principle, it can be expected that the slower the outer heliosphere plasma is (i.e. the higher the hydrogen wall), the more neutrals get deflected around region 4 and hence the stronger the filtration is. However, for the slowest case, the one-fluid Sch model, the small width of the inner heliosheath compensates for this effect and creates TS neutral densities similar to the kinetic BM model. Richardson et al. (2008) investigate the slowdown of the supersonic solar wind due to the pickup process derived from neutrals. They calculate a 15% solar wind slowdown between 5 AU and 78 AU from a 2006 conjunction of the Ulysses and Voyager 2 spacecraft. The five models described here indicate less of a slowdown in this distance range, namely, between 7% (Mue, Sch) and 10% (all others). While the differences in the neutral density at the termination shock (and consequently, the differences in the filtration ratio) are in the 20% range, the predicted neutral velocity at the termination shock varies much less among the five models. Table 4 contains the corresponding results, as well as those referring to the (total) neutral temperature at the termination shock. The velocities are within 6% of each other; in other words, all five models predict a slowdown of the neutrals by (5.3 ± 1.5) km s−1 because of their passage from the LIC to region 4. The picture is much less clear for the neutral temperature, where large variations exist between the two-fluid model (smallest T ) on the one side, and the kinetic models (largest kinetic T ) on the other side, with the Mue model in between. 3.2. Discussion As is evident from the results above, the two kinetic models yield very similar results, while the discrepancies between the kinetic models and the one-fluid model are the largest, which was also found by AI05. These two modeling alternatives bracket the range within which the rest of the models fall. The kinetic codes have no provision for di-
rect neutral–neutral interaction, and hence have no direct, built-in mechanism that would drive the neutral distributions toward Maxwellian equilibrium. On the other hand, the Euler equations of gas dynamics are derived under the assumption of frequent particle collisions (even though they seem to be valid beyond that range) to yield thermodynamic equilibrium, and hence the single-fluid description of neutral H is related to envisioning frequent neutral collisions. The multi-fluid codes are interesting in that they disallow neutral–neutral interactions between neutrals that are created in different thermodynamic regimes (which usually means that they are distinctly separated in velocity space), while still envisioning neutral collisions within those regimes themselves. As neutral H is being modeled with more and more fluids, fewer and fewer neutral collisions are assumed, which results in a convergence toward the kinetic results, seen in the results above and those by AI05 and HFZ06. The absence of neutral–neutral interactions, in particular in the kinetic models, does however not necessarily mean that the distributions are completely nonMaxwellian. Charge exchange with plasma protons injects neutrals drawn from a Maxwellian distribution, hence the secondary neutrals have a tendency to organize in distributions similar to Maxwellians. In this sense, charge exchange constitutes an indirect (and inefficient) channel for neutral equilibration. The charge exchange mean free path (mfp) is nowhere very small in the heliosphere, but is sometimes small enough for charge exchange to occur frequently, driving neutrals toward equilibrium. Indeed, some example mfps derived from the Mue model are quite short. In the region upstream of the bow shock, the interstellar neutral mfp is ∼ 200 AU, and the mfp of neutrals having been generated in regions 3 and 4 (the regions occupied by solar wind) and having streamed to upstream of the bow shock is even smaller, ∼ 100 AU. For the outer heliosheath (between BS and HP), mfps are below 100 AU, and go down even to 20 AU close to the nose of the heliopause (on the interstellar side) where plasma velocities become small. Therefore,
8
H.-R. M¨ uller et al.: Comparing multi-component global heliosphere models
the Knudsen number in these regions is small, down to ∼ 0.2. In these instances, and even when Knudsen numbers are larger, forcing the neutrals into multi-component fluids with Maxwellian distributions in general does not change their distribution much. This interpretation is backed up by the findings by HFZ06 who decompose the neutral distribution function into the contributions from the four components. They find that the interstellar component (component 1) and the outer sheath component 2 do behave like Maxwellians even when treated fully kinetically (cf. their figure 5). In this context, AI05 argue that one of the more fundamental differences between kinetic and fluid treatments of neutral H is related to the fact that for the interstellar temperature of 6530 K, the thermal velocity of H is already about half of the bulk velocity value of 26 km/s. This means that individual ISM particle trajectories have sizeable perpendicular velocity components that are represented in the kinetically modeled trajectories. In contrast, the fluid description of the same region has a strictly parallel bulk velocity, and effects of the perpendicular particle motion are handled by a non-zero neutral pressure. For secondary neutrals produced in the solar wind (regions 3 and 4), the fluid picture is capturing some aspects of the particle behavior less well. Component 3 might be reasonably approximated as a hot Maxwellian in region 3, but component 3 streaming out of this region will have a complicated distribution function. For points outside the HP, the distribution function will be resembling a halfMaxwellian, with velocity components toward the HP missing (half-Maxwellian in region 1, HFZ06). For region 4, where component 3 neutrals constitute the energetic neutral atom (ENA) hydrogen background, the distribution is complex (each location is reached in principle by ENA from all heliosheath and heliotail positions), and certainly non-Maxwellian. The fluid approach consequently has component 3 very hot and with a small velocity in region 4. Similar findings apply to component 4 neutrals, which are cold and fast in principle. As they stream to distant locations in region 1, the kinetic codes allow their distribution function to broaden unhindered by interactions and thereby gaining a large kinetic temperature, whereas the fluid component 4 experiences the adiabatic cooling of the radial expansion, and ends up with much smaller temperatures. The differences in component 3 and 4 neutrals present in region 1 between the kinetic and the fluid picture set the stage for the different bow shock strengths mentioned above and hence influence the BS location and the hydrogen wall. In the solar wind region, the absolute energy transfer to the plasma due to charge exchange by component 3 and 4 neutrals seems insensitive to the subtle differences in the distribution function there, and hence TS and HP locations are basically unaffected.
4. Sources of Error Using a multi-fluid approach instead of a particle kinetic method incurs a systematic error in the neutral distributions, and therefore also in the plasma distributions. This has been discussed in the previous section and in the literature (e.g., AI05 and HFZ06). In this section we want to discuss the source of other systematic errors that contribute as well to differences between any modeled global heliosphere and the real system as observed through heliospheric measurements.
4.1. Numerics As illustrated in section 2, simple choices for the fundamental algorithm for following the non-MHD fluid equations, combined with choices for grid resolution and organization (e.g., spherical vs. Cartesian, or fixed resolution vs. location-dependent) and choices relating to the extent of the computation domain determine the outcome of even the simplest, plasma-only heliospheric simulation. Different choices will conserve different quantities better, usually at the expense of other quantities (see the conservation of nvr2 in Fig. 2). Another common issue of fluid simulations is the handling of discontinuities such as termination shock, bow shock, and heliopause. The solutions used by the models in section 2 range from smearing out discontinuities over three grid cells to shock capturing methods that supply the discontinuous solution externally, and not from the fluid algorithm used everywhere else. The treatment of discontinuities is hence quite sensitive to the local grid resolution at the heliospheric boundaries. As is usually the case, both multi-fluid simulations as well as billion-particle simulations involve a myriad of individual steps, with the potential that even numerical accuracy comes into play as a potential source of error. This is presumably less important, however, as the simulations eventually settle into a converged, time-independent state for which roundoff errors should cancel. 4.2. Cross sections The results of global heliosphere modeling are sensitive to the cross sections that are chosen for the resonant charge exchange between protons and neutral hydrogen. Often, studies of this charge exchange cross section have been motivated by investigations of the terrestrial ionosphere interacting with the terrestrial neutral exosphere, and hence are not meant for higher energies > 1 keV, which is a source of error for charge exchange involving component 3 and 4 neutrals. Izmodenov et al. (2000) and Fahr et al. (2007) have reviewed issues relating to the relevant cross sections. Typically heliospheric modelers have adhered to the energydependent cross sections by Maher & Tinsley (1977) and Fite et al. (1962). Both are fitting formulae of the form (a − b log v)2 , where v is the relative velocity between the interaction partners. A recent compilation by Lindsey & Stebbings (2005) arrives at a yet different cross section approximation. The cross sections are still uncertain to approximately 10% (solar wind speeds) and up to 40% (slow speeds; see, e.g., Bzowski et al. (2008)), not only because of the fitting itself and the extrapolation of these fits beyond their intended velocity range, but also the underlying experimental data from different groups do not always reconcile easily. Heliospheric modeling is very sensitive to the actual cross section values. In order to not repeat work reported elsewhere, we would like to draw attention to figure 4 by HFZ06 and figure 8 by Baranov et al. (1998). Each of these two figures compares two (respective) heliospheric models that differ only by the choice of the cross section, i.e. either using the values by Maher & Tinsley (1977) or those by Fite et al. (1962). For both papers, the results indicate that the shift in heliospheric boundary locations like TS
H.-R. M¨ uller et al.: Comparing multi-component global heliosphere models
and HP is minor, about 1–3%, but that the consequences for the hydrogen wall and for the neutral filtration factor are quite a bit larger: The hydrogen wall is ∼ 14% larger in the Fite et al. (1962) case, and correspondingly, there is more filtration going on for that case (smaller f number, as used in Table 4). The reason is that the Fite et al. (1962) cross section is larger than the Maher & Tinsley (1977) cross section at key energies. In this sense, the uncertainty in the cross section and issues related to it are one of the larger error sources influencing global modeling and its comparison to direct measurements. Note that many data products derived from direct measurements use a charge exchange cross section as well, as part of the ionization channels acting on neutrals. Therefore, the discussion of this systematic error applies to these derived data products as well. For examples see Bzowski et al. (2008) and Richardson et al. (2008) in this issue, where the uncertainty about the charge exchange cross sections is echoed in the interpretation of the pickup ion results, or the solar wind slowdown results, respectively, in terms of the interstellar H density. 4.3. Additional physics Finally, there are systematic errors influencing global heliospheric modeling whose magnitude is difficult to assess or sometimes not yet explored. Neglecting interplanetary and interstellar magnetic fields, for example, excludes a whole suite of possible heliospheric asymmetries, shifts in the heliospheric boundaries, and influences on the neutral hydrogen distribution even in the inner heliosphere. The presence of magnetic fields also typically allows for temperature anisotropies and turbulence in the plasma, and there is evidence that the solar wind (plasma) velocity distribution is non-Maxwellian already at a 1 AU distance, which most global models do not yet address. Further away from the Sun, the proton distribution functions are driven away from equilibrium by the effects of charge exchange, which calls for a fully kinetic plasma – neutral gas numerical modeling strategy eventually. The 3D, time-dependent solar wind in real-time differs from what most models currently feed into their simulations. Similarly, the solar irradiance depends non-trivially on time and on position in the heliosphere. Additional simplifying assumptions often made include the restriction of the particle species to electrons, protons, and neutral hydrogen, and omitting heavier ion species (including alpha particles) in the solar wind, and heavier particles in the interstellar medium. The influence of high-energy particles such as cosmic rays (anomalous and galactic) should be taken into account, however their effect on the heliospheric structure is most likely not significant. The pickup process, i.e., the dynamical process of accelerating a newly born ion into the plasma bulk flow, also is often not handled in sufficient detail in global models. Many times, global modeling assumes instantaneous pickup for simplicity. It would be more realistic to fairly treat the pickup ion evolution, accounting for plasma-wave or turbulent interaction, and in general accounting for the nonMaxwellian character of the pickup ion distribution. A first level of refinement is taken in the Sch model (Fahr et al. 2000) as used in this paper (section 3), where pickup ions are not absorbed instantaneously into the main plasma, but
9
followed as a separate plasma fluid which interacts with the main solar wind protons. This list is not comprehensive, but is meant as a sample of the type of issues that are outstanding for the business of global heliospheric modeling, nonwithstanding past and present progress on multiple fronts (numerous citations are omitted here for the sake of brevity). Further progress, as well as extensions and refinements of additional lines of model physics, will improve the realism of all the models over time.
5. Conclusions We investigate in this paper global heliospheric plasma/neutral models from five groups, first the plasma parts by themselves, then the fully self-consistent models. For the latter, the neutral species are modeled with either one, three, or four fluids, or on a particle-kinetic level. Performing model runs with exactly the same boundary parameters and physics included, we arrive at the following conclusions. 1. Although very different numerical strategies and approximations have been chosen for the five heliosphere models presented in this paper, the results all qualitatively agree. In many respects, even the models’ quantitative predictions are similar. They agree in particular about the location of the upwind termination shock and the upwind heliopause. The discrepancies for termination shock and heliopause in the five investigated models range from a few percent in the nose direction (