Samples were diluted in dust-free saline electrolite. (Isoton II). Results were corrected automatically in the Channelyzer for coincidence and nonaxial flow losses.
APPLIED AND ENVIRONMENTAL MICROBIOLOGY, May 1983, P. 0099-2240/83/051651-08$02.00/0 Copyright C 1983, American Society for Microbiology
1651-1658
Vol. 45, No. 5
Comparison Between Direct Methods for Determination of Microbial Cell Volume: Electron Microscopy and Electronic Particle Sizing E. MONTESINOS,* I. ESTEVE, AND R. GUERRERO Department of Microbiology and Institute for Fundamental Biology, Autonomous University of Barcelona, Bellaterra (Barcelona), Spain
Received 2 November 1982/Accepted 3 March 1983
Size frequency distributions of different phototrophic and heterotrophic microorganisms were determined by means of scanning and transmission electron microscopy and electronic particle sizing. Statistically significant differences existed among the three techniques used in this study. Cells processed for electron microscopy showed lower mean cellular volumes than those processed for electronic particle sizing, reflecting a shrinkage by factors ranging from 1.1 to 6.2 (mean, 2.3). Processing of cells for scanning electron microscopy caused higher shrinkage than processing for transmission electron microscopy. Shrinkage was dependent neither on the size nor on the cell wall type of the microorganism. When processed for scanning electron microscopy, phototrophic bacteria were strongly shrunken, whereas heterotrophic microorganisms were less affected. A direct relationship existed among phototrophic bacteria between percentage of shrinkage and specific pigment content. This was probably a consequence of the pigment extraction by organic solvents during the dehydration process, previous to the critical point drying, necessary to examine the specimens under the scanning electron microscope. To understand the role of planktonic bacteria in natural ecosystems, an estimate of their biomass is offundamental importance. Biochemical methods have been proposed to assess biomass (13, 23), but these indirect techniques have many interferences and require standardization, and results are difficult to interpret when mixed populations of algae and other eucaryotic microorganisms coexist with bacteria. Planktonic bacterial biomass has been calculated from direct microscopic examination of total numbers and average cell volume. The latter has been mainly measured by means of microscopic methods, including phase contrast (16, 18), epifluorescence (9, 10), and transmission (23) and scanning electron microscopy (TEM and SEM, respectively) (4, 10, 15, 25). Although microscopy is time-consuming, much information can be obtained because it permits an assessment of the relative proportion of different microorganisms on the basis of their size and morphology. This advantage is of especial relevance when studying natural communities of phototrophic bacteria, which are frequently composed of coexisting purple and green sulfur bacteria, nonphototrophic microorganisms, and algae and zooplankton (3, 11), which can be separately quantified by means of the microscope.
SEM is one of the most widely used methods for determination of bacterial biomass because of its high resolution and has been recently adapted to digitizer-microcomputer systems (14), thus reducing the time consumed in the analysis. But SEM may seriously underestimate cell size and, as a consequence, biomass, because the drying steps during specimen preparation can cause significant shrinkage in both eucaryotic tissues (5, 12) and bacterial cells (10, 21). There is considerable disagreement about this point among microscopists, and there is a need for more definitive work to clarify it. The objective of the present study was to compare the apparent size frequency distributions of different microorganisms in pure cultures and field samples by using SEM, TEM, and electronic particle sizing with the Coulter counter (CC). We were mainly interested in the physiological ecology of phototrophic bacteria. Therefore, the study includes phototrophic bacteria as an important part. MATERIAS AND METHODS Microorganisms and growth conditions. Phototrophic bacteria were cultivated in Pfennig medium (2) supplemented with sodium acetate (0.1%). Chromatium minus, Chromatium vinosum, Thiocapsa roseopersicina, and Rhodopseudomonas capsulata were isolated from field samples of Lakes Ciso and Vilar 1651
1652
MONTESINOS, ESTEVE, AND GUERRERO
(Banyoles, Girona, Spain). Chlorobium vibrioforme forma sp. thiosulfatophilum 8327 was used as the reference strain of the Chlorobiaceae. Cultures were incubated at 25°C in Refritherm chambers (Struers, Sweden) fitted with continuous fluorescent illumination at 30 ,uEinsteins m-2 s-1. The heterotrophic microorganisms Salmonella typhimurium, Pseudomonas aeruginosa, Bacillus stearothermophilus, Staphylococcus aureus, Saccharomyces cerevisiae, and Candida albicans were grown in LB medium (yeast extract [Oxoid Ltd., London, England], 5 g; tryptone [Oxoid Ltd.], 10 g; NaCl, 10 g) under aerobic conditions at 37°C. Branhamella catarrhalis was grown in heart infusion broth (Difco Laboratories, Detroit, Mich.) under microaerophilic conditions at 37°C. Sample preparation and fixation. Cells from lateexponential cultures and field samples were harvested by centrifugation at 8,000 x g for 10 min. For preservation of the structure, ceUls were fixed by the double fixation method with glutaraldehyde (3%) and postfixation with osmium tetroxide (1%) for 2 h, washed three times in distilled water, and stored at 4°C (12). TEM. Ten-microliter samples were placed over a 0.25% Formvar-carbon-coated copper grid (300 mesh) and dried overnight in a drying chamber. We used negative stain with phosphotungstic acid (1% [wt/vol], pH 7.2) and observed the samples with a Hitachi HU12A transmission electron microscope operating at 80 kV. Size measurements were done directly on the prints at a final enlargement of x5,000 to x10,000. At least 100 cells from each sample were measured. SEM. Fixed samples were filtered through Nuclepore filters (0.2-,urm pore diameter), dehydrated for 10 mm in increasing concentrations of ethanol in water (30, 50, 70, 90, and 100%), and transferred to increasing proportions of amylacetate in ethanol (30, 50, 75, and 100%). Dehydrated samples were dried by the critical point drying (CPD) method, using liquid carbon dioxide in a pressure chamber (Polaron, Watford, England), mounted on metal stubs with silver paint, and coated with 50 nm of gold in a PE-5000 sputter coater (International Scientific Instruments, London). Finally, specimens were observed in a Super-IIIA scanning electron microscope (International Scientific Instruments) at 0° detector angle. Randomly selected fields were photographed, and well-contrasted negative films were mounted and projected by means of a slide projector at a final enlargement of x 30,000 to x 50,000. This method gave an accuracy of better than 0.02 ,um. At least 100 cells were sized and, depending on the microorganism, categorized into spheres (volume = 'rr/6L3) and rods (cylinders with hemispherical caps, volume = 'n[W/2]2[L - W/3]). Volume and distribution data were analyzed with a Sharp PC-1211 pocket computer. Electronic sizing. A CC (model ZBI), connected to an impulse Channelyzer 1000, was used for counting and sizing bacterial cells. A 30-Erm aperture tube was used to quantify cells between 0.05 and 100 ,um3. Samples were diluted in dust-free saline electrolite (Isoton II). Results were corrected automatically in the Channelyzer for coincidence and nonaxial flow losses. Counts were recorded in the Channelyzer at small size intervals (channels). Calibration of the CC and electron microscope. The CC and the electron microscope were calibrated with
APPL. ENVIRON. MICROBIOL.
the same standards by using monosized polystyrene latex spheres of three different diameters: 0.305 ,um (0.015 ,um3, Sigma Chemical Co., St. Louis, Mo.), 1.15 Rm (0.7% Rm3), and 3.07 ,um (15.15 ,um3) (Coulter Electronics, Inc., Hialeah, Fla.). For the scanning electron microscope, dehydration and CPD were omitted because of the high solubility of latex spheres in organic solvents. RESULTS
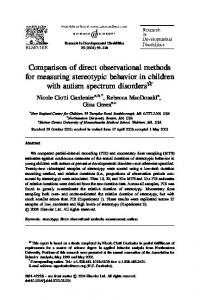
Laboratory cultures. Twelve microorganisms of different sizes (two yeasts and five heterotrophic and five phototrophic bacteria) were examined to compare the influence of the method used on the cellular volume. Electronic particle sizing with the CC was selected as a reference method for electron microscopy because of the few manipulations required to prepare the specimen, the fact that the analysis is performed in the wet state, and the unlimited number of cells that can be analyzed. During early work, we observed no significant statistical differences in average cell volume of three tested bacteria (P. aeruginosa, C. minus, and B. stearothermophilus) when results from the CC and from phase-contrast microscopy were compared by the Student t test (P > 0.05). On the other hand, electron microscopy requires complicated treatments of the sample to study it in the dried state without distortions, and the number of cells examined is limited. Particular microorganisms presented specific problems with some of the techniques used. Thus, B. catarrhalis (average size with SEM, 0.136 ,um3; standard deviation, 0.029), which tends to aggregate spontaneously in saline buffers, gave erroneously high volumes in the CC and was impossible to measure in TEM pictures. Also, bacteria with abundant sulfur globules inside their cells, such as C. minus, could not be measured in TEM pictures. Figures 1, 2, and 3 show the comparative results of the size frequency distributions for some of the microorganisms, as determined by SEM and the CC. Differences between both methods can be clearly observed, especially in phototrophic bacteria. Statistical comparisons among volume distributions determined by means of TEM, SEM, and the CC are recorded in Tables 1 and 2. A Friedman test for a randomized complete block design of the data from Table 1 gave significant differences (P < 0.001) among mean cell volumes obtained with the CC, TEM, and SEM, suggesting that estimates of average cell volume by means of electron microscopy were always smaller than those made with the CC. The mean cell volumes obtained with the CC were from 1.1 to 6.2 (mean, 2.3; standard deviation, 1.2) times higher than volumes determined with TEM and SEM, depending on the microorganism. There
VOL. 45, 1983
MICROBIAL CELL VOLUME DETERMINATION
Salmonella typhimurium
n1
2010-
0.5 3030)
1.0
Saccharomyces cerevisiae
z20l w
w U-
25
3030
50
it~pjaylococcus aureus _ _
20
1653
presented here, it is clear that most of the shrinkage in heterotrophic microorganisms is produced by air drying (TEM), whereas in phototrophic bacteria it is produced by CPD (SEM). This conclusion can be deduced directly from the fact that significant differences exist (t test, 0.01 < P < 0.02) when comparing the ratio between TEM and SEM and grouping the data into the two above-mentioned groups. Therefore, the strong shrinkage of phototrophic bacteria processed for SEM can be attributed to dehydration consisting of extraction of water by means of organic solvents that could extract photosynthetic pigments and other associated components specific for this physiological group. Field samples. Samples of phototrophic bacteria from Lakes Vilar and Ciso were taken at depths where maximum cell concentrations appeared and analyzed to compare the differences in size frequency distribution between SEM and the CC. In both lakes during the sampling date (28 August 1982), phototrophic bacteria belonging to the genus Chromatium constituted the dominant population. In Lake Ciso only one species could be observed, corresponding to C. minus, whereas in Lake Vilar two different
10
T h i ocapsa
0.2
0.4 VOLUME
60-
YIm31
40
FIG. 1. Size frequency distributions of three heterotrophic microorganisms, plotted as percentage of total number of cells, determined by SEM (stippled area) and with the CC (white area).
20 0
C-
was no relation of percent decrease either with average size or with the Gram reaction of the cell wall. Furthermore, as a rule, processing cells for SEM caused higher shrinkage than did processing for TEM. Comparison of the ratio between the CC and SEM showed that heterotrophic microorganisms exhibited differences in the range of 1.4 to 2.8, whereas in phototrophic bacteria there were comparatively larger differences (2.1 to 6.2). A t test showed that these differences were statistically significant (0.001 < P < 0.01), thus suggesting that phototrophic bacteria were strongly shrunken whereas heterotrophic microorganisms were less affected. Furthermore, it could be assumed that shrinkage was caused by air drying in preparation of samples for TEM and by organic solvent dehydration and CPD for SEM. Thus, from the data
2
z ul
a w LL
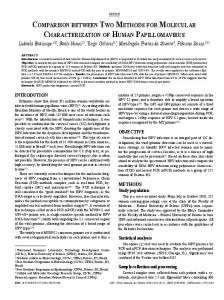
Rhodopseudomonas 40 20
-
0.5
l
VOLUME (,um3) FIG. 2. Size frequency distributions of T. roseopersicina and R. capsulata, plotted as percentage of total number of cells. Areas are as described in the legend to Fig. 1.
APPL. ENVIRON. MICROBIOL.
MONTESINOS, ESTEVE, AND GUERRERO
1654
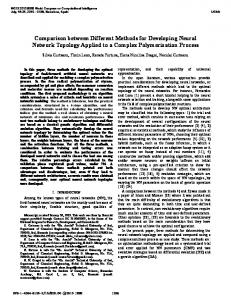
least in the sample from Lake Vilar, there was differential shrinkage among members of the Chromatiaceae. Figure 5 shows a scanning electron micrograph in which this differential shrinkage can be observed. The surface of the large Chromatium cell appears wrinkled, indicating a strong shrinkage, whereas the small Chromatium cell remains unaffected. The final result is that both Chromatium cells appear under the scanning electron microscope having approximately the same size. Volume distribution statistics collected in Table 3 show that very highly significant differences in volume (28% for Lake Ciso and 47% for Lake Vilar) existed between SEM and CC determinations.
z w
w
40-
0 £hlorobium vibrioforme
UI.
A
.0.
20-
.... e .,: .:
_
, 0:2
VOLUME (,um3) FIG. 3. Size frequency distributions of C. minus and C. vibrioforme, plotted as percentage of total number of cells. Areas are as described in the legend to Fig. 1.
Chromatium species could be distinguished on the basis of their size by means of the CC and optical microscopy (data not shown). Comparative results of the size frequency distributions are shown in Fig. 4. It can be observed that, at TABLE 1. Comparison
among
DISCUSSION The results presented here show that apparent bacterial volume can vary by factors from 1.1 to 6.2, depending on the microorganism and the method of determination. As a general rule, electron microscopy underestimates cell volume. Moreover, SEM preparation produces higher shrinkage than TEM preparation. On the basis of our comparative results with the CC and SEM, phototrophic bacteria were strongly affected, with a shrinkage of 2.1 to 6.2 times the original size, whereas heterotrophic microorganisms were less affected (1.4 to 2.8). Shrinkage was dependent neither on the size nor on the cell wall type because bacteria with similar volumes (S. aureus and C. vibrioforme) or Gram reactions (B. stearothermophilus and S. aureus) were differentially affected. These results are in opposition to those previously described by other authors (18).
cell volumes of 11 microorganisms, obtained with the CC and by SEM and TEM CC
TEM
x (p.m3)a
SDb
No.
x (,um3)
SD
No.
SEM x (,um3)
27.382 35.212 0.656 0.508 0.266 0.690
11.687 15.307 0.299 0.270 0.093
NDd ND
ND ND 0.176 0.084 0.069
144 121 115 201 160
17.220 25.011 0.379 0.183 0.134
0.229
191 146 170 174
ND ND 0.469 0.248 0.140 0.370
0.105
155
0.269
0.589 1.003
0.274 0.371 0.471 9.675 0.143
150 152 118 ND 153
0.576 0.680
0.243 0.230 0.258 ND 0.081
136 149
0.270 0.303 0.431 8.271 0.053
Microorganism
Candida albicans Saccharomyces cerevisiae Salmonella typhimurium Pseudomonas aeruginosa
Staphylococcus aureus Bacillus stearothermophilus Rhodopseudomonas capsulata Thiocapsa roseopersicina Chromatium vinosum Chromatium minus Chlorobium vibrioforme
1.504 24.589 0.328
0.853 ND 0.225
Mean of the size frequency distribution. Standard deviation of the size frequency distribution. ' Number of cells measured. The number of cells analyzed with the CC d ND, Not determined.
152 172 169
a
b
was
higher than 50,000.
SD
9.927 8.095 0.136 0.059 0.041 0.079 0.080 0.098
0.116 3.783 0.016
VOL. 45, 1983
MICROBIAL CELL VOLUME DETERMINATION
TABLE 2. Relationship among cell volumes of 11 microorganisms, obtained with the CC and by SEM and TEM' Microorganism
C. albicans S. cerevisiae S. typhimurium P. aeruginosa S. aureus B. stearothermophilus
CC-TEM CC-SEM TEM-SEM
NDb ND 1.4 2.0 1.9 1.8
1.6 1.4 1.7 2.8 2.0 2.6
ND ND 1.2 1.3 1.1 1.4
2.1 2.1 1.1 R. capsulata 2.2 3.3 T. roseopersicina 1.5 1.8 3.4 2.0 C. vinosum ND 3.0 ND C. minus 1.5 6.2 4.2 C. vibrioforme a Figures represent the quotients between the corresponding data in Table 1. bND, Not determined.
It has recently been reported (10, 21) that significant linear shrinkage (up to 37%) occurs during preparation of bacterial samples via the CPD method for SEM. Nevertheless, CPD has been adopted as the standard method for processing bacterial samples for SEM and TEM (24). It has been shown that dimensional changes occur during substitution of water by organic solvents before CPD. Boyde (5) found that mouse embryo limb cells which had been fixed with 3% glutaraldehyde shrank to 44 to 55% of the initial volume when progressively dehydrated in 70 to 100% ethanol and observed similar results with plant tissues. These results are in agreement with our observations of Chromatium cells under the phase-contrast microscope. Cells previously fixed as described above appeared wrinkled and formed aggregates when the sample was placed in 90% ethanol during the dehydration process. This effect was reversible because rehydration returned the cells to their original appearance. Unfortunately, dehydrating agents, as well as being substitutes for water, are organic solvents which can also extract some cell components, even from fixed specimens, and thus cause shrinkage (7). It is well known that acetone and ethanol extract lipids and photosynthetic pigments. We have observed this phenomenon at solvent concentrations higher than 80% during preparation of phototrophic bacteria for SEM. Evidence that strong shrinkage in phototrophic bacteria could be due to the solvent extraction of photosynthetic pigments is provided by a direct relationship between the specific bacteriochlorophyll content (Table 4) and the degree of shrinkage in the specimens treated for SEM. High specific bacteriochlorophyll content, as in members of the Chlorobiaceae, is associated
1655
with a high degree of shrinkage, whereas low pigment content, as in members of the Rhodospirillaceae, is related to low shrinkage. Nevertheless, on the basis of the differential shrinking among Chromatium species in natural samples, possible factors other than specific pigment content must be considered. They include physiological differences in lipid composition, intracellular globules, exopolymers, and water content. As an example of the situation in the current bibliography in marine microbial ecology, there is a considerable discrepancy in the published values for the mean sizes of marine bacteria that cannot be attributed to differences in sampling location, because marine habitats are rather constant. With regard to the methodology used in the determination of cellular size, it can be pointed out that authors that use techniques such as epifluorescence or carbon replicas (9, 23) find bacterial volumes of 0.090 to 0.279 ,um3, whereas workers using SEM find values 2.5 to 7.8 times smaller (0.036 to 0.060 ,um3) (4, 10, 25). These differences suggest shrinkage by a factor
0
C-
z
w
D 300 w
VILAR
LL 'rn Lu-
10-
1'0
20
VOLUME
(pum3)
FIG. 4. Size frequency distributions of Chromatium spp. obtained from samples of Lakes Ciso and Vilar (28 August 1981), plotted as percentage of total number of cells. Areas are as described in the legend to Fig. 1.
1656
APPL. ENVIRON. MICROBIOL.
MONTESINOS, ESTEVE, AND GUERRERO
FIG. 5. Scanning electron micrograph of a sample from Lake Vilar (28 August 1981), showing the two types of Chromatium spp. The large Chromatium cell appears wrinkled, whereas the small Chromatium cell remains unaffected. Long bar, 1 ,um.
of about 3 in relation to data reported by other authors (20), which are in the range of our observations with pure cultures measured with the CC and by electron microscopy. On the other hand, Watson et al. (23) found a good correlation between estimated volumes by means of carbon replicas, lipopolysaccharide, and acridine orange direct counting. However, their results are two to six times higher than
those of Bowden (4) on the same sample processed by SEM. In this way, our work shows a better correlation between TEM and the CC than between the CC and SEM. On the basis of our data, it is clear that current treatment of bacterial specimens for SEM, based on dehydration with organic solvents, produces variable shrinkage depending on the microorganism. TEM produces shrinkage, but
TABLE 3. Volume distribution statistics of Chromatium cells from samples from Lakes Ciso and Vilar as determined with the CC and by SEM CC
Lake x
(,um)b
SEM
SDb
No."
x (pum3)
SD
Ratio between mean vol with CC and SEMd
Ciso 8.892 3.397 165 6.332 5.307 1.4 (28) Vilar 12.290 6.541 161 6.444 2.366 1.9 (47) a Mean cell volume. b Standard deviation of the size frequency distribution. c Number of cells analyzed. The total number counted with the CC was higher than 50,000. d Percentage of shrinkage shown in parentheses.
t
t t
test
(tvalue)
9.64 11.34
MICROBIAL CELL VOLUME DETERMINATION
VOL. 45, 1983
1657
TABLE 4. Specific bacteriochlorophyll content in different strains of phototrophic bacteriaa Specific Bchlb Reference content (,ug/ Microorganism mg of protein)
323
Chlorobium limicola 6230 Chlorobium limicola 8327 Chlorobium vibrioforme CA 4210
110-220
6 strains of Chlorobium limicola
100-190
60-132
Schmidt (17) Broch-Due et al. (6)
Matheron (Ph.D. thesis, L'Universitd d'AixMarseille, 1976) Cohen-Bazire (8)
Chromatium vinosum SGM 185 Thiocapsa roseopersicina PR 2210 Thiocystis violacea BA 1610
50-85 5-28 23-43
Van Gemerden (22) Matheron (Ph.D. thesis) Matheron (Ph.D. thesis)
Rhodopseudomonas capsulata Rhodomicrobium vannielli a Data obtained from the literature. b Bchl, Bacteriochlorophyll.
28-33 15-51
Aiking and Sojka (1) Trentini and Starr (19)
the cell volume is closer to the original than that obtained with SEM. As a consequence, care must be taken to determine cellular volume with SEM, especially when working with phototrophic bacteria, because the resulting underestimated biomass may lead to erroneous ecological implications. Thus, it seems that the best way to determine cellular volumes when using TEM and SEM would be to use freeze-drying methods of dehydration, which do not extract cellular materials. Obviously, this point requires further experimental attention, and studies to check this alternative are now in progress. Other techniques such as epifluorescence, phase-contrast microscopy, and electronic particle sizing should be used for comparison purposes or as valid alternatives to electron microscopy. ACKNOWLEDGMENTS We thank Hans G. Truper for providing C. vibrioforme forma sp. thiosulfatophilum 8327 and Guillem Prats for supplying B. catarrhalis. We also wish to thank Nofre Castell for technical assistance with the electron microscopy and Carlos Pedr6s-Ali6 for helpful discussions during the preparation of the manuscript. We acknowledge the Fundaci6 M. F. Roviralta (Barcelona) for a grant for the purchase of equipment. This work was supported by a grant from the Comisi6n Asesora de Investigaci6n Cientffica y Tecnica, Spain.
LITERATURE CITED 1. Aiking, H., and G. Sojka. 1979. Response of Rhodopseudomonas capsulata to illumination and growth rate in a light-limited continuous culture. J. Bacteriol. 139:530536. 2. Biebl, H., and N. Pfennig. 1978. Growth yields of green sulfur bacteria in mixed cultures with sulfur and sulfate reducing bacteria. Arch. Microbiol. 117:9-16. 3. Biebl, H., and N. Pfennig. 1979. Anaerobic CO2 uptake by phototrophic bacteria. A review. Arch. Hydrobiol. Beih. 12:48-58. 4. Bowden, W. B. 1977. Comparison of two direct-count techniques for enumerating aquatic bacteria. Appl. Environ. Microbiol. 33:1229-1232. 5. Boyde, A. 1980. Review of basic preparation techniques
for biological scanning electron microscopy, p. 768-777. In P. Brederoo and W. de Priester (ed.), Electron microscopy 1980. Vol 2. Seventh European Congress on Electron Microscopy Foundation. Leiden, The Netherlands. 6. Broch-Due, M., J. G. Ormerod, and B. S. Fjerdingen. 1978. Effect of light intensity on the vesicle formation in Chlorobium. Arch. Microbiol. 116:269-274. 7. Chandler, J. A. 1977. X-ray microanalysis in the electron microscope. North-Holland Publishing Co., Amsterdam. 8. Cohen-Bazire, G. 1963. Some observations on the organibacteria, p. 89-114. In H. Gest, A. San Pietro, and L. P. Vernon (ed.), Bacterial photosynthesis. Antioch Press, Yellow Springs, Ohio. 9. Fergusson, R. L., and R. Rublee. 1976. Contribution of bacteria to standing crop of coastal plankton. Limnol. Oceanogr. 22:141-145. 10. Fuhrman, J. A. 1981. Influence of the method on apparent size distribution of bacterioplankton cells: epifluorescence microscopy compared to scanning electron microscopy. Mar. Ecol. Prog. Ser. 5:103-106. 11. Guerrero, R., E. Montesinos, I. Esteve, and C. A. Abella. 1980. Physiological adaptation and growth of purple and green sulfur bacteria in a meromictic lake (Vila) as compared to a holomictic lake (Sis6), p. 161-171. In M. Dokulil, H. Metz, and D. Jewson (ed.), Shallow lakes. Contribution to their limnology. Developments in Hydrobiology, vol 3. Dr. W. Junk bv Publishers, The Hague. 12. Hayat, M. A. 1978. Introduction to biological scanning electron microscopy. University Park Press, Baltimore. 13. Holm-Hansen, O., and C. R. Both. 1966. The measurement of adenosine triphosphate in the ocean and its ecological significance. Limnol. Oceanogr. 11:510-519. 14. Krambeck, C., H.-J. Krambeck, and J. Overbeck. 1981. Microcomputer-assisted biomass determination of plankton bacteria on scanning electron micrographs. Appl. Environ. Microbiol. 42:142-149. 15. Pedr6s-Ali6, C., and T. D. Brock. 1982. Assessing biomass and production of bacteria in eutrophic Lake Mendota, Wisconsin. Appl. Environ. Microbiol. 44:203-218. 16. Salonen, K. 1977. The estimation of bacterioplankton numbers and biomass by phase-contrast microscopy. Ann. Bot. Fenn. 14:25-28. 17. Schmidt, K. 1980. A comparative study on the composition of chlorosomes (Chlorobium vesicles) and cytoplasmic membranes from Chloroflexus aurantiacus strain OK-70-fl and Chlorobium limicola f. thiosulfatophilum strain 6230. Arch. Microbiol. 124:21-31. 18. Straskrabovg, V., and J. KomirkovA. 1979. Seasonal changes of bacterioplankton in a reservoir related to algae. I. Numbers and biomass. Int. Rev. Gesamten Hydrobiol. 64:285-302.
1658
MONTESINOS, ESTEVE, AND GUERRERI
19. Trentini, W. C., and M. P. Starr. 1967. Growth and ultrastructure of Rhodomicrobium vannielii as a function of light intensity. J. Bacteriol. 93:1699-1704. 20. Troitsky, A. S., and Y. I. Sorokin. 1967. On the methods of the calculation of the bacterial biomass in water bodies. Trans. Inst. Biol. Inland Waters Acad. Sci. U.S.S.R. [In Russ.] 19:85-90. 21. Trueba, F. J., and C. L. Woldringh. 1980. Changes in cell diameter during the division cycle of Escherichia coli. J. Bacteriol. 142:869-878. 22. Van Gemerden, H. 1980. Survival of Chromatium vinosum at low light intensities. Arch. Microbiol. 125:115-121.
APPL. ENVIRON. MICROBIOL. 23. Watson, S. W., T. J. Novitsky, H. L. Quinby, and F. W. Valois. 1977. Determination of bacterial number and biomass in the marine environment. Appl. Environ. Microbiol. 33:940-946. 24. Young, L. Y. 1978. Bacteriopneuston examined with critical point drying and transmission electron microscopy. Microb. Ecol. 4:267-277. 25. Zimmermann, R. 1977. Estimation of bacterial number and biomass by epifluorescence microscopy and scanning microscopy, p. 103-120. In G. Rheinheimer (ed.), Microbial ecology of a brackish water environment. SpringerVerlag, Berlin.