Recent Advances in Mechanics, Mechatronics and Civil, Chemical and Industrial Engineering
Comparison between techniques for generating 3D models of cultural heritage V. Barrile, G. Bilotta, D. Lamari, G. M. Meduri
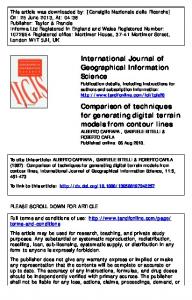
In this paper, a promising photogrammetric technique is applied to a XV-XVI century masonry castle in southern Italy (Marina di Gioiosa Jonica, Reggio Calabria) called Torre Galea (Fig. 1) for the purpose of building surveying and structural modeling.
Abstract— In recent years 3D digitizing and modeling of cultural heritage has become increasingly common. This is due mainly to advances in laser-scanning techniques, to modeling techniques based on images, to increasing the computing power and to virtual reality. In this work we compared consolidated operating mode of the laser scanner with the techniques of image capture and generation of 3D models based on photographs made with ordinary digital cameras. Through the help of special software exploiting appropriate photogrammetric techniques and algorithms defined in "Structure from Motion" (SfM) we can get reconstructions and high-resolution DEMs (Digital Elevation Model) of high quality. Object of study is a masonry tower dating back to the fifteenth and sixteenth century located in the south of Italy (Marina di Gioiosa Jonica, Reggio Calabria).
Keywords—Geometrical survey, Masonry structures, Photogrammetric techniques, Structure from motion, Terrestrial laser scanner. I. INTRODUCTION
T
HE world of cultural heritage is experiencing a phase of promotion and development of its assets thanks to the progress of survey techniques and multimedia communication. The introduction of new measuring devices such as 3D laser scanners, spherical photogrammetry, structure-from-motion photogrammetry and the latest methods of image-based modeling produced a strong change in the mode of acquisition, treatment and restitution of metric information. These new techniques allow the construction of digital photo-realistic 3D models that can be used as an information system and as an aid to structural modeling. The digital model becomes an operational tool that can be implemented in new information systems able to handle complex and typologically heterogeneous data for both single buildings and large geographical areas.
Fig. 1 Views of Torre Galea- Marina di Gioiosa Jonica (RC)
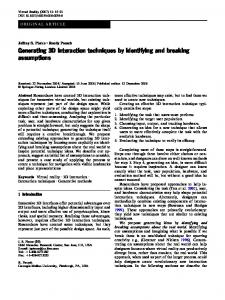
The flow chart of Fig. 2 shows the workflow, starting from the digital images, yields to the 3D structural model.
V. Barrile is with the DICEAM Department, Faculty of Engineering Mediterranean University of Reggio Calabria, Reggio Calabria 89100 IT (phone: +39-0965-169-2301; e-mail:
[email protected]). G. Bilotta was with the Department of Planning, IUAV University of Venice, Venice 30135 IT. She now collaborates with the DICEAM Department, Faculty of Engineering Mediterranean University of Reggio Calabria, Reggio Calabria 89100 IT (e-mail:
[email protected]). D. Lamari is with the DICEAM Department, Faculty of Engineering Mediterranean University of Reggio Calabria, Reggio Calabria 89100 IT (email:
[email protected]). G. M. Meduri is with the DICEAM Department, Faculty of Engineering Mediterranean University of Reggio Calabria, Reggio Calabria 89100 IT (email:
[email protected]).
ISBN: 978-1-61804-325-2
Digital Image Acquisition
3D model construction
Polygon mesh improvement
Construction of the model with 3D surface objects
Finite element model for structural analysis
Fig. 2 Workflow for transition from photogrammetric 3D survey to a structural model
140
Recent Advances in Mechanics, Mechatronics and Civil, Chemical and Industrial Engineering
II. CONSTRUCTION OF 3D MODEL
PhotoScan, described in detail in the manual supplied with the software.
The procedure of photographs processing and 3D model construction comprises four main steps. 1. The first phase is the alignment of the camera. At this step, PhotoScan seeks common points on the photographs to merge with each other through the identification of a matching camera for every image and parameters of aging and calibration. As a result, they form a cloud of scattered points and a series of shots. The points of the cloud representing the alignment results between photos and will not be used directly in a further procedure of construction of the 3D model (except for the method of reconstruction cloud based Fig. 3). However, it can be exported for further use in external programs. For example, the cloud obtained can be used in a 3D editor as a reference to any evaluations. On the contrary, the set of positions taken by the camera are essential for the construction of the 3D model via PhotoScan. 2. The next phase is the construction of dense point cloud. (Fig. 4) Based on the positions of recovery estimated and extracted from the photos, PhotoScan generates a point cloud more dense and detailed. This point cloud can be modified and classified before proceeding with the export or the generation of three-dimensional mesh model. 3. Then we proceed with the construction of the mesh. (Fig. 5) PhotoScan reconstructs the surface of a 3D polygon mesh representing the object based on the dense point cloud obtained from the previous stage. In this case, Point Cloud based method can be used for the rapid generation of geometries based on point clouds scattered. Generally, there are two algorithmic methods available in PhotoScan that can be applied for the generation of 3D meshes: Field Height - for the type planar surfaces, or Arbitrary - for each object type. 4. After building the polygonal network, it may be necessary to adjust them. PhotoScan is able to make some corrections, such as decimation of the mesh, the removal of isolated components, the closing of holes, etc. When a more complex and detailed editing is pursued, a professional editing software has to be used. In this regard, PhotoScan allows exporting the mesh and to edit it with another software and then reopen it in PhotoScan through the most common interchange formats. 5. After the geometry (and hence the mesh) has been reconstructed, it can be structured and/or used for the production of orthophotos. There are several ways in texturing
Fig. 4 Dense Point Cloud
Fig. 5 Mesh
Fig. 6 Texture with the position of the camera (blue square)
It is possible to scale the 3D model starting from a known measurement, for example, we measured in a site the size of the door, which was found to be 0.90 meters. In order to scale the model we define two markers (Fig. 8) that allow defining the distance between two known points, then we proceed to create a "scale bar" and to change the known distance. Fig. 3 Point Cloud Base ISBN: 978-1-61804-325-2
141
Recent Advances in Mechanics, Mechatronics and Civil, Chemical and Industrial Engineering
Fig. 9 Mesh with damaged areas identified in red
Fig. 7 3D model with texture
Fig. 10 Measurement of the door by two points
Fig. 8 Markers with flags
III. POLYGON MESH IMPROVEMENT For eliminating defects of mesh, we proceed exporting the 3D model from PhotoScan in STL format, and then we imported the model into Geomagic Studio software. This software provides editing point cloud, mesh and editing functions of advanced surfacing, in addition to its accurate functions of processing 3D data. The Mesh Doctor is an automatic improvement of polygon mesh. It is generally preferable to use the Mesh Doctor after importing a polygonal model. The steps to follow in order to improve the mesh are: 1. Import the model (STL) within Geomagic Studio to set the unit of measurement. 2. The software automatically recognizes the presence of mesh and then provide information to that effect and asks if you want to launch an analysis mesh doctor, once made the analysis shows us graphically (Fig. 9) identifying with red areas the parts of the mesh that need to be repaired. 3. If necessary, we can rescale the model using the specific tool available in Geomagic (Figg. 10, 11).
ISBN: 978-1-61804-325-2
Fig. 11 The tool "Resize"
IV. INSTRUMENTS AND SOFTWARE USED For the survey we used the laser scanner Leica HDS 3000 distributed with the software supplied by Leica (Cyclone™) that allows we to manage both scanning operations and those of computing and data processing. The scans required the use of 16 targets arranged on the frame in such positions that, the various scans, had in common at least 4 targets, fundamental for the subsequent phase of recording and sewing of consecutive scans. After the survey phase, in the laboratory, we generated the 3D model of the structure through the recording operations of the various scans (whose characteristics are shown in table III) and the subsequent thinning of the raw data by eliminating the highest number of points not belonging to the structure and surrounding vegetation. We thus obtained a single cloud of 142
Recent Advances in Mechanics, Mechatronics and Civil, Chemical and Industrial Engineering
points representative of the investigated object. Since, also, the tool equipped with an inner camera to the CCD for the simultaneous acquisition of images of the raised portion, it was obtained a model highly realistic (Fig. 12) resulting from the association, with each point laser detected, of information of the color of its digital image. 3D laser scanning of the tower was carried out by two operators. There have been 4 scans around the outer perimeter of the object in a time of ca. 1.4 hours. To merge the scans have been used 16 target. For the next RGB color scans have been used 52 photographs. The entire point cloud thus obtained ca. 26 million, was sampled up to a distance of 1 cm with Geomagic Studio software. It was subsequently generated a 3D mesh with 1.3 million vertices ca. and 2.5 million faces ca. The work activities related to TLS can be so summarized: 1,4 hours for the acquisition of the 4 scans, 1.5 hours for the RGB coloring of all scans, 2.5 hours to the meshing in Geomagic Studio for a total 5.4 hours for the entire workflow The generation of 3D point clouds from photogrammetric data with related models was carried out with the open-source software bundler / PMVS2 and VisualSFM and with low-cost software PhotoScan produced by Agisoft. A feature common to both VisualSFM that PhotoScan is the use of algorithms that make wide use of the GPU in order to significantly accelerate the processing of data. The images were captured with a Samsung model PL20 with CCD sensor 1/2:33” and shutter aperture f/3.5-5.9. The images obtained have dimensions of 4320 x 33240 pixels. The images were taken at eye. A total of 219 photographs were taken for the entire outdoor area. The generation of point clouds was conducted with a Workstation DELL T7610 processor XEON 2680 v2 10 core with 32 GB of RAM equipped with an NVIDIA Quadro FX 4800 with 1.5 GB of RAM and running Windows 7 Professional 64-bit. Table I summarizes the results obtained from the use of the three software.
sophisticated model of camera calibration including the determination of the focal length and the distortion of the radial lens.
Fig. 12 Grayscale point cloud obtained by laser scanner survey
Fig. 13 Point cloud (spectrum) obtained by laser scanner survey
Table I Statistics on the production of clouds of points with the use of the three software Visual SFM
Bundler/PMVS2
PhotoScan
No. images
219
219
219
No. points
8741118
13527920
28431222
Time
2,10 h
3,25 h
4,75 h
Standard deviation σ
8 cm
4,5 cm
2 cm
You may notice the important differences in the results obtained. All the clouds generated by the three software have been scaled using different reference distances measured in the field. The accuracy of the distances of the reference appears significantly influenced by the density of the points constituting the cloud. It is to highlight how the software PhotoScan offers the possibility to locate and fix the control points in the shots made at high resolution, to use a ISBN: 978-1-61804-325-2
Fig. 14 Texture obtained by laser scanner survey
143
Recent Advances in Mechanics, Mechatronics and Civil, Chemical and Industrial Engineering
V. 3D MODELS IN COMPARISON
a large number of photographs necessary for a complete reconstruction of the object acquired. At present, experimentations continue in order to optimize the generation of 3D models with particular reference to the findings of archaeological. To do this, we make extensive use of UAV systems with substantial results.
We compared the 3D models of the Tower, made with VisualSFM, Bundler/PMVS2 and Agisoft Photoscan, with reference data obtained from laser scanning to assess the geometric quality of the 3D models. The quality of the 3D data obtained from VisualSFM and Bundler/PMVS2 does not match the high quality geometric obtained by TLS. In particular, in the generation of the 3D model, there was a deviation of 20 cm with VisualSFM and 16 with Bundler/PMVS2. The deviation detected with PhotoScan was 4 cm. The tables summarize the results obtained from the survey and Photoscan TLS.
REFERENCES [1]
[2] [3]
Table II Summary results from PhotoScan Photo No.
Acquisition time
Processing time
Dense cloud
Vertices No.
Sides No.
219
0,4 h
4,75 h
28431222
1516899
3028118
Standard deviation σ
[4] [5]
4 cm
[6]
Table III Summary results from TLS method [7] Setting up No.
Acquisition time
Processing time
Dense cloud
Vertices No.
Sides No.
Standard deviation σ
4
1,4 h
4h
25822457
1314597
2518047
0,5 cm
[8] [9] [10] [11]
VI. CONCLUSIONS This work shows that, next to the surveys carried out with laser scanner systems, even low cost systems based on photographic shots are able to produce 3D of large objects such as the Tower under study. Data acquisition with cameras is fast, flexible and economical than laser scanning. The results obtained with the software PhotoScan show mean deviations of two centimeters resulting geometrically very close to the data obtained by laser scanning. The software VisualSFM and Bundler/PMVS2 well suited to the acquisition and generation of 3D models of small objects, for the return of large objects show all their limits. As regards the quality and the reliability, the limiting factors of SFM are, in general, and especially for large objects, the light conditions, the number of images, and the resolution of the photographs taken. They are also to be particularly important measurement procedures and the identification of control points for resizing the 3D model obtained. To this purpose, the use of a camera with high resolution and with the objectives of superior quality could improve the results obtained. In the present case, we could obtain results significantly more optimized and precise if the acquisition of the images was made using UAV systems. It is evident as the performance capabilities of the computers are critical to the minimization of the processing time of the data, especially for larger objects, characterized by ISBN: 978-1-61804-325-2
[12]
[13]
[14]
[15]
[16]
[17] [18]
[19]
144
A. Bandiera, J. A. Beraldin, M. Gaiani, “Nascita ed utilizzo delle tecniche digitali di 3D imaging, modellazione e visualizzazione per l’architettura e i beni culturali”, Ikhnos, 2011, pp. 81-134. L. Guidi, Acquisizione 3D e modellazione poligonale. Edizione Mondadori, Milano, 2010. L. Barazzetti, G. Forlani, F. Remondino, R. Roncella, M. Scaioni, “Experience and achievements in automated image sequence orientation for close-range photogrammetric projects” in Proceedings of SPIE Optics+Photonics, vol. 8085, 23-26 May, Munich, Germany, 2011. M.T. Como, “Il restauro di monumenti a torre in muratura”, Restauro, 2000, pp.152- 153. V. Barrile, G.M. Meduri, G. Bilotta, “Comparison between Two Methods for Monitoring Deformation with Laser Scanner”, WSEAS Transactions on Signal Processing, vol.10, 2014, pp. 497-503. V. Barrile, G.M. Meduri, G. Bilotta, “Laser scanner technology for complex surveying structures”, WSEAS Transactions on Signal Processing, no.3, vol.7, 2011, pp. 65-74. V. Barrile, G.M. Meduri, G. Bilotta, “Laser scanner surveying techniques aiming to the study and the spreading of recent architectural structures” in Proceedings of the 9th WSEAS International Conference on Signal, Speech and Image Processing (SSIP '09): Recent Advances in Signal and Systems, 2009, pp. 92-95. Agisoft PhotoScan v.1.1 (http://www.agisoft.com/). Geomagic Studio 2013 (http://www.geomagic.com/). Autodesk Autocad 2016 (http://www.autodesk.it/). V. Barrile, G. M. Meduri, R. Pucinotti, “Il rilievo di strutture esistenti mediante l’impiego della scansione laser finalizzato alla modellizzazione strutturale: un caso di studio” in Atti del Convegno Nazionale "Sperimentazione su Materiali e Strutture", Venice, december 2006, pp. 831-838. R. Pucinotti, G. M. Meduri, V. Barrile, "L’applicazione della scansione laser e della tecnologia radar ad un ponte in cemento armato" in Atti del 12° Congresso Nazionale dell’AIPND – Conferenza Nazionale sulle Prove non Distruttive Monitoraggio Diagnostica, Milan, 11-13 October 2007, pp. 1-8. V. Barrile, G. M. Meduri, G. Bilotta, "Laser scanner surveying techniques aiming to the study and the spreading of recent architectural structures" in Proceedings of the 2nd WSEAS International Conference on Engineering Mechanics, Structures and Engineering Geology, EMESEG '09: "Recent Advances in Engineering Mechanics, Structures and Engineering Geology", Rodos, Greece, July 22-24, 2009, pp. 2528. V. Barrile, G. Bilotta, G. M. Meduri, “Archaeological Investigations with TLS and GPR Surveys and Geomatics Techniques”, in Towards Horizon 2020 - Proceedings of 33rd EARSeL Symposium 2013 3-6 June 2013, Matera, Italy, pp. 857-864. F. Remondino, F. Menna, “Image-based surface measurement for closerange heritage documentation”, International Archives of Photogrammetry, Remote Sensing and Spatial Information Sciences, vol. 37(B5-1), 2008, pp. 199-206. F. Remondino, S. F. El-Hakim, A., Gruen, L. Zhang, “Turning images into 3-D models”, IEEE Signal Processing Magazine, vol. 25 no. 4, 2008, pp. 55-65. D. Scharstein, R. Szeliski, Middlebury Stereo Vision Page, 2009, http://vision.middlebury.edu/stereo/, visited at 7.1.2012. N. Snavely, S. M. Seitz, R. Szeliski, “Modeling the World from Internet Photo Collections”, International Journal of Computer Vision, vol. 80 no. 2, 2008, pp. 189-210. D. Abate, G. Furini, S. Migliori, S. Pierattini, “Project Photofly: New 3D Modelling Online WEB Service”, International Archives of
Recent Advances in Mechanics, Mechatronics and Civil, Chemical and Industrial Engineering
Photogrammetry, Remote Sensing and Spatial Information Sciences vol. 38 (5/W16), 2011, pp.391-396. [20] M. A. Fonstad, J. F. Dietrich, B. C. Courville, J. L. Jensen, P. E. Carbonneau, “Topographic structure from motion: a new development in Photogrammetric measurement”, Eart. Surf. Process. Landforms, no. 38, 2013, pp. 421-430. [21] M. Bolognesi, A. Furini, V. Russo, A. Pellegrinelli, P. Russo, “Accuracy of cultural heritage 3D models by RPAS and terrestrial photogrammetry”, The International Archives of the Photogrammetry, Remote Sensing and Spatial Information Sciences, no. XL-5, 2014, pp. 113-119.
ISBN: 978-1-61804-325-2
145