Dec 19, 2014 - tional SV model; option pricing; calibration; optimization ... how the optimization procedures can be used for the calibra- ...... + Website, ser.
Applied Numerical Mathematics and Scientific Computation
On Optimization Techniques for Calibration of Stochastic Volatility Models. Milan Mr´azek, Jan Posp´ısˇil, Tom´asˇ Sobotka (Invited Paper) on the market in order to compute prices of more complex (exotic) options or hedge ratios. The complexity of the model calibration process increases with more realistic models and the fact that the estimation method of model parameters becomes as crucial as the model itself is mentioned by Jacquier and Jarrow [11]. In our case, the input parameters can not be directly observed from the market data, thus empirical estimates are of no use. It was well documented in Bakshi et al. [2] that the model implied parameters differ significantly from their timeseries estimated counterparts. Cited paper for example shows, that the magnitudes of time-series correlation coefficient of the asset return and its volatility estimated from the daily prices were much lower than their model implied counterparts. Moreover, the information observed from market data is insufficient to exactly identify the parameters, because several sets of parameters may be performing well and provide us with model prices that are close to the prices observed on the market. This is what causes the ill-posedness of the calibration problem. The paper is organized as follows. In section II we briefly introduce the Heston model together with the semi-closed form solution for vanilla options. In section III we demonstrate the complexity of the calibration process and employ variety of optimizers. Among the considered methods there are be two global optimizers Genetic algorithm (GA) and Simulated annealing (SA) as well the local search method (denoted by LSQ). We use the different optimizers with a specific approach to calibrate the Heston model to data obtained from the real market, namely we use daily data for DAX Options obtained using the Bloomberg Terminal and in the next section the FTSE 100 options. In section IV we introduce a jump-diffusion model of market dynamics with approximative fractional volatility (FSV model). We show that the option pricing problem under this model attains a semi-closed form solution and demonstrate how the optimization procedures can be used for the calibration task. We will conclude our results in section V.
Abstract—The aim of this paper is to study stochastic volatility models and their calibration to real market data. This task is formulated as the optimization problem and several optimization techniques are compared and used in order to minimize the difference between the observed market prices and the model prices. At first we demonstrate the complexity of the calibration process on the popular Heston model and we show how well the model can fit a particular set of market prices. This is ensured by using a deterministic grid which eliminates the initial guess sensitivity specific to this problem. The same level of errors can be reached by employing optimization techniques introduced in the paper, while also preserving time efficiency. We further apply the same calibration procedures to the recent fractional stochastic volatility model, which is a jump-diffusion model of market dynamics with approximative fractional volatility. The novelty of this paper is especially in showing how the proposed calibration procedures work for even more complex SV model, such as the introduced long-memory fractional model. Keywords—stochastic volatility models; Heston model; fractional SV model; option pricing; calibration; optimization
I. I NTRODUCTION
I
N finance, stochastic volatility (SV) models are used to evaluate derivative securities, such as options. These models were developed out of a need to modify the Nobel price winning Black Scholes model [3] for option pricing, which failed to effectively take the volatility in the price of the underlying security into account. The Black Scholes model assumed that the volatility of the underlying security was constant, while SV models consider it to be a stochastic process. Among the first publications about stochastic volatility models were Hull and White [9], Scott [19], Stein and Stein [21] and Heston [8]. Calibration is the process of identifying the set of model parameters that are most likely given by the observed data. Heston model was the first model that allowed reasonable calibration to the market option data together with semi-closed form solution for European call/put option prices. Heston model also allows correlation between the asset price and the volatility process as opposed to Stein and Stein [21]. Although the Heston model was already introduced in 1993 and several other SV models appeared, Heston model is nowadays still one of the most popular models for option pricing. The industry standard approach in calibration is to minimize the difference between the observed prices and the model prices. Option pricing models are calibrated to prices observed
II. H ESTON MODEL Following Heston [8] and Rouah [18] we consider the riskneutral stock price model √ ftS , vt St dW √ fv dvt = κ(θ − vt )dt + σ vt dWt , S fv f dWt dWt = ρ dt, dSt = rSt dt +
All authors are with NTIS - New Technologies for the Information Society, Faculty of Applied Sciences, University of West Bohemia, Plzeˇn, Czech Republic, emails: {mrazekm,honik,sobotkat}@ntis.zcu.cz Manuscript received November 10, 2014.
ISBN: 978-1-61804-253-8
34
(1) (2) (3)
Applied Numerical Mathematics and Scientific Computation
observed at time t. C Θ denotes the model price computed using vector of model parameters, for Heston SV model we have Θ = (κ, θ, σ, v0 , ρ). The function G is an objective function of the optimization problem (5) and it is neither convex nor of any particular structure. It may have more than one global minimum and it is not possible to tell whether a unique minimum can be reached by gradient based algorithm. When searching for the global minimum, a set of linear constraints must be also added to the problem, because of the parameters values. For example in Heston SV model, ρ represents correlation coefficient and thus ρ needs to only attain values within the interval [−1, 1]. Local deterministic algorithms can be used to solve the calibration problem, but there is significantly high risk for them to end up in a local minimum, also initial guess needs to be provided for them, which appears to affect the performance of local optimizers severely. Different take on the calibration is represented by the regularisation method. Penalization function, e.g., f (Θ) such that inf G(Θ) + αf (Θ)
with initial conditions S0 ≥ 0 and v0 ≥ 0, where St is the price of the underlying asset at time t, vt is the instantaneous variance at time t, r is the risk-free rate, θ is the long run average price variance, κ is the rate at which vt reverts to θ fS , W f v ) is a twoand σ is the volatility of the volatility. (W e dimensional Wiener process under the risk-neutral measure P with instantaneous correlation ρ. Stochastic process vt is referred to as the variance process (also known as volatility process) and it is the square-root mean reverting process, CIR process Cox et al. [5]. It is strictly positive and cannot reach zero if the Feller [6] condition 2κθ > σ 2 is satisfied. Heston SV model allows for a semi-closed form solution for vanilla option, which involves numerical computation of an integral. Several pricing formulas were added to the original one by Heston [8], e.g. Albrecher et al. [1], Kahl and J¨ackel [12], Lewis [14] or Zhylevskyy [25]. We will use here the formulas by Lewis [14]. Let K be the strike price and τ = T − t be the time to maturity. Then the price of a European call option at time t on a non-dividend paying stock with a spot price St is C(S, v, t) = S − Ke−rτ
1 π
Z
∞+i/2
e−ikX
0+i/2
Θ
is convex, is added to the objective function (5), which enables the usage of gradient based optimizing procedures. This method yields another parameter to be estimated α, which is called regularisation parameter. More details on this approach can be seen in Cont and Hamida [4].
ˆ H(k, v, τ ) dk, 2 k − ik (4)
where X = ln(S/K) + rτ and
A. Considered algorithms
� � � 2κθ 1 − he−ξt + tg − ln σ2 1−h � ��! 1 − e−ξt + vg , 1 − he−ξt
ˆ H(k, v, τ ) = exp
Facing the calibration problem (5), we took into account several optimizing methods and tested these on a set of generated prices by the actual Heston model. That means that we were aware of the parameters that would fully explain the synthetic generated market prices and we were able to judge the algorithms on how close they were able get to this set of parameters. The ones that performed best we used afterwards on a real set of data observed on market. Among the considered methods were two (heuristic) global optimizers Genetic algorithm (GA) and Simulated annealing (SA) as well as the local search method (denoted by LSQ). GA and SA are available in MATLAB’s Global Optimization Toolbox as functions ga() and simulannealbnd() respectively, whereas LSQ is available in MATLAB’s Optimization Toolbox as function lsqnonlin() that implements the GaussNewton trust-region-reflective method with the possibility of choosing the Levenberg-Marquardt algorithm. We also tested performance of MS Excel’s solver and Adaptive simulated annealing (ASA) (available at ingber.com) as well as modSQP suggested in Kienitz and Wetterau [13]. Based on the results we abandoned MATLAB’s Simulated annealing (SA) and modSQP. They both seemed to work fine on a small example but they did not seem to be applicable for a larger number of generated strikes and maturities.
where g=
b−ξ , 2 r
h=
b−ξ , b+ξ
t=
σ2 τ , 2
4(k 2 − ik) b2 + , σ2 � � 2 b = 2 ikρσ + κ . σ
ξ=
III. C ALIBRATION OF SV MODEL The model calibration is formulated as an optimization problem. The aim is to minimize the pricing errors between the model prices and the market prices for a set of traded options. A common approach to measure these errors is to use the squared differences between market prices and prices returned by the model, this approach leads to the nonlinear least square method
inf G(Θ), Θ
G(Θ) =
N X
wi |CiΘ (t, St , Ti , Ki ) − Ci∗ (Ti , Ki )|2 ,
i=1
B. Measured errors
(5) where N denotes the number of observed option prices, wi is a weight, Ci∗ (Ti , Ki ) is the market price of the call option ISBN: 978-1-61804-253-8
As a criterion for the performance evaluation of the optimizing methods we were recording the following errors: 35
Applied Numerical Mathematics and Scientific Computation
MARE(Θ) = max i
|CiΘ − Ci∗ | Ci∗
(6)
and
2.5% 2%
(7)
1.5%
for i = 1, . . . , N . MARE denotes maximum absolute relative error and AARE is the average of the absolute relative error across all strikes and maturities.
Error
N 1 X |CiΘ − Ci∗ | AARE(Θ) = N i=1 Ci∗
1% 0.5% 19-Dec-14
0%
C. Considered weights
7500
Weights in (5) are denoted by wi . It makes sense to put the most weight where the most liquid quotes are on the market, which is usually around ATM. We employed the bid ask spreads δi > 0 with our market data and aimed to have the model prices close to the mid prices, that are considered as the market prices Ci∗ . We decided not to limit ourselves with just one choice for the weight function, but to test more of these and explore any influence on the results caused by the particular choice of the weight function. The weights are denoted by capital letters A,B,C as follows: weight A: weight B: weight C:
1 , |δi | 1 wi = 2 , δi wi =
1 wi = √ . δi
21-Mar-14 7750
8000
8250
20-Sep-13 8600
19-Mar-13
Maturities
Strikes
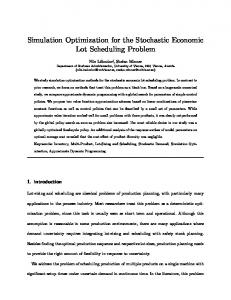
Fig. 1. Results of calibration for pair GA and LSQ in terms of absolute relative errors.
and obtain an average absolute relative error 0.65%, see Fig. 1, which is comparable to the average absolute relative error obtained by the method using deterministic grid as the initial value for LSQ mentioned above. Moreover the maximum absolute relative error was only 2.22% using the approach of combining the optimization methods. When comparing the global optimizers GA provided better results than ASA. Also the initial guess from GA was the one which was later refined by LSQ producing lowest maximum absolute relative error of 2.22%, which can be observed in Fig. 1. As it shows in TABLE I, the choice of weights can play a significant role during the calibration process. Different weights yielded best results for both GA and ASA, however LSQ seems to be favoring weights B. For all the results mentioned above see TABLE I and for more results see [16].
(8) (9) (10)
The above means that the bigger the spread the less weight is put on the particular difference between the model price and the market price (mid price) during the calibration process. D. Empirical results for Heston model on real market data In order to overcome the initial guess sensitivity, we chose to adopt the approach of combining the global and local optimizers. We would start with a global optimizer (GA, ASA) and provide the result as an initial guess to a local optimizer (LSQ, Excel’s solver). We tested this approach on market prices obtained on March 19, 2013 from Bloomberg’s Option Monitor for ODAX call options. We used a set of 107 options for 6 maturities. S0 was the current DAX value at the time and as r we took the corresponding EURIBOR rate. For a benchmarking purpose we used an error, that was achieved by dividing the state space of all possible parameters into a grid in order to obtain a large set of initial values. Starting from all these initial values was rather time consuming, nevertheless it served us as an indicator of how well the model can actually explain this particular set of market prices. We were able to achieve AARE of 0.58%, see TABLE I. Following the results in TABLE I, we can see that Excel failed to significantly refine the initial values provided by the global optimizers. On the other hand using LSQ we were able to refine the initial guess for the parameters provided by GA ISBN: 978-1-61804-253-8
1.2%
1%
Error
0.8%
0.6%
0.4%
0.2%
0%
1.06
Fig. 2. Results of calibration for pair GA and LSQ in terms of average absolute relative errors.
36
Applied Numerical Mathematics and Scientific Computation
C ALIBRATION
RESULTS FOR
Algorithm GA GA GA ASA ASA ASA LSQ* GA+Excel GA+Excel GA+Excel ASA+Excel ASA+Excel ASA+Excel GA+LSQ GA+LSQ GA+LSQ ASA+LSQ ASA+LSQ ASA+LSQ
TABLE I M ARCH 19, 2013.* INITIAL GUESSES OBTAINED BY DETERMINISTIC GRID .
Weight
AARE
MARE
v0
κ
θ
σ
ρ
A B C A B C B A B C A B C A B C A B C
1.25% 2.10% 1.70% 2.26% 2.62% 1.73% 0.58% 1.25% 1.25% 1.25% 1.73% 1.78% 1.73% 0.67% 0.65% 0.68% 1.73% 1.71% 1.73%
12.46% 13.80% 18.35% 19.51% 28.65% 19.82% 3.10% 12.46% 12.46% 12.66% 19.82% 18.18% 19.82% 3.07% 2.22% 3.66% 19.82% 19.48% 19.82%
0.02897 0.03073 0.03300 0.03876 0.03721 0.03550 0.02382 0.02897 0.02896 0.02903 0.03550 0.03439 0.03550 0.02491 0.02497 0.02486 0.03550 0.03511 0.03550
0.68921 0.06405 0.83930 0.80811 1.45765 1.22482 1.75680 0.68922 0.68921 0.68932 1.22482 1.22399 1.22482 0.82270 1.22136 0.75195 1.22482 1.22672 1.22482
0.10313 0.94533 0.10826 0.13781 0.09663 0.09508 0.04953 0.10314 0.10314 0.10294 0.09509 0.09740 0.09509 0.07597 0.06442 0.07886 0.09508 0.09636 0.09508
0.79492 0.91248 1.14674 1.63697 1.86941 1.44249 0.42134 0.79490 0.79492 0.79464 1.44248 1.43711 1.44248 0.48665 0.55993 0.46936 1.44249 1.44194 1.44249
-0.53769 -0.53915 -0.49923 -0.46680 -0.37053 -0.49063 -0.84493 -0.53769 -0.53769 -0.53763 -0.49062 -0.49115 -0.49062 -0.67099 -0.66255 -0.67266 -0.49063 -0.49089 -0.49063
we consider H ∈ (0.5, 1]. Moreover, if ε > 0 then BtH is a semi-martingale [24]. Hence, the Itˆo stochastic calculus can be used when deriving an explicit model price for European options. dBt corresponds to the following integral which was defined for arbitrary stochastic process with bounded variation (Ft )t≥0 by Nguyen & Thao [23]
IV. M ODEL WITH APPROXIMATIVE FRACTIONAL STOCHASTIC VOLATILITY
In this section we introduce a jump-diffusion model of market dynamics with approximative fractional volatility. We show that the option pricing problem under this model attains a semi-closed form solution and previously mentioned optimization procedures can be used for the calibration task.
Zt
Zt Fs dBs := Ft Bt −
A. Model introduction
0
We consider a model, firstly proposed by Intarasit and Sattayatham [10], that takes the following form under a riskneutral measure dSt dvt
√ = rSt dt + vt St dWtS + Yt St− dNt , = −κ(vt − v¯)dt + ξvt dBtH ,
Bs dFs − [F, B]t ,
(14)
0
provided the right-hand side integral exists in a RiemannStieltjes sense, while [F, B]t being a quadratic variation of Ft Bt . Under this setup we are able to rewrite the original system of stochastic differential equations into
(11) (12)
dSt dvt
where κ, v¯, ξ are model parameters, such that, κ is a meanreversion rate, v¯ stands for an average volatility level and finally, ξ is so-called volatility of volatility. Under the notation St− we understand lims→t− Ss and (Nt )t≥0 , (WtS )t≥0 is a Poisson process and a standard Wiener process respectively. Yt denotes an amplitude of a jump at t (conditional on occurrence of the jump).
√ = rSt dt + vt St dWtS + Yt St− dNt , = αdt + βdWtv ,
(15) (16)
with the drift process α := α(St , vt ,t ) = (aξϕt − κ)vt + θ and diffusion β := β(St , vt ,t ) = ξvt εa , where a := H − 1/2, θ := κ¯ v is a constant and ϕt represents an Itˆo integral, Z t ϕt = (t − s + ε)H−3/2 dWsϕ (17) 0
A stochastic process BtH
(BtH )t≥0
Zt =
alongside standard Wiener processes (Wtv )t≥0 , (Wtϕ )t≥0 . We add an instantaneous correlation E[dWtS dWtv ] = ρdt to mimic the stock-volatility leverage effect and we also consider a jump process with log-normally distributed jump sizes. Jump times are due to Poisson process (Nt )t≥0 with parameter λ. To simplify the pricing problem, Yt dNt is set to be stochastically independent on processes driving SDE’s (15)-(16).
can be formally defined as
(t − s + ε)H−1/2 dWs ,
(13)
0
where H is a long-memory parameter, ε is a non-negative approximation factor [10] and, as previously, (Wt )t≥0 represents a standard Wiener process. Thao [22] showed that for ε → 0, (BtH )ε converges uniformly to a non-Markov process and H in that case coincides with the well-known Hurst parameter ranging in [0, 1]. For financial applications we are interested in a long-range dependence of volatility, therefore ISBN: 978-1-61804-253-8
The above described setting is referred to as the FSV model throughout this text. In the calibration problem (5) for the FSV model, the vector of parameters to be optimized will be Θ = 37
Applied Numerical Mathematics and Scientific Computation
(v0 , κ, v¯, ξ, ρ, λ, αJ , γJ , H). Their meaning is summarized in TABLE II. − TABLE II L IST OF FSV MODEL PARAMETERS . v0 initial volatility
κ mean reversion rate
v¯ average volatility
ξ volatility of volatility
ρ correlation coef.
λ Poisson hazard rate
αJ expected jump size
γJ variance of jump sizes
H Hurst parameter
� � ∂P2 1 ∂ 2 P2 1 ∂P2 ∂ 2 P2 + vt + r − v + ρβvt t 2 ∂τ 2 ∂xt 2 ∂xt ∂vt ∂xt 2 ∂P2 1 ∂ P 2 +α = 0. + vt β 2 2 2 ∂vt ∂vt (24)
Using arguments in [17], [20] and a discounted version of the Feynman-Kac theorem, characteristic functions (20) satisfy the previous equations and thus we can substitute fn , n = 1, 2 into (23), (24) respectively. Combining α = (aξϕt − κ)vt + θ alongside equations expressed in terms of (20), we arrive at the modified initial value problem
B. Semi-closed form solution In what follows, we present a semi-closed form solution to the pricing problem for European options. The solution is about to be derived for pure-diffusion dynamics first, then the jump part is considered.
1 1 ∂D1 = ρβiφD1 − φ2 + β 2 D12 + ∂τ 2 2 + (aξϕt − κ + ρβ) D1 ; 1 1 ∂D2 = ρβiφD2 − φ2 + β 2 D22 − ∂τ 2 2
We focus on a European call option expiring at time T with pay-off (ST − K)+ where K is a strike price of the contract. The modeled price V should equal to a discounted expected pay-off under a risk-neutral measure, � � V (τ, K) = e−rτ E (ST − K)+
Cn (0, φ) = Dn (0, φ) = 0.
(28)
Proposition 1. The characteristic functions of the logarithmic stock price fn = fn (τ, φ) under the FSV model take the form fn = exp {Cn (τ, φ) + Dn (τ, φ)v0 + iφ ln(St ) + ψ(φ)τ } with � � 2θ 1 − gn edn τ Cn (τ, φ) = rφiτ + θYn τ − 2 ln , β 1 − gn � � 1 − edn τ , Dn (τ, φ) = Yn 1 − gn edn τ � � � � 2 2 2 ψ = −λiφ eαJ +γJ /2 − 1 + λ eiφαJ −φ γJ /2 − 1
where