2010 International Conference on Advances in Social Networks Analysis and Mining
Comparison of feature-based criminal network detection models with k-core and n-clique Fatih OZGUL
Zeki ERDEM
Department of Computing, Engineering and Technology Informatics Centre, University of Sunderland St.Peters Way Sunderland GB SR6 0DD
[email protected]
TUBITAK UEKAE Information Technologies Institute Gebze, Kocaeli, Turkey
[email protected]
Chris BOWERMAN
Claus ATZENBECK
Department of Computing, Engineering and Technology Informatics Centre, University of Sunderland St.Peters Way Sunderland GB SR6 0DD
[email protected]
Faculty of Media Engineering and Technology German University in Cairo New Cairo City, Cairo, Egypt
[email protected] In social network analysis [8], an n-clique in a graph is a subgraph where the distance between any two nodes is no greater than n. Another approach to cohesive subgroups is the k-core. A k-core in a graph is a subgraph where each node is adjacent to at least a minimum number, k, of the other nodes in the subgraph. The k-core specifies the required number of nodes that must be present from each node to others within the subgraph, so the k-core is thus defined in terms of the minimum degree within a subgraph, or the minimum number adjacencies that must be present [8]. Experiments for comparison are done with R [11] using RODBC [12], graph [13], RBGL [14], and sna [15] packages. For GDM, and OGDM police arrest records are used. For SoDM, offender demographics data is used. For ComDM, both police arrest records and offender demographics data are used. For n-clique and k-core algorithms association information (e.g. worked together) information is used. Models and algorithms are tested on two datasets (Bursa 85, Diyarbakir 40 criminal networks). Detection results for Bursa Criminal Networks (BCN) and Diyarbakir Drug Networks (DDN) are presented in the following table;
Abstract—Four group detection models (e.g. GDM, OGDM, SoDM and ComDM) are developed based on crime data features. These detection models are compared more common baseline SNA group detection algorithms. It is intended to find out, whether these four crime data specific group detection models can perform better than widely used k-core and n-clique algorithms. Two data sets which contain previously known criminal networks are used as testbeds. Keywords; criminal networks; detection, k-core, n-clique
In many scientific disciplines, many models and algorithms are proposed to discover community patterns in graph data. The goal of group detection is to cluster the nodes in the graph into groups that share common characteristics [2]. In other words, it tries to find clusters of associated entities given information about the connections between those entities [1]. In its usual context, group detection refers to the discovery of underlying organizational structure that relates selected individuals with each other [3]. The police agencies have historical crime records of most of criminals, and those crime data contain useful features of crimes and demographics information which can also be used for detection of criminals. To benefit most from these crime data, in our recent studies, we have focused on using crime data provided by the police agency to detect criminal networks [4,5,6,7]. We developed four group detection models for detection of criminal networks (GDM, OGDM, SoDM, and ComDM) by using crime data features (e.g. crime location, crime date, modus operandi, criminals’ surname and criminals’ hometown). These group detection models are built on a linked-similarity approach, which is based on crime data feature based linking and maximum similarity clustering.
TABLE I.
BCN Terrorist Networks BCN Mafia networks BCN Theft Networks DDN Drug Dealing Networks AVERAGE VALUE
In this paper, we want to find out the comparison of widely accepted SNA group detection algorithms of n-clique and kcore against our criminal network detection models which are GDM, OGDM, SoDM and ComDM for mafia, drug dealing, terrorist, and theft networks.
978-0-7695-4138-9/10 $26.00 © 2010 IEEE DOI 10.1109/ASONAM.2010.45
CRIMINAL NETWORK DETECTION PERFORMANCE RESULTS Members
GDM
OGDM
SoDM
ComDM
n-clique
k-core
13.7
10.6
5.3
5.4
12.4
5.3
4.8
13.2
11.07
8.3
0
12.23
8.23
4.38
4.42
4.11
4
0.04
4.24
4.26
3.08
12.57
6.95
3.37
1.22
3.32
4.55
4.42
10.97
8.18
5.24
1.66
8.04
5.58
4.17
For eight terrorist networks in BCN (average number of member is 13.7), GDM detected 10.6 members, OGDM detected 5.3 members, SoDM detected 5.4 members, ComDM 400
detected 12.4 whereas n-clique detected 5.3 members and kclique detected 4.8 in average. Best performances of models for terrorist networks in a row are ComDM, GDM, SoDM, OGDM, n-clique, and k-cores.
algorithms n-clique and k-core. Our four models use relational data, making inner-join queries for producing links between entities, deciding maximum likelihood similarities using a scoring function, adopting a cut-off point for less likely links [9], and finally gathering links and entities as disconnected sub graphs using connected components algorithm [10]. Overall; ComDM, GDM, and OGDM performed well, SNA group detection algorithm n-clique did also well but one of our models SoDM and another SNA group detection algorithm kcore didn’t perform well. Our three out of four crime data specific group detection models performed better than n-clique and k-core algorithms.
For thirteen mafia type organized crime networks in BCN (average number of member is 13.2), GDM detected 11.07 members, OGDM detected 8.3 members, SoDM couldn’t detect any members, ComDM detected 12.23 whereas n-clique detected 8.23 members and k-clique detected 4.38 in average. Best performances of models for organized crime networks are ComDM, GDM, OGDM, n-clique, k-core, and SoDM. For sixteen theft networks in BCN (average number of member is 4.42), GDM detected 4.11 members, OGDM detected 4 members, SoDM detected 0.04 members, ComDM detected 4.24 whereas n-clique detected 4.26 members and kclique detected 3.08 in average. Best performances of models for theft networks are n-clique, ComDM, GDM, OGDM, kcores, and SoDM.
REFERENCES [1]
[2] [3]
For forty drug dealing crime networks in DDN (average number of member is 12.57), GDM detected 6.95 members, OGDM detected 3.37 members, SoDM detected 1.22 members, ComDM detected 3.32 whereas n-clique detected 4.55 members and k-clique detected 4.42 in average. Best performances of models for drug dealing networks are GDM, n-clique, k-core, OGDM, ComDM, and SoDM.
[4]
[5]
[6]
[7]
[8]
[9] [10]
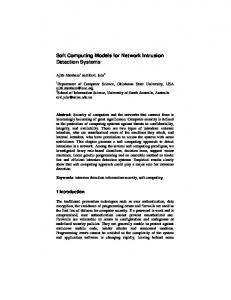
Figure.1
[11]
As exhibited in figure, it is apparent for BCN terrorist networks that ComDM and then GDM performed the best for detection. For terrorist networks; OGDM, SoDM, n-clique and k-core performed similairly average. Detection performance for mafia networks did the same as terrorist network detection results. For theft networks, except for SoDM, all models performed avarage detection results. For drug dealing networks in Diyarbakir dataset, GDM performed the best, then n-clique, and k-core performed well for detection. OGDM, SoDM and ComDM didn’t perform well. In general the most successful performing group detection models are stated in order as ComDM, GDM, OGDM, n-clique, k-core, and SoDM for criminal network detection. In conclusion, our four crime feature-based criminal network detection models are compared to two common SNA detection
[12] [13] [14]
[15]
401
J. Wan, M. Moy, T. Darr, T. Coffman, J. Snyder, M. Hollinger, and B. Thomason, “Key Elements of an Evidence Detection System”, AAAI Fall Symposium on Capturing and Using Patterns for Evidence Detection, pp. 62-67, Oct 13-15, 2006. L.Getoor, L., Diehl, C. P., “Link Mining: A Survey”, SIGKDD Explorations, Vol. 7, No. 2. pp. 3-12, December 2005. S.M. Marcus, M. Moy, T. Coffman, “Social Network Analysis” in Mining Graph Data, D.J. Cook, L.B. Holder, L.B. (Eds.), John Wiley &Sons, Inc. 2007. F. Ozgul, J. Bondy, and H. Aksoy. Mining for offender group detection and story of a police operation. in Sixth Australasian Data Mining Conference (AusDM 2007). Gold Coast, Australia: Australian Computer Society Conferences in Research and Practice in Information Technology (CRPIT), 2007. F. Ozgul, Z. Erdem, H. Aksoy, “Comparing Two Models for Terrorist Group Detection: GDM or OGDM?”, LNCS, 2008, 5075 (PAISI 2008): p. 149–160 2008. F. Ozgul, Z. Erdem, C. Bowerman, “Two Models for Semi-Supervised Terrorist Group Detection” in Mathematical Methods in Counterterrorism, Memon, N.; Farley, J.D.; Hicks, D.L.; Rosenorn, T. (Eds.), Springer Vienna, 2009. F. Ozgul, Z. Erdem, C. Bowerman, Julian Bondy, “Combined Detection Model for Criminal Network Detection”, Pacific Asia Workshop on Intelligence and Security Informatics (PAISI 2010), June 21, 2010, Hyderabad, India 2010. S. Wasserman, K. Faust,: Social Network Analysis Methods and Applications. Structural Analysis in the Social Sciences Cambridge University Press, 1994 T.H. Cormen,C.E. Leiserson,R.L. Rivest, and C. Stein, Introduction to Algorithms. Second Edition, 2001. M. Kantardzic, Data Mining: Concepts, Models, Methods, and Algorithms. New York, US: John Wiley & Sons 2003. R Development Core Team, R: A language and environment for statistical computing. R Foundation for Statistical Computing, Vienna, Austria. ISBN 3-900051-07-0, URL [http://www.R-project.org],2010. RODBC, M. Lapsley, B. Ripley, ODBC Connectivity by Brian Ripley, Department of Statistics, University of Oxford, July 16, 2009. graph: A package to handle graph data structures, R package ‘graph’ version 1.22.2, 2010. RBGL: R interface to boost graph library L. Long, VJ Carey, and R. Gentleman, The Boost Graph Library, URL: [ www.boost.org/libs/graph/doc/index.html],2010. Sna, Tools for Social Network Analysis, Version 2.0-1,created on 200906-07, copyright (c) 2005, Carter T. Butts, University of CaliforniaIrvine, 2009.