Construction Research Congress 2012 © ASCE 2012
Comparison of Image-Based and Time-of-Flight-Based Technologies for 3D Reconstruction of Infrastructure Fei Dai1, Abbas Rashidi2, Ioannis Brilakis3, and Patricio Vela4 1
Postdoctoral Research Fellow, School of Civil and Environmental Engineering, Georgia Institute of Technology, 130 Hinman Research Building, 723 Cherry Street NW, Atlanta, GA 30332. Email:
[email protected] 2 PhD Student, School of Civil and Environmental Engineering, Georgia Institute of Technology, 130 Hinman Research Building, 723 Cherry Street NW, Atlanta, GA 30332. Email:
[email protected] 3 Assistant Professor, School of Civil and Environmental Engineering, Georgia Institute of Technology, 328 Sustainable Education Building, 788 Atlantic Drive NW, Atlanta, GA 30332. Email:
[email protected] 4 Associate Professor, School of Electrical and Computer Engineering, Georgia Institute of Technology, TSRB 441/Van Leer 368, Mail Code 0250, Atlanta, GA 30332. Email:
[email protected] ABSTRACT Image-based (i.e., photo/videogrammetry) and time-of-flight-based (i.e., laser scanning) technologies are typically used to collect spatial data of infrastructure. In order to help architecture, engineering, and construction (AEC) industries make costeffective decisions in selecting between these two technologies with respect to their settings, this paper makes an attempt to measure the accuracy, quality, time efficiency, and cost of applying image-based and time-of-flight-based technologies to conduct as-built 3D reconstruction of infrastructure. In this paper, a novel comparison method is proposed, and preliminary experiments are conducted. The results reveal that if the accuracy and quality level desired for a particular application is not high (i.e., error < 10 cm, and completeness rate > 80%), image-based technologies constitute a good alternative for time-of-flight-based technologies and significantly reduce the time and cost needed for collecting the data on site. INTRODUCTION Image-based (i.e., photo/videogrammetry) and time-of-flight-based (i.e., laser scanning) technologies are typically used to collect 3D spatial data of infrastructure. The collected data is useful for architects/designers, engineers, contractors, and owners in the Architecture, Engineering, and Construction (AEC) industry to manage their operations, control/verify quality issues of infrastructure, identify deviations between as-built and as-designed structures, design layout more efficiently, monitor projects’ progress in a more proactive manner, and assess damage caused by disasters (Brilakis et al., 2011; Dai and Lu, 2010; Golparvar-Fard et al., 2009; Bosche et al., 2009; Jaselskis et al., 2005). When utilizing the data in practice, different applications usually demand different levels of accuracy and quality. Thus, the data collection methods should be carefully selected in order to achieve the desired accuracy and
929
Construction Research Congress 2012 © ASCE 2012
quality level while minimizing the cost for a particular application. Several research efforts have been made to measure the performance of image- and time-of-flightbased technologies. However, a systematic comparison has yet to be conducted. This paper makes an attempt to measure the accuracy, quality, time efficiency, and cost of applying image- and time-of-flight-based technologies to conduct as-built 3D reconstruction of infrastructure. The final goal is to provide the AEC industry with a guide for cost-effective selection between image- and time-of-flight technologies with respect to equipment settings in sensing as-built spatial data of infrastructure. BACKGROUND 3D reconstruction is the process of capturing the shape and structure (i.e., spatial coordinates) of an object in the form of a point cloud. It can be used for visualization and measurement in many AEC applications. Typically, time-of-flightbased laser scanners (e.g., Jaselskis et al. 2005; Bosche et al. 2009; Tang et al. 2009) are utilized to sense as-built spatial data of infrastructure. They operate by emitting a pulse of laser light to a target, and finding the distance to the target from the round trip time of the pulse of light. High-definition (dense) and accurate point clouds can be achieved, and very little training is required for the surveyors. However, this technology typically suffers from high equipment costs, leading to its infeasibility for small projects, where the projected savings hardly justify employing such a device. Also, time needed for on-site data scanning is another issue that needs to be considered for applying this technology. Image-based 3D reconstruction technology is an alternative option to acquire spatial data of infrastructure. Its basic principle is triangulation, whereby the target point in space is reconstructed from two mathematically converging lines from 2D locations of a target point in different images. The image-based technology can be divided into two categories: photogrammetry and videogrammetry. Photogrammetry measures real world objects in images, whereas videogrammetry conducts measurements of objects in videos. Examples include Nistér (2004), Golparvar-Fard et al. (2009), Pollefeys et al. (2008), Brilakis et al. (2011), and Rashidi et al. (2011). The advantages of this technology are that it is automatic, requires lower equipment costs, and acquires data faster on-site. However, it has the downsides of lower level of accuracy and its novelty when compared to existing surveying technology. Comparisons of image-based and time-of-flight-based technologies are of interest to both research and industry. Zhu and Brilakis (2009) compared photo/videogrammetry, active optic triangulation, and laser scanning techniques based on civil infrastructure application requirements. Spatial accuracy, automation of acquisition, and portability of devices are evaluated in their research. However, the evaluation is conducted in qualitative fashion. Golparvar-Fard et al. (2011) evaluated image-based modeling and laser scanning accuracy using a masonry block and a site column as samples. Quantitative comparison was conducted in terms of cost, level of automation, accuracy, and ease of use. However, the accuracy metric was tested at very close ranges (less than 10 m) and factors such as distance, resolution, and type of camera model that affect the resulting accuracy are not fully investigated in their research. On the industrial side, Adam Technology (2008) evaluated laser scanning and photogrammetry for mining environments. They conclude that photogrammetry
930
Construction Research Congress 2012 © ASCE 2012
is more accurate by testing Riegl LMS Z420i and Nikon D2x+180mm lens, but the settings are configured for distances beyond 600 m that are too long for infrastructure applications. Boehler and Marbs (2003) investigated the accuracy of diversified laser scanners, and concluded Leica scanners outperform others. However, the evaluation was only conducted in indoor environments where the temperature and atmosphere was not considered in their comparison. Moreover, the evaluation of image-based technology is not included in their report due to prematurity of this technology at that time. PROBLEM STATEMENT AND RESEARCH OBJECTIVE Previous research does not include video-based techniques in their comparison. The quality of point clouds produced by either photo/videogrammetry or laser scanning also is not measured. Moreover, laser scanners applied in outdoor environments are not meticulously studied with respect to different distances, temperatures, and pressures. In practice, different camera models, resolutions, focal lengths, and data capturing distances lead to different levels of accuracy and quality of the photo/videogrammetric results. There is a lack of systematic comparisons between image/video-based and time-of-flight-based technologies to provide information that can help engineers make cost-effective decisions in selecting between laser scanner and photo/videogrammetry solutions, as well as their settings for sensing the spatial data of infrastructure. The objective of this paper is to measure the accuracy, quality, time efficiency, and cost of applying image- and time-of-flight-based technologies to conduct as-built 3D reconstruction of infrastructure. State-of-the-art image-based 3D reconstruction software and a commercially available time-of-flight-based laser scanner will be utilized to compare the two technologies under varied settings. The final goal is to provide the AEC industry with a guide for cost-effective selection between image- (i.e., photo/videogrammetry) and time-of-flight (i.e., laser scanner) technologies with respect to their settings in collecting as-built spatial data of infrastructure. METHODOLOGY The proposed method will follow the procedures set forth in Fig. 1. First, cutting-edge image-based 3D reconstruction software, multiple cameras, and a timeof-flight-based laser scanner, that are best for infrastructure scenes, will be selected. These representative software and hardware will be used to evaluate two technologies in terms of accuracy, quality, time efficiency, and cost. To this end, a typical infrastructure scene will be selected, and a total station will be used to collect the spatial coordinates of feature points (e.g., corners) on the surface of this infrastructure (a concrete bridge in this study). Since total stations survey infrastructure only with an error of 2-3 mm (standard deviation) within 100 m, data collected by total stations can be deemed accurate enough as ground truth. Based on the feature points, a surface model of the bridge will be created for the evaluation of the selected methods. Different camera models, resolution configurations, focal lengths, and data collection distances will lead to different levels of accuracy and quality for the photo/videogrammetric results, while laser scanners are principally affected by
931
Construction Research Congress 2012 © ASCE 2012
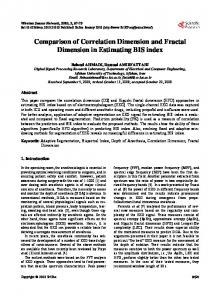
distances, resolution settings, temperature, and atmospheric pressure. Thus, a specific combination of these variables will be prepared to produce different data sets for testing using photo/videogrammetry and laser scanning respectively. By separately registering each data set onto the ground truth model, the accuracy in terms of the deviations of the testing points from their actual ground truth model surfaces, and the quality in regard to the completeness of the testing point set can be consequently measured. For both technologies, the time for raw data collection in the field and processing time at the office will be recorded, and cost will be estimated in terms of dollar value. Finally, the measured results will be summarized as actionable information to help engineers make cost-effective decisions such that not only the accuracy and quality required for their applications are met but also that the time and money spent are minimized.
Fig. 1: Overview of workflow Software & Hardware Selection: Selection of photo/videogrammetric software and laser scanner will follow the criteria that they are publically or commercially available to the industries, and can obtain best accuracy for infrastructure scenes. The candidates of photogrammetry software will be Bundler (Snavely, 2010) + PMVS (Patch-based Multi-view Stereo) (Furukawa and Ponce, 2010), Photo Fly (Autodesk, 2011), and PhotoSynth (Microsoft, 2011). The authors have developed a novel monocular videogrammetric package tailor-made for dense point cloud generation of infrastructure. This package will be used for the evaluation of videogrammetry. According to Boehler and Marbs (2003), Leica scanners obtain best accuracy. Thus, the latest model of Leica ScanStation C10 will be utilized in this research. Ground Truth Data Collection: A total station (i.e., SOKKIA 30R) will be used to collect data of the selected infrastructure. The accuracy level of a total station is 2~3 mm at the range of 100 m. So the data collected by it can be used as ground truth. Corners and feature points that can denote the profile of the infrastructure will be collected in terms of 3D coordinates. These points will be sufficient enough so that they can be rendered into a water-tight surface model using the Poisson Surface Reconstruction algorithm (Kazhdan et al. 2006), ready for the evaluation of photo/videogrammetry and laser scanner. Evaluation of Accuracy: The variables considered will be cameras models, resolutions, focal lengths, distances, temperatures, and atmospheric pressures. Selection of camera models will basically follow the criterion that cameras are offthe-shelf or professional categories. Settings of resolutions will be configured based on the available range of a camera (e.g., for Canon EOS Rebel T3i, 2~18 megapixels). Wide angle, standard, and telephoto lenses will be utilized. Distance ranges will be defined from 5~100 m, reasonable for infrastructure scenes. Typical
932
Construction Research Congress 2012 © ASCE 2012
933
temperatures and atmosphere pressures in summer and winter will be chosen to collect data at different environmental conditions. To evaluate the accuracy, each set of point clouds produced by the two technologies will be registered into the coordinate frame of the ground truth model, using the Horn’s absolute orientation method (Horn 1987). Within the same frame, Euclidian distance (error) between a point from the point cloud and the surface of the ground truth model where this point is supposed to be located is measured. This distance will be considered as the metric to measure the accuracy (illustrated in Fig. 2), grounded on the fact inaccurate radial lens distortion parameters in image-based methods lead to systematic error primarily along the depth direction. The ith point’s coordinate is denoted as ( X i j , Yi j , Zi j ) . It is supposed to lie on the jth surface of the ground truth bridge model, as a j X + b jY + c j Z + d j = 0 . The average error of the point cloud can be accordingly calculated by err =
n
n
∑m
mj
∑∑
1 j
j =1 i =1
a j X i j + b jYi j + c j Z i j + d j a j2 + b j2 + c j2
(1)
j =1
In Eq. (1), mj is the number of points supposed to belong to the jth surface, and n is the number of the surfaces. Note, if a point’s distance to the surface is far beyond the average value, it will be deemed as an outlier and removed from the testing data set.
Fig. 2: The point P is supposed to locate on the surface s of the ground truth model, but due to imperfection of the point cloud, there is a distance d between P and s. d is deemed as error of this point. This research will also evaluate the edge accuracy of the point clouds. To do so, an offset will be made on both sides of an edge along the surface of the ground truth model to form a close loop region (Fig. 3a). By extruding this region into the space (Fig. 3b), points that are covered by the frustum are accordingly regarded to belong to the edge. Eq. (1) is then applied on these points to calculate the edge accuracy. All edges will be examined to obtain an average estimate of the accuracy.
Construction Research Congress 2012 © ASCE 2012
934
b)
Ground Truth Model
Frustum
Fig. 3: a) an offset Δ (exaggerated for illustration) is made on both sides of the edge l to form a region marked with dash lines, and b) a frustum is generated by extruding the region along the axis orthogonal to the surface. Evaluation of Quality: The quality of a point cloud will be examined with respect to its completeness. To achieve this, the surfaces of the ground truth model will be partitioned into small square regions (1×1 cm in this study). The existence (or not) and density of points will be examined for each one of these regions. The outcome will be a percentage of the coverage and a density distribution of the points. The percentage of the coverage is calculated by m/n, where m is the number of regions covered by any points and n is the total number of the regions. The density distribution of the points is determined by counting the number of points for each one of the regions and then fitting the distribution using the numbers. Time & Cost Estimation: The manpower time for collecting on-site data and postprocessing the data at office will be recorded. These times will then be measured in terms of labor cost for the image-based and time-of-flight-based technology. Additionally, costs of actually purchasing or renting the devices will be considered (e.g., a typical inter-state bridge laser scanning by rental is $4000 including 4~5 hour on-site data collection and 1~2 hour office data processing). Guide Preparation: The major undertaking will be analysis and organization of the results to guide AEC surveying related applications. Metadata will be created to describe how the analyzed data is organized. Analyzed data in this research is the data that constitutes the guide including images, tables, figures, and interpretations of these images, tables, and figures. Suggestions will also be made for typical application scenarios. EXPERIMENT AND RESULTS Preliminary experiments have been conducted to compare the performance of image- and time-of-flight methods at the data collection range of 25 m, and evaluate the accuracy and quality of videogrammetric methods based on the metrics of (1) type of cameras, (2) resolution configurations, and (3) data collection ranges. An interstate concrete bridge was selected as the test-bed. It is four-span, three rows, and each row contains three rectangular columns (Fig. 4a). A calibrated consumer-grade Canon Vixia HF S100 camera was used to capture the image data of this bridge. This Canon camera together with an industrial Point Grey Flea-2 camera was also used to collect the video stream. The resolution of these cameras was set at 2 MP. As a result, a set of 130 images and two lengths of 5 min video were collected for comparison. As to the laser scan data collection, six scans were made on a sunny day (temperature measured around 30°C), among which two were conducted under the bridge, and the
Construction Research Congress 2012 © ASCE 2012
935
other four were from both sides at distance around 25 m. Then, these raw images, video, and laser scan data were processed using the representative software respectively, and the results are 3D point clouds of this bridge as shown in Fig. 4b-f. Note, the software running is benchmarked on Intel Core i7 CPU with 4GBs RAM on a 32bit Windows platform, except for Photo Fly and PhotoSynth, which process the images from the hosts’ own remote servers.
(a) The Bridge Image
(b) 3D Data from Bundler+PMVS
(c) 3D Data from Photo Fly
(d) 3D Data from PhotoSynth
(e) 3D Data from Videogrammetry
(f) 3D Data from Laser Scanning
Fig. 4: Snapshots of 3D point clouds collected by different methods The ground truth model (Fig. 5a) was constructed from around 2000 points spreading the surface of the bridge captured by the total station. By manually picking the reference points on the bridge, the point cloud by each method was thereby registered into the coordinate frame where the ground truth model locates. Fig. 5b shows a snapshot of a registered point cloud on the ground truth model of the bridge.
(a) Ground Truth Model of the Bridge
(b) Point Cloud Registered on the Ground Truth Model
Fig. 5: Point Cloud Registration Table 1 shows the accuracy and completeness of different image- and time-offlight-based methods. Based on Table 1, the accuracy level of laser scanning is about 10 times as high as that of photo/videogrammetry, and the completeness level is 20% higher than that of photo/videogrammetry. That the completeness rate of PhotoSynth is low is because the point cloud generated by this method is sparse. Also, we observe
Construction Research Congress 2012 © ASCE 2012
936
videogrammetry obtained highest accuracy among the image-based methods. We see the reason is that the calibration results (i.e., intrinsic and lens distortion parameters) are utilized for the computation of its results. Table 1: Accuracy and completeness of different methods measured at distance 25 m Method Avg. Error (cm) Avg. Completeness (%) Photogrammetry - Bundler+PMVS 7.21 73 Photogrammetry - PhotoSynth 12.04 24 Photogrammetry - Photo Fly 13.74 67 Videogrammetry - Canon Vixia 6.60 79 Videogrammetry - Point Grey 6.33 78 Laser Scanning - Leica C10 90 Table 2 shows the time and cost spent for collecting spatial data by different methods. It is obvious that image-based methods are time efficient for the on-site data collection. As for processing the data at office, the time was counted based on these particular data sets provided, which were utilized as the first step for evaluating the performance of image- and time-of-flight-based methods. Admittedly, as the image number increases, the time for both collecting on-site data and processing videos and images at office will increase. Yet, it is still plausible for the image-based methods, observing the trend that the total cost will not significantly increase since it is mainly accounted for by the equipment costs. Table 2: Time and cost estimation of different methods Time (hr) Cost ($) Method On Site Office Total Equip. Soft. Photogrammetry - Bundler+PMVS 1.0 5.0 6.0 1,000 Free Photogrammetry - PhotoSynth 1.0 0.1 1.1 1,000 Free Photogrammetry - Photo Fly 1.0 4.0 5.0 1,000 Free Videogrammetry - Canon Vixia 0.8 3.0 3.8 1,000 Free Videogrammetry - Point Grey 0.8 3.0 3.8 2,500 Free Laser Scanning - Leica C10 5.0 2.0 7.0 100,000 w/ Equip. Laser Scanning - Leica C10 5.0 2.0 7.0 by rent w/ Equip. Note: Manpower unit price is assumed as 20 $/hr.
Total 1,120 1,022 1,100 1,076 2,576 100,140 4,000
Later, we evaluated the videogrammetric methods under varied settings as summarized in Table 3. Table 3 also shows the measured accuracy and completeness results. Based on Table 3, the average error shows anti-correlation with the level of resolution, i.e., at a certain distance, the higher the resolution, the lower the average error. As expected, there is strong correlation between the average completeness and the level of resolution. When the camera resolution is fixed, we observe the trend that the average error raises while the average completeness decreases with the increase of distance. As to the performance of different cameras, under the same level of resolution 2.0 MP, the average error is reduced slightly (by 6.3%) using photos taken
Construction Research Congress 2012 © ASCE 2012
by Point Grey, and the average completeness seem to increase correspondingly (except for the measurement taken at distance of 25m), but the difference is not significant. Table 3: Accuracy and completeness of videogrammetry under different settings Camera Resolution (MP) Distance (m) Avg. Error (cm) Avg. Completeness (%) Canon Vixia 1.0 25 7.43 75.24 Canon Vixia 1.5 25 6.92 80.11 Canon Vixia 2.0 25 6.60 79.42 Point Grey 2.0 25 6.33 78.42 Canon Vixia 1.0 40 10.11 73.44 Canon Vixia 1.5 40 9.75 76.39 Canon Vixia 2.0 40 9.13 77.21 Point Grey 2.0 40 8.47 80.11 Canon Vixia 1.0 55 11.01 71.11 Canon Vixia 1.5 55 10.27 74.29 Canon Vixia 2.0 55 10.51 77.04 Point Grey 2.0 55 9.72 79.63 CONCLUSION AND ONGOING RESEARCH This paper presented a method to compare the accuracy, quality, time, and cost of applying image- and time-of-flight-based technologies to conduct as-built 3D reconstruction of infrastructure. The goal was to help the AEC industry costeffectively select between the two technologies with respect to equipment settings in performing this task. Preliminary experiments were conducted in this research. We concluded that if the accuracy and quality level desired for a particular application is not high (i.e., error < 10 cm, and completeness rate > 80%), image-based methods constitute a good alternative for time-of-flight-based methods. Nonetheless, more comprehensive experiments need to be designed and conducted based on the proposed method. This will be future extension of the research presented above. ACKNOWLEDGEMENTS This presented research was partially funded by the U.S. National Science Foundation (NSF) under Grant CMMI-1031329 and partially funded by the Georgia Tech Digital Building Lab (DBL). The authors gratefully acknowledge NSF’s and DBL’s support. The authors would also like to acknowledge the support from the Point to Point Land Surveyors, Inc. for its assistance of the bridge laser scan data collection, and Craig Burgess, an undergraduate student at the School of Civil & Environmental Engineering, Georgia Tech, for his help of the bridge ground truth data collection. Any opinions, findings, conclusions, and recommendations expressed in this paper are those of the authors and do not necessarily reflect the views of the NSF, DBL, Point to Point Land Surveyors, Inc., or the individual named above. REFERENCES Adam Tech. (2008). “Laser scanning vs digital photogrammetry.” Technical Report, www.amerisurv.com/PDF/LaserScanningVsPhotogrammetry080108.pdf.
937
Construction Research Congress 2012 © ASCE 2012
Autodesk. (2011). Photo Fly, Code available at: http://labs.autodesk.com/utilities/photo_scene_editor/. Brilakis, I., Fathi, H. and Rashidi, A. (2011). “Progressive 3D reconstruction of infrastructure with videogrammetry.” Autom. Constr., 20(7), 884-895. Boehler, W, and Marbs, A. (2003). “Investigating laser scanner accuracy.” White Paper, http://hds.leicageosystems.com/hds/en/Investigating_Acurracy_Mintz_White_Paper.pdf. Bosche, F, Haas, C., and Akinci, B. (2009). “Performance of a new approach for automated recognition of project 3D CAD model objects in site 3D laser scans.” J. Comput. Civ. Eng., 23(6), 311-318. Dai, F., and Lu, M. (2010). “Assessing the accuracy of applying photogrammetry to take geometric measurements on building products.” J. Constr. Eng. Manage., 136(2), 242-250. Furukawa, Y., and Ponce, J. (2010). “Accurate, dense, and robust multiview stereopsis.” IEEE Trans. Pattern Anal. Mach. Intell., 32(8), 1362-1376. Source code at: http://grail.cs.washington.edu/software/pmvs/. Golparvar-Fard, M., Bohn, J., Teizer, J., Savarese, S., and Peña-Mora, F. (2011). “Evaluation of image-based modeling and laser scanning accuracy for emerging automated performance monitoring techniques.” Autom. Constr., 20(8), 1143-1155. Golparvar-Fard, M., Peña-Mora, F., and Savarese, S. (2009). “Application of D4AR A 4-dimensional augmented reality model for automating construction progress monitoring data collection, processing and communication.” J. Inf. Tech. Constr., 14, 129-153. Horn, K.P.B. (1987). “Closed-form solution of absolute orientation using unit quaternions.” Journal of the Optical Society of America A, 4(4), 629-642. Jaselskis, E.J., Gao, Z., and Walters, R.C. (2005). “Improving transportation projects using laser scanning.” J. Constr. Eng. Manage., 131(3), 377-384. Kazhdan, M., Bolitho, M., and Hoppe, H. (2006). “Poisson, surface reconstruction”. Proc. of the 4th Symposium on Geometry Processing, Sardinia, Italy, 61-70. Microsoft. (2011). Photosynth, Code available at: http://photosynth.net/. Nistér, D. (2004). “Automatic passive recovery of 3D from images and video.” Proc. of the 2nd International Symposium on 3D Data Processing, Visualization & Transmission (3DPVT04), Thessaloniki, Greece, Sep. 2004. Pollefeys, M., Nistér, D., Frahm, J.-M., Akbarzadeh, A., Mordohai, P. Clipp, B., Engels, C., Gallup, D., Kim, S.-J., Merrell, P., Salmi, C., Sinha, S., Talton, B., Wang, L., Yang, Q., Stewénius, H., Yang, R., Welch, G., and Towles, H. (2008). “Detailed real-time urban 3D reconstruction from video.” Int. J. Comput. Vis., 78(2-3), 143-167. Rashidi, A., Fathi, H., and Brilakis, I. (2011). “Innovative stereo vision-based approach to generate dense depth map of transportation infrastructure.” Transportation Research Record (TRR), Journal of the Transportation Research Board, 2215, 93-99. Snavely, N. (2010). “Bundler: Structure from Motion (SfM) for Unordered Image Collections.” Code available at: http://phototour.cs.washington.edu/bundler/.
938
Construction Research Congress 2012 © ASCE 2012
Tang, P., Akinci, B., Huber, D. (2009) “Quantification of edge loss of laser scanned data at spatial discontinuities.” Autom. Constr., 18(8), 1070-1083. Zhu, Z., and Brilakis, I. (2009) "Comparison of civil infrastructure optical-based spatial data acquisition techniques", J. Comput. Civ. Eng., 23(3), 170-177.
939