Article
Rev Bras Cienc Solo 2016;40:e0150164
Division – Soil Processes and Properties | Commission – Soil Physics
Comparison of Methods for Determining Precompression Stress Based on Computational Simulation Anderson Rodrigo da Silva(1) and Renato Paiva de Lima(2)* (1) (2)
* Corresponding author: E-mail:
[email protected] Received: June 24, 2015 Approved: July 25, 2015
How to cite: Silva AR, Lima RP. Comparison of Methods for Determining Precompression Stress Based on Computational Simulation. Rev Bras Cienc Solo. 2016;40:e0150164.
Instituto Federal Goiano, Departamento de Agronomia, Urutai, Goiás, Brasil. Universidade de São Paulo, Departamento de Ciência do Solo, Piracicaba, São Paulo, Brasil.
ABSTRACT: There are many methods for determining precompression stress (σp), whose value is affected by the slope of the soil compression curve. This study was designed to evaluate the hypothesis that for a certain compression curve all methods used to determine σp present the same value and accuracy. The aim of this study was to compare the accuracy and the relationship among seven of these methods by computational simulation of soil compression curves under nine scenarios. The following methods were used: Casagrande, Pacheco Silva, intersection of the initial void ratio with the virgin compression line (VCLzero), and the regression methods based on 2 (reg1), 3 (reg2), 4 (reg3), and 5 (reg4) points for modeling the elastic curve. Under each scenario, created by combining the swelling and the compression indices, 1,000 compression curves were computationally simulated via the Monte Carlo method. Subsequently, 95 % percentile confidence intervals were built using the 1,000 estimates of σp from each method under each scenario. Most of the differences among the methods were detected under scenarios consisting of high swelling and low compression indices. In general, Casagrande, Pacheco Silva, and reg4 were strongly correlated and presented the highest values of σp, as well as similar variability. The latter two can be considered as alternatives to the standard method of Casagrande, except for Pacheco Silva when the curve has a low compression index (≤0.2) and from medium to high swelling index (≥0.025), for which differences (preg2>reg1).
Cs = 0.2
Cs ≈ 0.003
Cs = 0.35
Cs ≈ 0.003
Cs = 0.5
Cs ≈ 0.003
pacheco reg4 reg3 reg2 reg1 VCLzero casagrande 20
40 60 80 100 Precompression stress (σp) Cs = 0.2
Cs ≈ 0.025
40 80 120 160 Precompression stress (σp) Cs = 0.35
60
Cs ≈ 0.025
100 140 180 Precompression stress (σp) Cs = 0.5
Cs ≈ 0.025
pacheco reg4 reg3 reg2 reg1 VCLzero casagrande 20
40 60 80 100 Precompression stress (σp) Cs = 0.2
Cs ≈ 0.055
40 80 120 160 Precompression stress (σp) Cs = 0.35
60
Cs ≈ 0.055
100 140 180 Precompression stress (σp) Cs = 0.5
Cs ≈ 0.055
pacheco reg4 reg3 reg2 reg1 VCLzero casagrande 20
40 60 80 100 Precompression stress (σp)
40 80 120 160 Precompression stress (σp)
60
100 140 180 Precompression stress (σp)
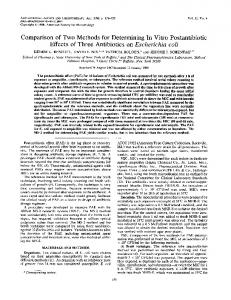
Figure 3. 95 % percentile confidence intervals for the mean of precompression stress (σp) determined by seven methods under nine scenarios designed according to the compression (Cc) and swelling (Cs) indices. Results based on 1,000 simulated soil compression curves.
Rev Bras Cienc Solo 2016;40:e0150164
5
Silva and Lima Comparison of Methods for Determining Precompression Stress Base...
For Cc = 0.35, the Casagrande and reg4 methods also tended to show the highest values of σp. The VCLzero method showed the lowest values, regardless of Cs (Figure 3). The methods of Pacheco, reg3, reg2, and reg1 changed more than the Casagrande and reg4 methods with variation in Cs. As Cs increased, VCzero was the only method that was statistically different (pregression using two points), corroborating the results in table 2. However, Arvidsson and Keller (2004) did not test regression with four and five points (reg3 and reg4 as specified here, respectively), which would probably increase similarity with the Casagrande method, as found here. Cavalieri et al. (2008) showed medium to high correlations between regression methods and Casagrande (Cavalieri et al., 2008), at least higher than those obtained by Arvidsson and Keller (2004). The regression method using 4 and 5 points was correlated with Casagrande, as well as the Pacheco method (Table 2). Similarity between Casagrande and Pacheco in terms of σp also was found by Rosa et al. (2011). Applicability of the methods The Casagrande method has been considered as standard in almost all comparison studies involving soil compressibility. However, its algorithm is relatively complex, since the point of maximum curvature of the compression curve must be determined. Regression methods are considerably simpler since they consist of intercepting two regression lines. However, evaluations of the regression methods, including comparison of their performance with the Casagrande method, can be found in the studies of Dias Júnior and Pierce (1995), Arvidsson and Keller (2004), and Cavalieri et al. (2008).
CONCLUSIONS Most of the differences among the methods were detected under scenarios consisting of high swelling and low compression indices. In general, Casagrande, Pacheco Silva, and reg4 were strongly correlated, showing the largest values of σp, and similar variability. The latter two can be considered as alternatives to the standard Casagrande method, except for Pacheco Silva when the curve has a low compressibility coefficient (≤0.2) and medium to high swelling index (≥0.025), for which differences (p