visual applications that require effective image signature and similarity metrics. ... 1 Introduction. Digital images are easy to manipulate and edit due to the.
Comparison of Near-Duplicate Image Matching Li Chen, F. W. M. Stentiford University College London, Adastral Park Campus, IP5 3RE, UK. {l.chen, f.stentiford}@adastral.ucl.ac.uk
Keywords: Image matching, visual attention, similarity matching
Abstract Near-duplicate image detection requires the matching of slightly altered images to the original and will assist in the detection of forged images. Much effort has been devoted to visual applications that require effective image signature and similarity metrics. This paper presents an attention based similarity measure in which only very weak assumptions are imposed on the nature of the features employed. This approach generates the similarity measure on a trial and error basis and has the significant advantage that matching is based on an unrestricted competition mechanism that is not dependent upon a priori assumption regarding the data. Efforts are expended searching for the best feature for specific region comparisons rather than expecting that a fixed feature set will perform optimally over unknown patterns. In this paper colour and texture-based signatures are extracted to compare the presented method in the context of nearduplicate image matching, and results are reported on the BBC open news archive.
1 Introduction Digital images are easy to manipulate and edit due to the powerful functionality of image processing software [13]. This brings the challenge of matching slightly altered copies to their originals, which is termed “near-duplicate image detection” [2, 5]. Watermarking inserts information into the media prior to distribution, which can be late extracted to establish ownership. However, sufficient fidelity and robustness of effective watermarking algorithms are not yet available. Content based near-duplicate image matching is another complementary method to identify the ownership of images. The primary theme of content based image matching is “the media itself is the watermark”, - the media (video, audio, image) contains enough unique information that can be used for detecting copies [3]. In this regard, considerable effort has been devoted to effective representation of image signatures and similarity matching. This is normally based on the assumption that near-duplicated images will cluster in a pre-defined feature space [12]. Due to the great diversity in a comparatively general image database, there is no guarantee that the selected features will cope with unseen patterns. In this research we present an attention based similarity matching method with application to near-duplicate image
detection based on our previous work on attention based similarity [9, 1]. The approach computes a similarity measure on a trial and error basis. This has the significant advantage that features that determine similarity can match whatever image property is important in a particular region whether it is a colour, texture, shape or a combination of all three. Efforts are expended searching for the best feature for the region rather than expecting that a fixed feature set will perform optimally over unknown patterns in addition to the known patterns. In this context, the proposed image matching method is based on the competitive evolution of matching regions between two images rather than depending on fixed features which are intuitively selected to distinguish images. Colour and texture- based signatures are also extracted and compared to the proposed method with application to nearduplicate image matching. Results are reported on the BBC open news archive with different distortions of images including cropping, resizing, additive Gaussian noise, image shift and contrast change. The remainder of this paper is arranged as follows. In Section 2 different similarity measurements such as the attention based similarity measure, colour histogram intersection and texture based signature matching are described. Experiments are conducted on the BBC open news archive and results are shown in Section 3. Conclusions are addressed in Section 4.
2 Signature extraction and similarity matching 2.1 Visual Attention Similarity Measure Studies in neurobiology [11] suggest that human visual attention is enhanced through a process of competing interactions among neurons representing all of the stimuli present in the visual field. The competition results in the selection of a few points of attention and the suppression of irrelevant material. In this context of visual attention, we argue that humans are able to spot anomalies in a single image or similarity between two images through a competitive comparison mechanism, where dissimilar and similar regions are identified and scored by means of a new similarity measure. The comparison is a flexible and dynamic procedure, which does not depend on a particular feature space which may be thought to exist in a general image database.
Let a measurement a = (a1 , a 2 , a3 ) correspond to a pixel
x = ( x1 , x 2 ) in image A and a function F is defined so that a = F(x). Consider a neighbourhood N of x where N = x ' ∈ N if and only if ( xi − xi' ) ≤ ε i .
{
}
Select a set (called a fork) of m random pixels S x from N where ' S x = { x1' , x 2' ,..., x m }. Select another random pixel y in image B and define the fork Sy ' S y = { y1' , y 2' ,..., y m } where
x − xi' = y − yi' ∀ i .
The fork S x matches S y if
F j ( y i' ) − F j ( xi′ ) ≤ δ j
Step 4: Define a corresponding fork S y ; Step 5: p = p + 1 ; if p > M then go to Step 2 Step 6: If S y matches S x then C AB = C AB + 1 and generate another S x ; loop to Step 4. Step 7: Otherwise loop to Step 3. The total similarity (called Cognitive Visual Attention CVA) score between images A and B is calculated as below which is normalised by the number of trials and pixels in image A: C AB =
∀ i, j .
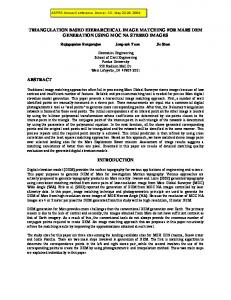
That is, a match occurs if all colour values (suffix j) of corresponding pixels in S x and S y are close. The similarity score of a pixel x is incremented each time one of a set of M neighbourhoods S x matches a neighbourhood S y surrounding some y in pattern B. This means that pixel x in A that corresponds to large numbers of matches between a range of M neighbouring pixel sets S x and pixel neighbourhoods somewhere in B are assigned high scores. In Fig. 1, m = 3 pixels x' are selected in the neighbourhood of a pixel x in pattern A and matched with 3 pixels in the neighbourhood of pixel y in pattern B. Note that pixel x itself does not have to match pixel y. A parameter s is introduced to limit the area in pattern B within which the location y is randomly selected. s = 2 defines the dotted region in Fig. 1. This improves the efficiency of the algorithm in those cases where it is known that corresponding regions in the two images are shifted by no more than s pixels. In effect s represents the maximum expected mis-registration or local distortion between all parts of the two images.
where
1 M* A
∑ ( ∑ (1 | S x∈ A
x
matches S y , 0 | otherwise)
M , y∈B
A is the number of pixels in image A and M is the
number of forks which are generated to centre on x and match image B. The final CVA score is normalised by a self' matching score, i.e., C AB = C AB / C AA , where A is a query image and B is a target from the database.
2.2 Colour-based Signature and Matching Swain and Ballard [10] first introduced colour histogram intersection (HI) as a similarity measure to index images and demonstrated its robustness to many variations including a change in orientation, a shift in viewing position and a change in the scene background, partial occlusion, or slight degradation. A colour histogram simply represents the number of pixels in an image having a particular RGB value. Then, the colour histogram is normalised by dividing by the number of pixels in the histogram. An intersection is applied to the normalised histogram in order to find the similarity between two images as follows. HI = ∑ min(Q (i), T (i )) i
where i is the index of a component in the histogram. Q(.) and T(.) represent the histogram of a query and a target image respectively. y x
Figure 1 Neighbourhood at location x matching at location y The similarity score between image A and B is calculated in the following steps: Step1:
C AB = 0;
Step2: For each pixel x in A, generate a random fork S x ;
p = 0;
Step 3: Select random pixel y in image B;
2.3 Gabor-based Signature and Matching Texture, like colour, is a powerful cue for the analysis of images and it contains important information about the structural arrangement of image content, surfaces and their relationship to the surrounding environment [8]. Since the early 1990s researchers have introduced the wavelet transform and the Gabor filter into texture measurement schemes. The Gabor filters have been demonstrated to be optimal in terms of minimizing the joint two-dimensional uncertainty in space and frequency [6]. The Gabor filters can be considered as orientation and scale-tuneable edge and line detectors, and the statistics of these micro features in a given region are often used to characterize the underlying texture information.
A two-dimensional mother Gabor filter is represented as below [6] 1 1 x2 y 2 exp− g ( x, y) = + + 2 π jwx 2πσ σ 2 σ 2 σ 2 x y y x
The similarity score between two images Q and T is normalised as: d (Q, T ) s (Q, T ) = 1 − max(d (Q, T ' )) '
Gabor functions form a complete but non-orthogonal basis set. where T is an arbitrary image from the database. A set of filters can be obtained by expanding the mother Gabor filter by appropriate dilations and rotations of 3 Experiments g ( x, y ) through the generation function as following. Experiments were carried out on images downloaded from the BBC open news archives [4]. 75 videos (more than 230,000 gmn(x, y) = a−m g x' , y' frames) cover different topics including conflicts and wars, where x' = a−m ( x cosθ + y sinθ ), y' = a −m (−x sinθ + y cosθ ) , θ = nπ , disasters, personalities and leaders, politics, science & k technology, and sports. Since many frames within a scene m = 0, 1, ..., s −1 and n = 0, 1, ..., k −1 . s is the number of differ only slightly, and to utilise the diversity in the database, orientations and k is the number of scales. The following 1392 non-contiguous frames were randomly extracted from functions are used to calculate the parameters used in the the set of every 100th frame in the videos to form the database. above function. The size of the original frames is 352 x 288 pixels. 21 images 1 were randomly chosen as queries from the database and 4 uh s−1 distorting transforms were applied to each image including a= additional Gaussian noise, contrast increase, crop and shift, u l and resize (see Fig. 2(a)-(e) ). These distorted images were where u h and ul denote the lower and upper centre then added to the image database making a total of 1476 frequencies of the Gabor filters. images. Images are considered as near-duplicated copies only if they match the distorted images as well as very similar 2 (a − 1)uh σx = frames that were in the same shot as the query frame. These ln 2 (a + 1)π very similar frames are identified where people could not and recognise the difference between them, for example, the pairs 1 2 2 2 −2 of images in Fig. 3,. In Fig. 3, two images in the first row are 2σ (2 ln 2) σ u 2 π σ y = tan uh − 2 ln u 2 ln 2 − at a 200 frame distance and the second group is at a 100 2 uh 2k uh π frame distance, however, they are nearly identical. Given a gray intensity level of an image I R×C with R×C Fig. 2 shows the relationship of the normalised similarity pixels, its Gabor transform is then defined as scores of the attention based method, the colour histogram R C ∗ intersection, and the Gabor based signature matching on two Wmn ( x, y) = ∑∑ ixr , yc gmn ( x − xr , y − yc ) xr =1 yc =1 groups of original examples and their altered copies. It is illustrated in Fig. 2 (f)-(g) that similarity scores of the nearwhere * indicates the complex conjugate. duplicated copies are most close to the original images based g g The mean µ mn and the standard deviation δ mn of Wmn are on the CVA method, followed by similarity matching of Gabor-based signature and colour histogram intersection. 21 calculated as the feature components in a feature vector source query images are examined and repeat this result. Fgabor . According to our early research [1], with M increased, the trend of similarity score distribution was more obvious. It is R C W mn ( x , y ) interesting that blurred and contrast shifted images seem less ∑ ∑ g µ mn = x = 1 y =1 affected in the CVA similarity matching compared to other R×C alterations. The colour histogram intersection is very sensitive to Gaussian noise and cropping operations. R C
(
g = δ mn
∑∑ (W x =1 y =1
mn
)
g ( x, y ) − µ mn
)
2
R×C
Fgabor = µ , δ , µ , δ 01g ,..., µ sg−1,k −1 , δ sg−1,k −1 g 00
g 00
g 01
The distance between query image Q and target image T is calculated as below. Q T d (Q, T ) = ∑ Fgabor (i ) − Fgabor (i ) i
where i is the index of a component in a Gabor vector.
in the database; precision is the ratio of the number of nearduplicate images retrieved to the total number of irrelevant and relevant images retrieved.
(a)
(b)
(c) (a)
(b) Figure 3 Examples of near-duplicated images (a) Two frames with 200 frame distance (b) Two frames with 100 frame distance
(d)
(e)
The proposed similarity measure takes about 1 second to compare two images in a single thread on a 2.0GHz Pentium 4 computer. The matching of forks can be carried out in parallel as each operation is independent of the others, and could potentially run at video speeds of faster.
(f)
(g)
Figure 2 Normalised similarity score distribution (a) original images (b) with additional radius-1 Gaussian blur (c) with contrast increased 25% (d) cropped and shifted to the right (e) resized to 80% of original image (f) Normalised similarity score distribution of (a)-(e) of the example images in the first group (g) Normalised similarity score distribution of (a)-(e) of the example images in the second group Figure 4 Average recall versus precision on 105 queries
Fig. 4 illustrates the average precision and recall performance on 105 queries of the attention based matching algorithm (M=20) against two other methods: (a) similarity matching based on colour histogram intersection and (b) texture-based signatures. Recall is the ratio of the number of near-duplicate images retrieved to the total number of near-duplicate images
The 105 queries consisted of the 21 randomly chosen images together with their 4 distorted versions. It is noted that although the Gabor-based signature matching method demonstrates a similarity score distribution close to the CVA
based similarity measure in context of near-duplicated images, it obtains worse performance. The reason is that the Gaborbased method is affected by close similarity scores between query images and other dissimilar images.
4
Conclusions
This paper has shown that a new attention based similarity measure that is used to obtain promising near-duplicated image detection performance. The similarity is determined by the amount of matching structure detected in pairs of images. Such structure that is found to be in common between specific pairs of images may not be present elsewhere in the database and would be unlikely to be taken into account by a fixed set of features applied universally. Colour histogram intersection and Gabor based signature matching are introduced to compare to the proposed method. Experiments are conducted on the BBC open news archives, which contain a great diversity in the image database. Results demonstrate that the CVA based similarity measurement achieves the best precision and recall performance, followed by Gabor-based similarity measurement and colour histogram intersection. In the similarity score distribution, copied images are most closely clustered to its original by applying attention based similarity matching compared with Gabor feature signature and colour histogram demonstrating a greater immunity to distortion.
Acknowledgement This research has been conducted within the framework of the European Commission funded Network of Excellence “Multimedia Understanding through Semantics, Computation and Learning” (MUSCLE) [7].
References [1] Li Chen and F. W. M. Stentiford, “An attention based similarity measure for colour images”, proceedings of 16th International Conference on Artificial Neural Networks, Athens, Greece, September 2006, vol. 4132 of LNCS, pp. 481-487, Springer, 2006. [2] J. Fridrich, D. Soukal, and J. Lukas, “Detection of copymove forgery in digital images”, in Digital Forensic Research Workshop, 2003. [3] Arun Hampapur, Rudolf M. Bolle and Ki-Ho Hyun, “Comparison of sequence matching techniques for video copy detection”, Proceedings of SPIE: Storage and Retrieval for Media Databases, 2001. [4] http://creativearchive.bbc.co.uk/ [5] Y. Ke, R. Sukthankar, and L. Huston, “Efficient nearduplicate detection and sub-image retrieval”, MM’04, NY, USA. [6] B. S. Manjunath and W. Y. Ma, “Texture features for browsing and retrieval of image data”, IEEE Transactions on Pattern Analysis and Machine Intelligence, 18(8), pp.837-842, 1996.
[7] Multimedia Understanding through Semantics, Computation and Learning, EC 6th Framework Programme. FP6-507752. (2005) http://www.musclenoe.org/ [8] T. Randen and J. H. Husoy, “Filtering for texture classification: a comparative study”, IEEE Transactions on Pattern Analysis and Machine Intelligence, 21(4), pp.291-310, April 1999. [9] F. W. M. Stentiford, “Attention based similarity”, Pattern Recognition, (2006) in press. [10] M. J. Swain and D. H. Ballard, “Color indexing”, International journal of computer vision 7(1), pp. 11-32, 1991. [11] J. K. Tsotsos, S. M. Culhane, W. Y. K. Wai, et al., “Modeling visual attention via selective tuning”, Artificial Intelligence, vol. 78, 507-545, 1995. [12] D. Zhang, G. Lu, “Review of shape representation and description techniques”, Pattern Recognition, vol. 37, 119, 2004. [13] Y-Y. Chuang, B. Curless, D. H. Salesin, and R. Szeliski, “A Bayesian approach to digital matting. In Proceedings of IEEE Computer Vision and Pattern Recognition (CVPR 2001), vol. II, 264-271, December 2001.