Available online at www.notulaebiologicae.ro Print ISSN 2067-3205; Electronic 2067-3264
Notulae Scientia Biologicae
Not Sci Biol 2 (3) 2010, 114-120
Comparison of Pattern Recognition, Artificial Neural Network and Pedotransfer Functions for Estimation of Soil Water Parameters Amir LAKZIAN, Mohammad Mohammad BANNAYAN AVAL, Nasrin GORBANZADEH Ferdowsi University of Mashhad, Faculty of Agriculture, P.O. Box 91775-1163, Mashhad, Iran;
[email protected];
[email protected]
Abstract This paper presents the comparison of three different approaches to estimate soil water content at defined values of soil water potential based on selected parameters of soil solid phase. Forty different sampling locations in northeast of Iran were selected and undisturbed samples were taken to measure the water content at field capacity (FC), -33 kPa, and permanent wilting point (PWP), -1500 kPa. At each location solid particle of each sample including the percentage of sand, silt and clay were measured. Organic carbon percentage and soil texture were also determined for each soil sample at each location. Three different techniques including pattern recognition approach (k nearest neighbour, k-NN), Artificial Neural Network (ANN) and pedotransfer functions (PTF) were used to predict the soil water at each sampling location. Mean square deviation (MSD) and its components, index of agreement (d), root mean square difference (RMSD) and normalized RMSD (RMSDr) were used to evaluate the performance of all the three approaches. Our results showed that k-NN and PTF performed better than ANN in prediction of water content at both FC and PWP matric potential. Various statistics criteria for simulation performance also indicated that between kNN and PTF, the former, predicted water content at PWP more accurate than PTF, however both approach showed a similar accuracy to predict water content at FC. Keywords: pedotransfer functions, kNN approach, soil water content estimation, artificial neural network Introduction
Many agricultural and environmental simulation models require soil water information as environment input to execute their algorithm. There are many attempts to estimate soil water content based on soil parameters to quantify the water availability. Soil water parameters can be measured by direct sampling on a small area however at larger spatial scale, it is almost impossible to accomplish such task. Direct measurement of soil hydraulic properties are relatively time consuming, labor intensive and expensive. Various approaches to estimate the soil water potential vary from regression equations (Scheinost et al., 1997), using neural network (Minasny et al., 1999) and employing many refinements on the PTF technique (Pachepsky et al., 1999; Willimas et al., 1992).Various functions named as pedotransfer functions (PTFs), have been introduced by using basic soil data to accomplish this task (Timlin et al., 1996; Rawls et al., 1991). A PTF (Bouma and Van Lanen, 1986) is a mathematical relationship between two or more relatively easily collected soil parameters, such as soil texture, bulk density, and organic matter content. PTFs usually link the water content at a certain matric potential to sand, silt, clay, organic matter content and bulk density (Gupta and Larson, 1979). Using local soil samples data for developing PTFs functions and using them on a wider area may result in wrong representations of the soil when one tries to apply them in simulation models (Gijsman et al., 2003). The performance of published PTFs, Received 11 July 20; accepted 18 August 2010
as also noted by Bastet et al. (1997), varied according to the pedological origin of the soil on which they were developed. Consequently PTFs should not be extrapolated beyond their geographical training area without local validity. Vereecken et al. (1990) used multiple linear regressions with sand and clay content, organic matter and bulk density data from undisturbed samples of 182 horizons of 40 Belgian soil series and employed the most frequently used equation developed by Van Genuchten (1980) which resulted in poor performance of PTF predictions. Pedotransfer functions can translate existing surrogate data (e.g. particle size distribution, bulk density and organic matter content) into soil hydraulic data (Schaap et al., 2001). However, since PTFs are often developed empirically, their applicability may be limited to the data set used to define the method (Donatelli et al., 1996; Wösten et al., 1999). Thus, users have a difficult task in selecting a more appropriate PTF for their specific application (Acutis and Donatelli, 2003). Artificial neural network (ANN) is another technique which has been used to develop pedotransfer functions (Pachepsky et al., 1996; Minasky et al., 1999). This technique employs many computing nodes which are organized (layers) and are interconnected as a network. Nonparametric resampling procedures including analogue approach are also another alternative to estimate soil water content based on similarity functions. The k nearest neighbor (k-NN) is an analogue approach (Lall and Sharma, 1996; Rajagopolan and Lall, 1999). This approach has its origin as a non-parametric statistical pattern
Lakzian, A. et al. / Not Sci Biol 2 (3) 2010, 114-120
115
recognition procedure to distinguish between different patterns according to a selection criteria (Bannayan and Hoogenboom, 2008a). Yakowitz (1987) and Karlsson and Yakowitz (1987) constructed a robust theoretical base for the k-NN method. It has been employed in various studies, especially in hydrology (Galeati, 1990; Kember and Flower, 1993; Todini, 2000). The k-NN approach has also been successfully applied in other disciplines, including remote sensing (Chi and Bruzzone, 2005), traffic forecasting (Davis and Nihan, 1991), molecular biology (Wu et al., 2005), soil science ( Jagtap et al., 2004; Nemes et al., 2006), daily weather prediction (Bannayan and Hoogenboom, 2008a; 2008b) and forestry (LeMay and Hailemariam, 2005). The scientific theory has been explained in detail by Brandsma and Buishand (1998), Rajagopolan and Lall (1999), and (Bannayan and Hoogenboom, 2008a; 2008b). The objective of this study was to compare pedotransfer functions, k-NN approach and artificial neural network (ANN) for estimating the soil water parameters including water content at FC and PWP and evaluate their accuracy for different soil types across northeast of Iran. Materials and methods
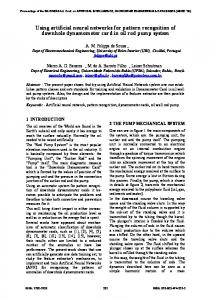
Soil data The study was conducted in the Razavi–Khorasan province located in the northeast of Iran (Fig. 1). Forty sampling sites (Tab. 1) were selected in different parts of the province and undisturbed soil samples were collected. Undisturbed soil samples were taken with a small thinwalled stainless steel tube separately. In soft soils, the sampler tube pressed into the soil by hand force and in hard soils, the sampler tube pressed into the soil using the hammer with two nylon heads. Soil samples were transported to the laboratory immediately. Undisturbed soil samples were saturated with distilled water and weighted for calculating the saturation percentage (SP). Then saturated soil samples carefully transferred to the pressure chamber and appropriate pressure was applied (-33 kPa for FC and -1500 kPa for PWP) to them. When equilibrium was reached (minimum 24 hrs) for each pressure and no change was observed in the volume of draining burette,
Tab. 1. Physiographic features and soil information of 40 selected sites in Northeast of Iran Location KashefiyeNeishaboor StationNeishaboor BehmanNeishaboor SarvelayatNeishaboor KameTorbat AbroodTorbat MiokiTorbat Omi-Torbat ShadmehrMahvelat KhoshdarehMahvelat AzgandMahvelat FeyzabadMahvelat BaharyeKashmar KajuneKashmar SedrabadKashmar HematabadKashmar
Latit. Longit. Elevation Soil (N) (E) (m) texture
Bulk density (g cm-3)
59°68΄
36°04΄
1131
Clay loam
1.14
58°47΄
36°14΄
1229
Loam
1.30
58°47΄
36°01΄
1160
Loam
1.34
58°31΄
36°55΄
1635
Loam
1.40
59°12΄
35°27΄
1662
Loam
1.32
59°22΄
35°18΄
1417
Sand loam
1.45
59°15΄
35°07΄
1174
Loam
1.35
59°12΄
35°14΄
1267
Loam
1.25
59°01΄
35°10΄
1153
Loam
1.30
59°57΄
35°12΄
1185
Loam
1.36
58°47΄
35°14΄
1174
Loam
1.24
58°47΄
35°00΄
909
Loam
1.35
58°38΄
35°14΄
1160
Sandy loam
1.40
58°32΄
35°12΄
1031
Loam
1.36
58°23΄
35°14΄
988
Loam
1.33
58°39΄
35°04΄
885
Sandy loam
1.54
the burette tap was closed and the pressure was released from the chamber. Soil samples were transferred from tubes to a weighing tin and the moisture content was determined in FC and PWP point. Soil organic matter of the collected-sieved samples were determined by the Walkley and Black (1934) as modified by Allison (1965) dichromate oxidation procedure. Sand, silt and clay content of soil samples were estimated by using hydrometer method (Gee and Bauder, 1979). Pedotransfer functions To find the most accurate PTF for the water content at the soil water potential of field capacity (-33 kPa) and perment wilting point (-1500 kPa), multiple regressions using stepwise approach (both backward and forward) by JMP software (Ver. 8.0) were employed. The general equation can be developed as below:
θ= aSand + bSilt + cClay + dOrganicContent Fig.1. Location map of sampling sites
Lakzian, A. et al. / Not Sci Biol 2 (3) 2010, 114-120
116
where θ is the water content (m3 m-3) at specific soil water potential (kPa), a, b, c, and d are regression coefficients. Half of our data were used for developing the multiple regression equation and the rest were used for verification. K nearest neighbor approach The k-NN method is based on recognizing a similar pattern of specified target soil parameters within a database of measured soil data which could be used as prediction of other parameters of the target soil. Target soil is the soil for which water content at FC and PWP needs to be determined. Target soil information as the initial seed of data, together with the soil database, are required as input files for running the algorithm. The k-NN algorithm typically selects a specified number of soil parameters similar to the pattern of same variables in the database. The k-NN algorithm searches its memory (the soils database) to find the most similar soil from its database. According to Jagtap et al. (2004) it does not have to be an exact match but can be the “best” soil, in other words, the closest match. As was mentioned in Bannayan and Hoogenboom (2009), in most practical cases, neighborhoods (K) may vary from 1 to N, where N is the total number of soils in the database. Considering the methodology for a case with K=1 the distance (dj) as the measure of similarity is expressed by equation 1 for a case with X attributes:
d
d j = ∑ W j ( V ij − V m j ) 2 j =1
(1) where dj, is Euclidean distances, Vij and Vmj are the jth component (such as % clay) of the target soil and ith nearest neighbor, respectively, d is the number of soil parameters and Wj are scaling weights (1/Sj) where Sj is each particle scale. Due to almost similar magnitudes of the soil particles value, the same influence (Wj =1) of all soil parameters data on the distance calculation was employed. Artificial neural network Another approach used in PTFs fitting is ANN (Pachepsky et al., 1996; Schaap et al., 1998). In recent years PTFs developed by artificial neural networks have yielded to results that are at least as good as other techniques. A mathematical model of ANN consists of a set of units including the input, output and hidden units as a link between the first two units to form a network. The number of nodes depends to the number of input and output variables. Within the node, each input is weighted and combined to produce a single value as the output of that node, which in turn directed to all nodes of the next layer or consider as output if it was a node of the output layer. The weights are obtained through a calibration (training) procedure, which can then be used to make estimations on independent data. Tamari and Wösten (1997) reviewed the ANN application in the soil science particularly in predicting soil hydraulic properties. In this study a type of ANN as multilayer perception (MLP) was employed.
Evaluation All three methods predictions in comparison with the observations were evaluated using the approach proposed by Kobayashi and Salam (2000). In this approach, n sets of predicted (x) and observed (y) values are compared on the basis of the mean squared deviation (MSD) as the measure of the difference between the two, viz. n
MSD= ∑ ( x i − yi ) 2 / n
(1) MSD has three additive components: squared bias (SB), squared difference between standard deviations (SDSD) and lack of correlation weighted by the standard deviations (LCS), viz. MSD=SB+SDSD+LCS (2) and each component is defined as: (3) S B = (x − y) 2 SDSD = ( S D s − S Dm ) 2 (4) i =1
LCS = 2 S Ds S Dm ( 1 − r )
(5)
where x and y are the mean of predicted (x) and observed (y) values, respectively, SDs and SDm are the standard deviations of x and y, respectively, and r is the correlation coefficient between x and y. The MSD indicates the overall deviation of the model prediction from the observation: high MSD indicates the large gap between the prediction and observation. The components of MSD represent different aspects of the overall deviation with SB representing the bias of the prediction, SDSD the difference in the variation of predicted and observed values, and LCS giving information of how the pattern of variation in observations was predicted. The square root of MSD is referred to as RMSD, which has the same dimension as the original variables: x and y. RMSD was divided by the mean of the observations, i.e. y , to calculate the relative RMSD. The root mean square deviation (RMSD), coefficient of determination (r2), and relative root mean square deviation (RMSDr), the index of agreement (d), and normalized RMSE were used to evaluate the accuracy of the predicted data. The index of agreement (d) was calculated as: n 2 ∑ ( X i − Yi ) 0≤d≤1 i =1 d =1− n 2 ( X i − Y + Yi − Y ) i∑ =1 Where n is the number of observations, Xi is the predicted value, Yi is the observed data and Y is the mean of observations.
Lakzian, A. et al. / Not Sci Biol 2 (3) 2010, 114-120
117
Results and discussion
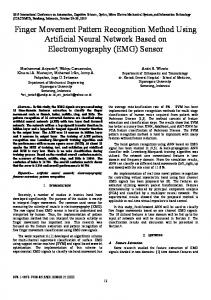
Comparison of different approaches for estimation of water content at FC and PWP and associated statistics are summarized in Tab. 2. The evaluation of PTFs in this study was based on a data set of 42 undisturbed soil samples collected from Khorasan region (Fig. 1) covering a wide range of soil textures within the region. MSD as the representative for deviation predicted data from observed ones showed that among the three approaches, ANN resulted to higher error compared to kNN and PTF approaches. Similar results of comparison of the three approaches obtained for PWP estimation. Between kNN and PTF, first approach showed lower error of prediction of PWP, however, kNN showed similar accuracy in comparison with PTF for FC estimation. RMSD values and 1:1 lines also showed similar pattern and magnitude of the accuracy of
Tab. 2. Evaluation of kNN, PTF and ANN for estimating field capacity and permanent wilting point Error measure
kNN
rRMSD MSD SB SDSD LCS D index
0.04 1.77 0.34 0.02 1.42 0.99
rRMSD MSD SB SDSD LCS D index
0.03 0.20 0.03 0.04 0.14 0.99
PTF Field capacity 0.05 1.77 0.19 0.01 1.57 0.98 Permanent wilting point 0.05 0.46 0.01 0.001 0.44 0.98
ANN 0.15 18.17 0.01 0.50 17.65 0.84 0.28 13.64 0.01 0.28 13.64 0.36
Lakzian, A. et al. / Not Sci Biol 2 (3) 2010, 114-120
118
Fig. 2. Comparison of simulated and observed values of FC and PWP using kNN, ANN and PTFs developed functions
the three approaches (Fig. 2). Such results indicated the poor performance of ANN. The main component of error of prediction for all three approaches was LCS compared to other components of MSD. This is consistent for both FC and PWP prediction. However MSD value of prediction of PWP compared to FC is lower across all three approaches. To employ kNN approach, all soil measured parameters including sand, clay, silt and organic matter were used. ANN also used all same variables which were used by kNN approach. To develop PTFs, stepwise regression only selected sand and clay for the predication of FC but for developing multiple regression equation of PWP the OC was considered. Our results based on the number of variables employed by each developing technique, indicated that using stepwise regression to develop PTFs was not a good choice in this study. Nemes et al. (2006) also resulted that mean residual error of developed PTF reduced as the included number of soil parameters increased. However when all variables are used, kNN showed superior to the ANN which means the employed technique can play a major role in our results. Baker and Elisson (2008) mentioned that ANNs are very data demanding and such techniques have only been become possible when are used together with a large database. While ANN-based PTFs have been relatively successful, there are a number of reported weaknesses that need to be considered. These are number of coefficients (weights) that do not permit easy physical interpretation (Schaap et al., 2001), the ANNs’s structure which has to be selected a priori and therefore may not be optimal since there are many types of neurons and many types of possible connections (Wösten et al., 2001), and there is no
assurance that the learning algorithm will find optimum weights that minimize prediction errors. Considering the problems associated with ANN-based PTFs, it seems that kNN approach is able to improve the PTFs accuracy and reliability. Acknowledgements This study has been granted by the Ferdowsi University of Mashhad and the authors would like to appreciate the grant approval of the research.
References Acutis, M. and M. Donatelli (2003). SOILPAR 2.00: software to estimate soil hydrological parameters and functions. Eur. J. Agron. 18:373-377. Allison, L. E. (1965). Organic carbon. In: C. A. Black et al., (Edt), Methods of Soil analysis, Part 2, American Society of Agronomy, Monograph No. 9, Madison, Wisconsin, pp.1367-1378. Ambroise, B., D. Reutenauer and D. Viville (1992). Estimating soil water retention properties from mineral and organic fractions of coarse-textured soils in the Vosges mountains of France. In: M. Th. Van Genuchten, F. J. Leij and L. J. Lund (Eds.), Indirect Methods for Estimating the Hydraulic Properties of Unsaturated Soils, University of California, Riverside, California, pp.453-462. Baker, L. and D. Ellison (2008). Optimization of pedotransfer functions using artificial neural network ensemble method.
Lakzian, A. et al. / Not Sci Biol 2 (3) 2010, 114-120
Geoderma 144:212-224. Bannayan, M. and G. Hoogenboom (2009). Using pattern recognition for estimating cultivar coefficients of a crop simulation model. Filed Crops Res. 111(3):290-302. Bannayan, M. and G. Hoogenboom (2008a). Daily weather sequence prediction realization using the non-parametric nearest-neighbor re-sampling technique. Int. J. Climatol. 28(10):1357-1368. Bannayan, M. and G. Hoogenboom (2008b). Weather Analogue: A tool for lead time simulation of daily weather data based on modified K-nearest-neighbor approach. Env. Modeling and Software 23:703-713. Bastet, G., A. Bruand, M. Voltz, M. Bornand and P. Quétin (1997). Performance of available pedotransfer functions for predicting the water retention properties of French soils, Proc. Int. Workshop on the Characterization and Measurement of the Hydraulic Properties of Unsaturated Porous Media. University of California, Riverside, CA. Brandsma, T. and T. A. Buishand (1998). Simulation of extreme precipitation in the Rhine basin by nearest neighbor resampling. Hydrol. and Earth System Sci. 2:195-209. Bouma, J. and H. A. J. van Lanen (1986). Transfer functions and threshold values: from soil characteristics to land qualities. Quantified land evaluation procedures: Proceedings of the international workshop on quantified land evaluation procedures held in Washington, D.C. 27 April-2 May 1986. ITC, Washington, D.C. Chi, M. and L. Bruzzone (2005). An ensemble-driven k-NN approach to ill-posed classification problems. Pattern Recog. Let. 27:301-307. Davis, G. A. and N. L. Nihan (1991). Nonparametric regression and short-term freeway traffic forecasting. J. of Transport and Engineering-ASCE 117 (2):178-188. Donatelli, M., M. Acutis and N. Laruccia (1996). Evaluation of methods to estimate soil 6 water content at field capacity and wilting point. Proceedings of the 4th European Society 7 of Agronomy Congress, Veldhoven, The Netherlands, pp.86-87. Galeati, G. (1990). A comparison of parametric and nonparametric methods for runoff forecasting. Hydrol. Sci. J. 35(1):79-94. Gee, G. W. and J. W. Bauder (1979). Particle size analysis by hydrometer: a simplified method for routine textural analysis and a sensitivity test of measured parameters. Soil Sci Soc. Am. J. 43:1004-1007. Gijsman, A. J., S. S. Jagtap and J. W. Jones (2003). Wading through a swamp of complete confusion: how to choose a method for estimating soil water retention parameters for crop models. Eur. J. Agron. 18:77-106. Gupta, S. C. and W. E. Larson (1979). Estimating soil water retention characteristics from particle size distribution, organic matter percent and bulk density. Water Resour. Res. 15:1633-1635.
119
Jagtap, S. S., U. Lall, J. W. Jones, A. J. Gismn and J. T. Ritchie (2004). Dynamic nearest neighbor method for estimating soil water parameters. J. of the American Soc. of Agric. and Bio. Eng. 47(5):1437-1444. Karlsson, M. and S. Yakowitz (1987). Nearest-neighbor methods for nonparametric rainfall–runoff forecasting. Water Resour. Res. 23(7):1300-1308. Kember, G. and A.C. Flower (1993). Forecasting river flow using nonlinear dynamics. Stochastic Hydro. Hydraulic 7:205-212. Kern, J. S. (1995). Evaluation of soil water retention models based on basic soil physical properties. Soil Sci. Soc. Am. J. 59:1134-1141. Kobayashi, K. and M. U. Salam (2000). Comparing simulated and measured values using mean squared deviation and its components. Agron. J. 92:345-352. Lall, U. and A. Sharma (1996). A nearest neighbor bootstrap for time series resampling. Water Resour. Res. 32(3):679-693. LeMay, V. and T. Hailemariam (2005). Comparison of nearest neighbor methods for estimating basal area and stems per hectare using aerial auxiliary variables. Forest Sci. 51(2):109119. Minasny, B., A. B. McBratney and K. L. Bristow (1999). Comparison of different approaches to the development of pedotransfer functions for water-retention curves. Geoderma 93:225-253. Nemes, A., W. J. Rawls and Y. A. Pachepsky (2006). Use of the nonparametric nearest neighbor approach to estimate soil hydraulic properties. Soil Sci. Soc. Am. J. 70:327-336. Pachepsky, Y. A., W. J. Rawls and D. J. Timlin (1999). The current status of pedotransfer functions: their accuracy, reliability and utility in field- and regional-scale modeling. In: D. L. Corwin, K. M. Loague and T. R. Ellsworth (Eds.), Assessment of non-point source pollution in the vadose zone. Geophysical monograph 108. American Geophysical Union, Washington, DC, pp.223-234. Pachepsky, Y. A., D. Timlin and G. Varallyay (1996). Artificial neural networks to estimate soil water retention from easily measurable data. Soil Sci. Soc. Am. J. 60:727-773. Rajagopolan, B. and U. Lall (1999). A k-nearest-neighbor simulator for daily precipitation and other variables. Water Resour. Res. 35(10):3089-3101. Rawls, W. J., T. J. Gish and D. L. Brakensiek (1991). Estimating soil water retention from soil physical properties and characteristics. Adv. Agron. 16:213-234. Rawls, W. J., Y. A. Pachepsky, J. C. Ritchie, T. M. Sobecki and H. Bloodworth (2003). Effect of soil organic carbon on soil water retention. Geoderma 116(1-2):61-76. Schaap, M. G., F. L. Leij and M. T. Van Genuchten (1998). Neural network analysis for hierarchical prediction of soil hydraulic properties. Soil Sci. Soc. Am. J. 62:847–855. Schaap, M. G., F. J. Leij and M. T. Van Genuchten (2001). Rosetta: a computer program for estimating soil hydraulic
Lakzian, A. et al. / Not Sci Biol 2 (3) 2010, 114-120
120
parameters with hierarchical pedotransfer functions. J. Hydrol. 251:163-176. Scheinost, A. C., W. Sinowsky and K. Auerswald (1997). Regionalization of soil water retention curves in a highly variable soilscape: I. Developing a new pedotransfer function. Geoderma 78:129-143. Tamari, S. and J. H. M. Wösten (1997). Using artificial neural network to develop pedotransfer functions of soil hydraulic conductivity. In: Proc. Int. Workshop on the Characterization and Measurement of the Hydraulic Properties of Unsaturated Porous Media. University of California, Riverside, CA. Timlin, D. J., Y. A. Pachepsky, B. Acock and F. Whisler (1996). Indirect estimation of soil hydraulic properties to predict soybean yield using GLYCIM. Agric. Syst. 52:331-353. Todini, E. (2000). Real-time flood forecasting: operational experience and recent advances. In: J. Marsalek et al. (Eds.), Flood issues in contemporary water management, Kluwer Academic Publisher, The Netherlands, pp.261-270. Van Genuchten, M. T. (1980). A closed-form equation for predicting the hydraulic conductivity of unsaturated soils. Soil Sci. Soc. Am. J. 44:892-898. Vereecken, H., J. Maes and J. Feyen (1990). Estimating unsaturated hydraulic conductivity from easily measured soil properties. Soil Sci. 149:1-12.
Walkley, A. and I. A. Black (1934). An examination of the degtjareff method for determining soil organic matter and prepared modification of the chronic acid titration method, Soil Sci. 34:29-38. Willimas, R. D., L. R. Ahuja and J. W. Naney (1992). Comparison of methods to estimate soil water characteristics from soil texture, bulk density and limited data. Soil Sci. 153:172184. Wösten, J. H. M., A. Lilly, A. Nemes and C. Le Bas (1999). Development and use of a database of hydraulic properties of Europian soils. Geoderma 90:169-185. Wösten, J. H. M., Ya. A. Pachepsky and W. J. Rawls (2001). Pedotransfer functions: bridging the gap between available basic soil data and missing soil hydraulic characteristics. J. of Hydrol. 251:123-150. Wu, W., E. P. Xing, C. Myers, I. S. Mian and M. J. Bissell (2005). Evaluation of normalization methods for cDNA microarray data by k-NN classification. Bioinformatics 6:191. Yakowitz, S. (1987). Nearest neighbor method for time series analysis. J. of Time Series Analysis 8 (2):235-247.