Proceedings of the 8th WSEAS Int. Conf. on ARTIFICIAL INTELLIGENCE, KNOWLEDGE ENGINEERING & DATA BASES (AIKED '09)
Using artificial neural networks for pattern recognition of downhole dynamometer card in oil rod pump system J. A. M. Felippe de Souza†, † Dept of Electromechanical Engineering, University of Beira Interior (UBI), Covilhã, Portugal.
[email protected]
Marco A. D. Bezerra††, M. de A. Barreto Filho††, Leizer Schnitman†† †† Dept of Electrical Engineering, Universidade Federal da Bahia (UFBA), Salvador, Bahia,. Brazil.
[email protected] ,
[email protected] ,
[email protected], Abstract: - The present paper shows that by using Artificial Neural Network system one can establishes pattern classes and sets standards for training and validation in Dynamometer Card in oil well rod pump systems. Also, the design and the implementation of a features extractor are then possible by the study of descriptors. Keywords: - Artificial neural network, pattern recognition, dynamometer cards, oil well rod pump.
1 INTRODUCTION
2 THE PUMP MECHANICAL SYSTEM
The oil reserves of the World are found in the Earth’s subsoil and only rarely it has energy to reach the surface naturally. Normally the oil needed to be raised artificially. The “Rod Pump System” is the most popular elevation mechanism used in the oil industry. It is basically composed by three elements: the “Pumping Unit”; the “Sucker Rod” and the “Pump” itself. The main diagnostic measure tool is the “Downhole Dynamometer Card” which is formed by the values of position of the pumping unit and the pressure in the connection junction of the sucker rod and the pump. Using an automatic system for pattern recognition of downhole dynamometer cards it becomes possible to anticipate the problems and therefore to take both corrective and prevention measures for it. This will bring direct impact in either increasing or maintaining the oil production level as well as in reduction on the energy that is spent. Several works have appeared about mechanisms of automatic classification of downhole dynamometer cards, such as [1], [2]; [4], [5], [6], [7], [8], [10], [13], [14], [15], however, their results either are limited to a reduced number of the anomalies or have low performance. The present work shows that one can artificially generate one data training set, to study the feature extractor’s mechanisms, to implement and train Artificial Neural Networks (ANN) for recognizing the patterns of anomalies of downhole dynamometer cards.
ISSN: 1790-5109
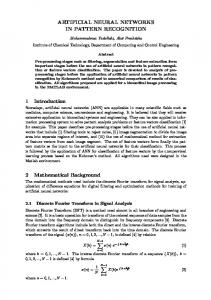
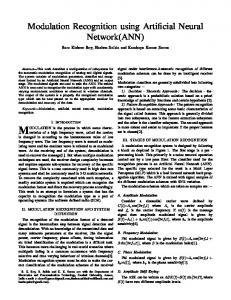
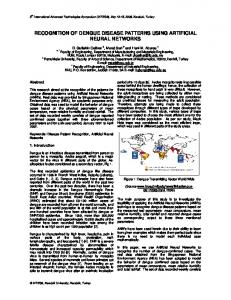
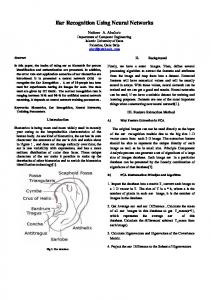
One can see in figure 1 the main components of the system, which are: the pumping unit; the sucker rod and the pump itself. The pumping unit is normally connected to an electrical engine or an internal combustion engine through a gearbox of torque transmission which transform the spinning movement of the engine into an alternate movement at the top of the sucker rod. The sucker rod on its hand transmits the mechanical energy received at the surface to the pump. Some energy is lost in friction during this process. Finally, the pump, which is shown in details at figure 2, transmits the mechanical energy received to the polyphasic fluid (oil, gas, sediments and water). In the downward course the traveling valve opens and the standing valve shuts. In this way the weight of the fluid column is supported by the sub-set of the standing valve and it is transmitted by to the tubing though the barrel. The plunger’s interior is flooded by the fluid. Plunging the column of rods in the fluid causes a small production due to the volume which was shifted. On the other hand, in the upward course the traveling valve shuts and the standing valve opens. The fluid shifted by the plunger shows up at the surface whereas the barrel is refilled through the standing valve. In this way, the weight of the fluid in the tubing is transmitted to the columns of rods. The dynamics described here can be seen as a simple harmonic motion of a mass
230
ISBN: 978-960-474-051-2
Proceedings of the 8th WSEAS Int. Conf. on ARTIFICIAL INTELLIGENCE, KNOWLEDGE ENGINEERING & DATA BASES (AIKED '09)
motion. Paper [3] presents a detailed study on the rod pump system and proposes an algorithm to compute the mechanical strengths on the subsurface (at the bottom) from measurements conducted on the surface.
corresponding to the columns of rods and the fluid load accumulated at a single point.
3 DYNAMOMETER CARDS The downhole dynamometer card is the main tool, and also the richest device, for monitoring the system. It was created in 1936 when Walton E. Gilbert published his work [11] that describes the its use for diagnosing the rod pump system. As a matter of fact the paper establishes graphic forms of the dynamometer cards associated to the system’s anomalies. A dynamometer card is formed by values of displacement and tension of the rods.
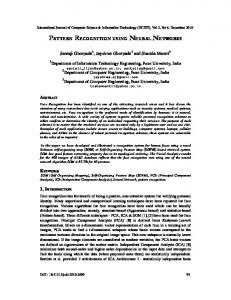
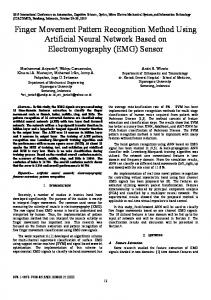
Fig 3 - Normal operation.
One can establish a wide set of classes that are used for pattern recognition of the downhole dynamometer card behavior. Figure 3 illustrates an example for normal operation and figures 4 to 8 illustrate examples for some anomalies such as: “fluid pound”, “gas interference”, “leaking standing valve”, “worn out pump” and “stuck piston”, respectively. Several schemes have been done in order to get an automatic diagnostic for the downhole dynamometer cards using both statistical and syntactic methods, artificial neural networks (ANN), or even symbolic neural networks [5]. One can establish a wide set of classes that are used for pattern recognition of the downhole dynamometer card behavior.
Fig 1 - The Pump Mechanical System.
Fig 4 - Fluid pound. Fig 2 - The pump.
These cases require a more accurate study on the operational conditions and this leads to solving damping wave equations to describe the
ISSN: 1790-5109
Fig 5 - Gas interference.
231
ISBN: 978-960-474-051-2
Proceedings of the 8th WSEAS Int. Conf. on ARTIFICIAL INTELLIGENCE, KNOWLEDGE ENGINEERING & DATA BASES (AIKED '09)
redundant information and the second being the linear or nonlinear transformation into the observation space dimension. There are some factors that make the design of the Characteristic Extractor easier:
Fig 6 - Leaking standing valve.
¾ Since the downhole dynamometer cards are not subject to rotation, one can use histograms to extract characteristics.
Fig 7 - Worn out pump.
¾ Since the downhole dynamometer cards have a borderline which is closed and periodic, one can use Fourier descriptors. Fig 8 - Stuck piston.
¾ The data normalization process eliminates the translation and scale effects.
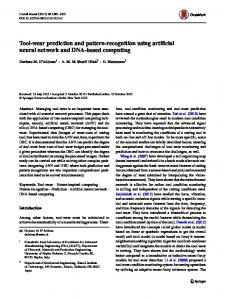
The process proposed here for identifying an occurrence of some anomaly has two stages: The data acquisition and the pattern recognition. The data acquisition is obtained by field instrumentation and its corresponding processing and this is shown in figure 9. A computational solution for the model transforms a surface dynamometer card, acquired by using sensors placed on the surface equipment, into a set of displacement and tension values.
¾ There is no overlap of other signals which might interfere with data.
Fig 10 - Characteristic Extractor and Classifier.
For the classifier the proposed scheme is a multiple layers feed forward ANN with a supervised training device [9].
Fig 9 - Data acquisition and signal processing.
4 PATTERN RECOGNITION
5 TRAINING AND TESTS
The pattern recognition scheme is illustrated at figure 10 and has two parts: the feature extraction and the classifier [9]. The feature extraction does a transformation of the vector X from an observation space of dimension ‘m’, which is the downhole dynamometer cards data, into the characteristic space of dimension ‘q’, where q < m, in order to simplify the classification task. The classifier, consist of an ANN that associates the vector of characteristics Y of dimension ‘q’ into one of the classes of the decision space which has dimension ‘r’. The Characteristic Extractor has two approaches [12], the first being to eliminate the
ISSN: 1790-5109
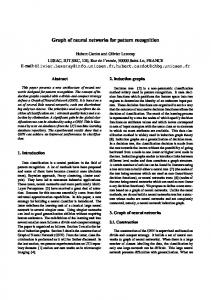
The proposed structure for the training is to generate artificially a set of standards using class models as the one shown in figures 3 to 8, with a random noise introduced. In this way, with a typical image of a normalized downhole dynamometer cards, the pair of values, position and traction are obtained. In order to have an approximation closer to reality, where the values of the cards are attained by sampling in regular time intervals, a simplification was conducted, where the sucker rod motion is the vertical projection of a point in simple harmonic motion, as it can be seen in figure 11, with a constant angular velocity.
232
ISBN: 978-960-474-051-2
Proceedings of the 8th WSEAS Int. Conf. on ARTIFICIAL INTELLIGENCE, KNOWLEDGE ENGINEERING & DATA BASES (AIKED '09)
Assuming that a complete period N samples are introduced; one has that, for the nth sample: 𝑥 =𝑥 + 𝑟 1 − 𝑐𝑜𝑠(𝜃) where 𝑟 = (𝑥 − 𝑥 )/2, 𝜃 = 𝑛. ∆𝜃 and ∆𝜃 = 2𝜋/𝑁.
of position (x axis) and traction (y axis), where half of them establishes the ascending curve of the pump whereas the other half forms the descending curve of the pump.
It is interesting to notice that the variation rate of the position of the samples with respect to the variation angle can be expressed by: = 𝑟𝑠𝑖𝑛(𝜃). This gives a small variation in the position of the samples at the beginning and at the end of the ascending and descending courses (xnin and xmax) that reflects in a more detailed view. Here it is used N ? 100 for the forward angle Δθ = 0.0628 rd, or 3.6º.
Fig 12 - Bit maps from some fluid pound models.
After normalization a white noise was added to the x axis. Since these values, after being added by noise, can go over the unit, they have to undergo to a second normalization. Figure 13 shows the overlapping of 300 artificial downhole dynamometer cards.
Fig 13 - Set of artificial standards for cards with fluid pound.
Fig 11 - Simplified model.
6 RESULTS AND DISCUSSION
On the other hand figures 14 and 15 show a comparison between the distances of successive x axis of points obtained artificially (figure 14) and from real cards (figure 15). The graph ] as a shows the form Δ𝑥𝜖[−Δ𝑥 + Δ𝑥 function of the position xn on a complete period ( n ∈ [1 , 100] ). One can observe that the minimal variation occurs on the limits of the periodic motion (around n = 1, n = 50 and n = 100) whereas the maximum variation occurs on the intermediate points (around n = 25 and n = 75). By using these techniques two sets of artificial cards were generated: one for the training of the network and another one for the validation. Each of these sets consists in 8 different classes, representing different anomalies, with 300 downhole dynamometer artificial cards by each class.
An application was initially done with the aim of using the proposed methodology to a set of 6,101 cards from real oil wells and each one composed of a set of 100 points, which were previously classified by a human expert. o Normal operation, 1843 occurrences. o Fluid pound, 4123 occurrences. o Gas Interference, 15 occurrences. o Leaking standing valve, 78 occurrences. o Plunger hitting top, 42 occurrences. The first step to obtain the artificial standards was to generate an image set in bit map, based on models, and using image manipulation software. Figure 12 illustrate a set of 4 images that represents the class of cards with fluid pound and in situations ranging from small to large gravity. A set of 100 points was obtained from each image. These points are arranged in values
ISSN: 1790-5109
233
ISBN: 978-960-474-051-2
Proceedings of the 8th WSEAS Int. Conf. on ARTIFICIAL INTELLIGENCE, KNOWLEDGE ENGINEERING & DATA BASES (AIKED '09)
Fig 17 - Output of the characteristic extractor.
Fig 14 - Distances between successive x axis (artificially obtained).
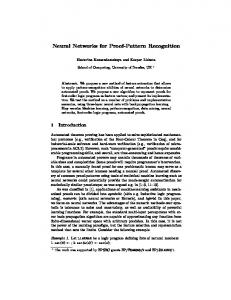
Several tests were carried out and the results achieved were satisfactory. The ANN type used was feed forward with 32 inputs, 16 neurons in the hidden layer and 8 neurons at the possible output layer. Sigmoid transfer function was used in the two last layers. Matlab version 7.0.0 was used in the implementation of the Characteristic extractor as well as the ANN classifier. Figure 18 shows the network training results. After the training the network validation was performed using now the second set of artificial cards with 100% correct results.
Fig 15 - Distances between successive x axis (from real cards).
Here a characteristic extractor that uses vertical projections of the ascending and descending curves was used. This is shown in figure 16. Acceptable results were obtained with a set of projections of the descending curve as well as of the ascending curve.
Fig 18 - Training results from the ANN classifier.
Fig 16 - Characteristic extractor.
This allowed a reduction of the dimension of the space from 200 (corresponding to 100 pairs of values of potion and traction) to just 32. Figure 17 shows the output of the 32 outcomes from the plunger hitting top for the several families of artificial downhole dynamometer cards.
ISSN: 1790-5109
Fig 19 - Error analysis in the classification.
234
ISBN: 978-960-474-051-2
Proceedings of the 8th WSEAS Int. Conf. on ARTIFICIAL INTELLIGENCE, KNOWLEDGE ENGINEERING & DATA BASES (AIKED '09)
[3] Barreto Filho, M. de A., Geração de Carta Dinamométrica de Fundo para Diagnóstico do Bombeio Mecânico em Poços de Petróleo, MSc Thesis, UNICAMP, Brazil, 1993. [4] Bezerra, M. A. D., L. Schnitman, M. de A. Barreto Filho and J. A. M. Felippe de Souza, Pattern recognition for downhole dynamometer card in oil rod pump system using artificial neural networks, submitted to the 11th International Conference on Enterprise Information Systems (ICEIS’09) to be held in Milan, Italy, May 2009. [5] Corrêa, J. F., Sistema Inteligente para Aplicações de Solução ao Bombeamento Mecânico de Petróleo, MSc Thesis, UNICAMP, Brazil, 1995. [6] Corrêa, J. F., H. Lepkison, A. C. Bittencourt, Intelligent Distributed Management System for Automatede Wells (SGPA): Experience and Results, SPE 84225, 2003. [7] Derek, H. J., J. W. Jennings and S. M. Morgan, EXPROD: Expert Advisor Program for Rod Pumping, SPE 17318, 1988. [8] Dickinson, R. R. and J. W. Jennings, The Use of Pattern Recognition Techniques in Analyzing Downhole Dynamometer Cards, SPE 17313, 1988. [9] Duda, R.O, P. E. Hart and D. G. Stork, Pattern Classification, 2nd edition. John Wiley & Sons, Inc., 2001. [10] Foley, W. L. and J. G. Svinos, EXPROD: Expert Advisor Program for Rod Pumping, SPE 16920, 1987. [11] Gilbert, W. E., An Oil-Well Pump Dynagraph, Production Practice, Shell oil Co., 1936, pp 94115. [12] Ludwig Jr, O. and E. M. Costa, Redes Neurais: Fundamentos e Aplicações com Programas em C, Ed. Ciência Moderna Ltda, 2007. [13] Martinez, E. R., W. J. Moreno and V. J. Castillo, Rod Pump Expert System, SPE 26246, 1993. [14] Schinitman, L., G. S. Albuquerque, J. F. Corrêa, H. Lepikson and A. C. Bitencourt, Modeling and implementation a system for sucker rod downhole dynamometer card pattern recognition, SPE 84140, 2003. [15] Xu, P., S. Xu and H. Yin., Application of selforganizing competitive neural network in fault diagnosis of suck rod pumping system, Journal of Petroleum Science & Engineering, 58, 2007 pp 43-48.
For the final test the 6101 real downhole dynamometer cards were used and the following result was achieved: o 11 card were not classified since the neurons at the output layer held values below the limit established by the criteria (0,1). o 69 cards were wrongly classified. However, from these 30 of them were cards pre-diagnosed as “plunger hitting top” when in fact they were “normal” When the above results were shown to a human expert, he observed that he would have considered as an acceptable diagnosis produced by the artificial neural network. That represents a considerable improvement in the results. Summing it up, from the 6,101 cards which were tested, the total classification error was found to be 1,31% and figure 19 illustrates that.
7 CONCLUSIONS The present work shows that the generation of artificial standards for training neural networks in order to analyze the pump mechanic system in oil elevation is feasible. The results shown here leave open the possibility of creating a scheme that not only incorporate the complete set of classes of anomalies, but which is also able to integrate the data base of real automation systems.
Acknowledgements The authors would like to acknowledge PETROBRAS for letting available information on real data for realizing the tests here and also to the Universidade Federal da Bahia (UFBA) through its Graduation Program in Mechatronics for the support given. References: [1] Abello, J., A. Houang and J. Russell, A Hierarchy of Pattern Recognition Algorithms for Diagnosis of Sucker Rod Pump Wells, IEEE 08186-4212-2/93, 1993, pp 359-364. [2] Alegre, L., A. F. da Rocha and C. K. Morooka, Intelligent Approach of Rod Pumping Problems, SPE 26253, 1993.
ISSN: 1790-5109
235
ISBN: 978-960-474-051-2