micro IEEE
Previous Page | Contents | Zoom in | Zoom out | Front Cover | Search Issue | Next Page
M q M q
M q
M q MQmags q THE WORLD’S NEWSSTAND®
.................................................................................................................................................................................................................
COMPREHENSIVE CIRCUIT FAILURE PREDICTION FOR LOGIC AND SRAM USING VIRTUAL AGING .................................................................................................................................................................................................................
A COMPREHENSIVE FAILURE-PREDICTION TECHNIQUE FOR MANY-CORE PROCESSORS ADDRESSES WEAR OUT IN HARSH ENVIRONMENTS FOR LOGIC AND STATIC RAM USING VIRTUAL AGING. THE DESIGN HAS A SIMPLE IMPLEMENTATION AND DELIVERS LOW COMPLEXITY, LOW OVERHEAD, AND HIGH ACCURACY. THE SYSTEM ENSURES NO CORRUPTIONS OR MISSED ERRORS FROM WEAR-OUT FAILURES AND PREDICTS FAILURES WITHIN 0.4 DAYS FOR LOGIC AND WITHIN MILLISECONDS FOR SRAM.
......
Amir Yazdanbakhsh Georgia Institute of Technology Raghuraman Balasubramanian Tony Nowatzki Karthikeyan Sankaralingam University of Wisconsin–Madison
In the future, especially in harsh environments (such as aerospace, underwater, and military), microprocessors are increasingly likely to fail in the field because of manufacturing test fault escapes and various aging and wear-out phenomena.1,2 Circuit failure prediction techniques employ wear-out device physics principles and empirical measurements3 to predict failures in the field before they occur for logic and static RAM (SRAM). Models of the dominant mechanisms— negative bias temperature instability (NBTI), Hot Carrier Injection (HCI), and timedependent dielectric breakdown (TDDB)— show logic wear out increases the delay of gates because a degraded Vth increases the ðVDD " Vth Þ. However, wear out of SRAM transistors affects the SRAM arrays’ performance parameters (such as read stability, write stability, and read delay) differently. Previous work has shown that read stability is the dominant failure in SRAM arrays because of the wear out.3–5 (The effect of aging on transistors’ mobility is not considered.)
Extensive literature has addressed wearout-prediction inspired by these observations (in the interest of space, we provide one representative citation6). However, as far as we know, no prior work simultaneously addresses both logic and SRAM. Furthermore, they individually suffer from complexity, overhead, and accuracy and generality problems and become particularly ineffective in harsh environments in which wear-out challenges are exacerbated. These prior techniques are discussed further in the “Related Work in Circuit Failure Prediction” sidebar. Our goal is to develop a unifying yet simple mechanism that covers both logic and SRAM and delivers low complexity, low overhead, and high accuracy. To this end, we developed a comprehensive circuit-prediction technique called the Aged Full-Chip Predictor for both logic and SRAM in many-core systems. Aged Full-Chip Predictor allows safe execution up to 0.4 days before logic failures and extends the typical lifetime by 14 months, over a system with ECC for SRAM.
Published by the IEEE Computer Society
0272-1732/15/$31.00 c 2015 IEEE
.......................................................
24
micro IEEE
$
Previous Page | Contents | Zoom in | Zoom out | Front Cover | Search Issue | Next Page
M q M q
M q
M q MQmags q THE WORLD’S NEWSSTAND®
micro IEEE
Previous Page | Contents | Zoom in | Zoom out | Front Cover | Search Issue | Next Page
M q M q
M q
M q MQmags q THE WORLD’S NEWSSTAND®
..............................................................................................................................................................................................
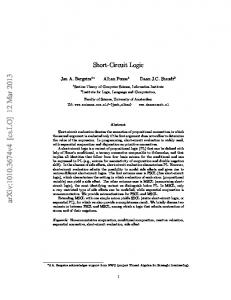
Related Work in Circuit Failure Prediction Figure A shows the various alternatives for handling wear out in logic and SRAM. Dimitris Gizopoulos and colleagues provide a good overview of detection techniques for logic.1 Logic wear-out prediction is based on canaries,2 in-situ flip-flop techniques,3 delay measurement,4 and built-in self-test (BIST).5 SRAM-based detection and prediction techniques are based on sensors or modifications to the SRAM cell,6,7 complex error-correcting codes (ECCs), and hybrid ECC and cell sizing.8 None of these can simultaneously deliver on low complexity, low overheads, and high accuracy because these techniques operate within only a single computing layer. When done at the circuit level, these techniques suffer from complexity and always remain active. On the other hand, an architecture-levelonly solution suffers from low accuracy because architecture fault models do not capture most physical effects. (In both logic- and SRAM-based directions, there is a body of work on mitigation and repair, which is complementary and somewhat orthogonal to detection and prediction.)
2. J. Tschanz et al., “Tunable Replica Circuits and Adaptive Voltage-Frequency Techniques for Dynamic Voltage, Temperature, and Aging Variation Tolerance,” Proc. Symp. VLSI Circuits, 2009, pp. 112–113. 3. D. Ernst et al., “Razor: A Low-Power Pipeline based on Circuit-Level Timing Speculation,” Proc. 36th Ann. IEEE/ACM Int’l Symp. Microarchitecture, 2003, pp. 7–18. 4. J. Blome et al., “Self-Calibrating Online Wearout Detection,” Proc. 40th Ann. IEEE/ACM Int’l Symp. Microarchitecture, 2007, pp. 109–122. 5. J.C. Smolens et al., “Detecting Emerging Wearout Faults,” 3rd IEEE Workshop Silicon Errors in Logic-System Effects, 2007;
http://jared.smolens.org/documents/first-smolens_____________________________
selse07.pdf. _______ 6. F. Ahmed and L. Milor, “Reliable Cache Design with On-Chip Monitoring of NBTI Degradation in SRAM Cells using BIST,” Proc. 28th VLSI Test Symp., 2010, pp. 63–68. 7. Z. Qi et al., “SRAM-Based NBTI/PBTI Sensor System Design,” Proc. 47th ACM/IEEE Design Automation Conf.,
References
2010, pp. 849–852.
1. D. Gizopoulos et al., “Architectures for Online Error Detection and Recovery in Multicore Processors,” Proc. ACM/
8. Z. Chishti et al., “Improving Cache Lifetime Reliability at
IEEE Design, Automation, and Test in Europe Conf., 2011, pp. 1–6.
Ultra-Low Voltages,” Proc. 42nd Ann. IEEE/ACM Int’l Symp.
Technique operation over time (thickness indicates operational overheads)
Lifetime of a processor
Logic failure
Time (years)
Zero
Causes system corruption Age detection flip-flops
Coverage
Early prediction
Select logic on critical paths
BIST-based prediction
Microarchitecture, 2009, pp. 89–99.
Lifetime of a processor First SRAM failure Causes system corruption Lifetime of a processor with ECC First SRAM failure
Continuous monitoring of gate delay Aged-SDMR
Early prediction
Select logic on critical paths
Second SRAM failure (if chip were active)
Wasted lifetime/lost performance Cannot correct next error Cache block unusable* * processor decommissioned if many blocks become unusable Corrected by ECC
Logic on critical paths Periodic, offline BIST check
Online delay tracking
Time (years) Cache block unusable
Aged-AsymChk
All logic cells
Virtual aging + sampled redundancy
First SRAM failure
Second SRAM failure (if chip were active)
Timely prediction by Aged-AsymChk Decommissioned with little wasted lifetime
Corrected by ECC
Prediction techniques targeting memories (SRAM)
Prediction techniques targeting logic
Figure A. The operation of failure-prediction techniques that target logic and static RAM (SRAM). Compared to other logicdetection techniques, Aged-SDMR has low overhead and coverage on all logic cells. Compared to error-correcting code (ECC) alone, Aged-AsymChk can predict the second failure before it occurs.
Design
Virtual aging to manifest faults
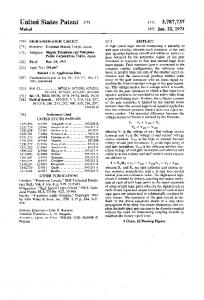
The design of the Aged Full-Chip Predictor leverages three primary mechanisms. We discuss the insight for each and outline their design below. Figure 1 provides an overview of the execution of our comprehensive failure-prediction system.
Our key insight is to virtually wear out the processor and thus manifest a wear-out fault early. We convert the wear-out degradation into a higher-level and easier-to-detect fault; we then expose and detect the fault, which effectively predicts and detects the wear out.
.............................................................
NOVEMBER/DECEMBER 2015
micro IEEE
25
Previous Page | Contents | Zoom in | Zoom out | Front Cover | Search Issue | Next Page
M q M q
M q
M q MQmags q THE WORLD’S NEWSSTAND®
micro IEEE
Previous Page | Contents | Zoom in | Zoom out | Front Cover | Search Issue | Next Page
M q M q
M q
M q MQmags q THE WORLD’S NEWSSTAND®
.............................................................................................................................................................................................. FAILURE PREDICTION
Time (years)
Execution is divided into epochs S-epochs
L-epochs Aged-SDMR active 1% of the cycles at the start of each L-epoch
Aged-AsymChk is active at the start of each S-epoch Resume processes
Pause all processes Flush cache
Aged-AsymChk
Aged-SDMR
Processor
Virtual aging makes the cells behave as if they are weeks older. Causing eventual failures to manifest as stuck-at faults. BIST test vectors expose these faults. AsymChk ideal to BIST checkers detect the defect. capture stuck-at faults
Processor memories
No modifications to SRAM cells BIST test vectors
SRAM cells
B
ECC
C D
Test mode
BIST check Supply voltage
DVS
Memories
Control
Memory
Virtual ager
A B C D
Logic
Virtual aging makes the cells behave as if they are weeks older. Causing eventual failures to manifest as delay faults. User applications expose these faults as errors. Sampling DMR ideal to Sampling DMR detects the errors. capture delay faults
Processor logic
Near-critical paths
C
B
To processor logic
A B C D
User applications running Sampling DMR active Virtual aging active
BIST check Virtual aging active
A
fast gate Noncritical path
CLK
Capture flop
phased CLK
Clock gate Aging mode
Supply voltage
DVS
Virtual ager
A
Additional logic inserted to cover fast gates Sampled dual modular redundancy D
Checker core
Checker core
Figure 1. Two techniques, based on virtual aging, together provide comprehensive failure prediction. Aged-SDMR detects manifested logic errors using sampling and dual-modular redundancy, whereas Aged-AsymChk detects manifested SRAM errors using asymmetric checking.
All device-level wear-out faults eventually must manifest at a higher abstraction level; thus, any detection technique can be repurposed as a prediction technique. We carry out virtual aging by reducing supply voltage using dynamic voltage scaling. We can tune the prediction’s timeliness by changing the amount of voltage reduction. Virtual aging is instantaneously reversible; resetting to nominal voltage restores the processor’s current age.
Sampled redundancy to expose and detect logic failure
............................................................
26
micro IEEE
We observed that wear out in logic is first exposed as a logic delay fault, and sampled redundancy with execution on a second core can be effective in handling logic transistors. BIST and stuck-at fault models are insufficient for providing full coverage for these delay-driven failures. The key idea of the solution, Aged-SDMR, is to couple cores randomly at randomly chosen periods of time, run one core virtually aged, use the second (redundant) core as a checker core, and couple these using a nonintrusive lightweight mechanism. Because logic
faults start as delay faults, a comprehensive redundant core is necessary for full coverage. Shuou Nomura and colleagues introduced the concept of SamplingþDMR,7 which solves the overhead problem that historically has plagued redundancy. Our key advancement over their work is to use virtual aging during DMR execution to ensure that faults always occur first in a DMR window, thus ensuring no missed errors.
Asymmetric checkers to expose and detect SRAM failure Aged-SDMR cannot be used for SRAM because checkpointing the entire SRAM state is infeasible, especially considering today’s megabyte-sized level-2 caches. However, wear out in SRAMs results in read stability problems, and therefore its effect can be captured by a simple stuck-at fault model. The solution, Aged-AsymChk, leverages this insight and uses established asymmetric checker technology such as BIST to check the SRAMs when they are virtually aged. Specifically, we write known vectors to an SRAM, then read out the values; any mismatch between these indicates an impending failure.
IEEE MICRO
Previous Page | Contents | Zoom in | Zoom out | Front Cover | Search Issue | Next Page
M q M q
M q
M q MQmags q THE WORLD’S NEWSSTAND®
micro IEEE
Previous Page | Contents | Zoom in | Zoom out | Front Cover | Search Issue | Next Page
THE WORLD’S NEWSSTAND®
Use of existing techniques The principles of dynamic voltage scaling, sampling, redundancy, and asymmetric checking using BIST are well known. Our work’s implementation and design contribution is a novel use of existing techniques, while avoiding disruptive or intrusive mechanisms and providing comprehensive logic and SRAM wear-out prediction. The implementation requirements are simple or already existent: dynamic voltage scaling capability; separate voltage islands for SRAMs and logic; a reliability manager module added to cores to allow checking of retired instructions; BIST capability in the SRAMs; and a controller (like a cache controller) in the SRAM that allows its contents to be safely evicted prior to being overwritten for BIST.
Implementation We present the organization of our system and the implementation of virtual aging, fault exposure, and fault detection. Within each, we discuss logic and SRAM. Figure 1 shows the high-level overview and details of each individual approach. We focus on SRAM in this article because our previous work covered the logic.8
Overall organization Conceptually, we execute the processor in epochs, where at the start of every epoch we have a window where the processor is virtually aged. As Figure 1 shows, we have two types of epochs: logic epochs (L-epochs), in which only the logic is virtually aged, and SRAM-epochs (S-epochs), in which only SRAM is virtually aged. These never overlap and are executed at different rates.
Virtual aging We virtually age a processor by reducing the supply voltage to both logic and SRAM arrays. Although the enabling mechanism is the same, the failure behavior is different. For SRAM, prior to virtual aging, we must ensure any useful SRAM state is written to some other location. For an SRAM that is part of a cache, the cache controller can be enhanced to evict all dirty lines. Otherwise, it can be done completely in software using instructions like WBINVD (writeback and invalidate
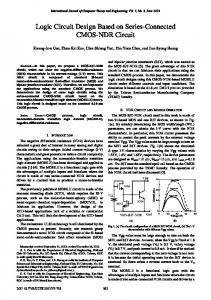
cache) in the AMD 64 architecture. SRAMs in speculative structures such as branch predictor tables can simply be overwritten. Precise interrupts that would start an S-epoch ensure that structures such as load queues and the rename table are empty. We can virtually age large memory structures, such as L2 caches with many SRAM blocks, by applying the S-epochs one SRAM array at a time coordinated with the controller to turn off banks. Effect on logic. The delay of a gate td is inversely proportional to ðVDD " Vth Þ2 . Wear out causes Vth and hence td to increase. Reducing VDD has the same effect and can be calibrated to mimic weeks or months of aging. Effect on SRAM. Consider the basic six-transistor SRAM cell organization. In a newly manufactured cell, the cross-coupled inverters are fairly identical, producing a voltage transfer characteristic as in Figure 2a. The static noise margin (SNM) is the minimum noise or extraneous voltage that can corrupt the stored value. The read failure probability defines this likelihood for a given cell. Owing to wear out, the SRAM’s inverters degrade, reducing the static noise margin as shown in Figures 2b and 2c, which consequently increases the read failure probability. Furthermore, SRAM wear out is asymmetric and depends on the stored value in the SRAM cell. For example, when zero value is stored in the SRAM cell, the p-channel MOS transistor in one of the inverters is subjected to stress, whereas the PMOS transistor in the other one goes into the recovery mode. With extremely high wear out, cells can become stuck at 0 or 1 permanently (see Figure 2d). Virtual aging’s behavior for SRAM is similar to the logic case. The fundamental source for SNM change is decreased ðVDD " Vth Þ due to increased Vth , which can be achieved equivalently by decreasing VDD and can be instantaneously reset back to the current age by resetting to nominal VDD . Figure 3 shows an HSpice simulation of virtual aging’s effectiveness. Using MOS reliability analysis (MOSRA) aging models, we ran simulations of the SRAM cell with various amounts of aging—for the technology and the MOSRA parameters that we considered,
.............................................................
NOVEMBER/DECEMBER 2015
micro IEEE
M q M q
M q
M q MQmags q
27
Previous Page | Contents | Zoom in | Zoom out | Front Cover | Search Issue | Next Page
M q M q
M q
M q MQmags q THE WORLD’S NEWSSTAND®
micro IEEE
Previous Page | Contents | Zoom in | Zoom out | Front Cover | Search Issue | Next Page
M q M q
M q
M q MQmags q THE WORLD’S NEWSSTAND®
.............................................................................................................................................................................................. FAILURE PREDICTION
1.0
1.0 Read SNM
0.8
0.6
V(QB)
V(QB)
0.8
Read SNM > 0
0.4
0.6
0.4
0.2
0.2
VDD = 1.2 V
VDD = 1.2 V
Age = 0 years
0
0
0.2
Age ≈ 10 years
0.4
(a)
1.0
0.6 V(Q)
0.8
0
1.0
0
0.2
0.4 V(Q)
(b)
0.6
0.8
1.0
1.0
Read SNM ≈ 0
VWL VQ
0.8
0.8
V(QB)
VQB
0.6
0.6
0.4
0.4 0.2
0.2
VDD = 1.2 V Age ≈ 12 years
0 (c)
bit flip
0
0.2
0 0.4
0.6 V(Q)
0.8
1.0
0
50
100
(d)
150
200
250
300
350
400
450
Time (µsec)
Figure 2. Six-transistor (6T) SRAM cell transfer characteristics and the read failure in the SRAM cell. 6T SRAM transfer characteristics for a (a) new chip, (b) positive read static noise margin (SNM) after wear out, and (c) zero read SNM after wear out. (d) Negative (near-zero) read SNM causes the stored value in the SRAM to flip (initial stored value is zero).
............................................................
28
micro IEEE
failure happened at approximately 12 years (626 weeks) for a worst-case stressed cell (that is, one that constantly stores either one or zero in the SRAM cell for the duration of the aging). The MOSRA parameters are TIT 0 ¼ 5e " 8; TITFD ¼ 7:5e " 10; TITTD ¼ 1:45e " 20; TN ¼ 0:5; RelMode ¼ default (both HCI and BTI). At each aging setting, we also ran a simulation with various amounts of voltage reduction. In this case, we first obtained the total amount of stress on transistors during the whole period of the aging with the nominal voltage, which shows itself as shift in the Vth .
Given the shifted Vth values for each transistor, we simulated the SRAM cell with the reduced voltage to observe the aging failure. The dots in the figure indicate the age at which the cell failed for various amounts of voltage reduction. Subtracting this age from 12 years provides the window of advance failure notification. This experiment demonstrates that reducing voltage serves the purpose of virtual aging.
Fault exposure The fault exposure mechanism is what makes all errors visible to the detection mechanism.
IEEE MICRO
Previous Page | Contents | Zoom in | Zoom out | Front Cover | Search Issue | Next Page
M q M q
M q
M q MQmags q THE WORLD’S NEWSSTAND®
Previous Page | Contents | Zoom in | Zoom out | Front Cover | Search Issue | Next Page
M q M q
M q
M q MQmags q THE WORLD’S NEWSSTAND®
SRAM. The goal of fault exposure is to condition a failed cell to produce errors. Our main contribution here is based on a simple observation: the read stability problem in failed cells can be abstracted as a stuck-atzero or a stuck-at-one fault if we can write known values into the SRAM and then read them. We reuse the pattern generators in memory BIST to produce and write these values: a simple “March” algorithm that writes all zeros followed by all ones will suffice for Aged-AsymChk.
1.2 1.0 ß 0.8 End of life
Logic. Exposing permanent faults in the critical path is straightforward. Permanent faults keep producing the fault in the circuit. However, based on the input values, some of the faults might be masked. Therefore, we need a mechanism to do more than one sampling to guarantee the detection mechanism’s completeness. Figure 4a shows how degradation affects a critical path, assuming that guardband is added to accommodate aging. As the chip ages, the delay increases and the guardband slack decreases. When the delay degradation overshoots the guardband (3 years in the figure), soft breakdown occurs. Under virtual aging, the additional delay in gates that fall in near-critical paths show up as faults at the flip-flops they drive. This causes a bit-flip (or metastability) at the output of the flip-flops that can propagate to cause an architectural state corruption. These faults are exposed, with no modifications required to the processor. Figure 1 shows an example circuit block highlighting the fact that the critical path is left unmodified. Noncritical paths introduce subtle challenges because gates that are exclusively on noncritical paths (fast gates) can degrade directly to hard breakdown without ever manifesting as a delay fault, thus circumventing the prediction mechanism. Simple clockphase shifting logic can be added to gates on noncritical paths to effectively expose their delays (see Figure 1). Because modifications are only to paths that have much slack, they are not a source of complexity.
Voltage (volt)
micro IEEE
0.6 0.4 0.2 0 100
ß: Predicted ~ 28 weeks in advance with VDD reduced by 45 mV 200
300
400
500
600
Time in weeks
Figure 3. The timing of failure manifestation using virtual aging versus supply voltage. As the supply voltage is reduced (virtual aging), the time when the failure occurs becomes earlier.
Logic. For fault detection in logic, we use a separate checker core that is started on the basis of the checked core’s checkpoint. The checker core operates at regular voltage. As we outlined earlier, we need a full-fledged core to address accuracy problems, because BIST and test-vector-based techniques compromise coverage for delay-based fault models. We also add a simple reliability manager module to every core, which monitors retiring instructions, converts them into a signature, and sends the signature to the checker core using the L2-cache communication network. The checker core’s reliability manager checks the signature against its own computed signatures. Shuou Nomura and colleagues describe the firmware or OS to allow the pairing of arbitrary cores together using the idea of virtual CPUs.7 We assume the same to allow the coupling of cores. SRAM. The detection phase is trivial for Aged-AsymChk, because the BIST controller knows what values to expect—any differences are flagged as impending failures.
Discussion Fault detection The fault-detection mechanism compares measured (read) values against known (written) values to determine when a fault has occurred.
An important question to consider is, compared to prior works, what do we lose or what assumptions are broken or ignored? We make one judicious cross-layer (circuit to
.............................................................
NOVEMBER/DECEMBER 2015
micro IEEE
29
Previous Page | Contents | Zoom in | Zoom out | Front Cover | Search Issue | Next Page
M q M q
M q
M q MQmags q THE WORLD’S NEWSSTAND®
micro IEEE
Previous Page | Contents | Zoom in | Zoom out | Front Cover | Search Issue | Next Page
M q M q
M q
M q MQmags q THE WORLD’S NEWSSTAND®
.............................................................................................................................................................................................. FAILURE PREDICTION
DQ CLK
Input
DQ
Capture edge
CLK
CLK
Time
CLK
CLK
Input
Capture edge
Clock
In
Input
D
Guardband
Q D
0 years
Degradation
Q D
2.5 years
Timing violation Soft breakdown
Q
3 years
D
Large slack
Q D
Degradation
Q D
Hard breakdown
Q
Fault exposure D
D
Fault manifested Fault exposed
Q
Fault manifested No fault seen
Q
Phased clock 2.5 years + Q' virtual aging (b)
(a)
Fault exposed
Figure 4. Signal integrity in circuits as they age. (a) In near-critical paths, the signal integrity will not hold once the guardband is degraded (a delay fault), and virtual aging alone can detect the problem in advance. (b) In noncritical paths, hard breakdown may occur before a delay fault manifests, but a phased clock on these paths can expose the issue earlier.
architecture layer) assumption: the state or values in the SRAM can be drained using an architectural mechanism, allowing the SRAM’s contents to be overwritten to allow BIST-based stuck-at-fault testing periodically. In the context of a microprocessor execution, this is a reasonable and easy-to-implement assumption. However, the circuit-based techniques attempt to address wear out in isolation and hence avoid such assumptions.
Evaluation Our goal of understanding wear out and the Aged Full-Chip Predictor’s effectiveness is organized around eight questions, of which questions 5 through 8 address overhead and accuracy. ' ' '
............................................................
30
micro IEEE
Q1: Are wear out and its effects measurably observable? Q2: Can voltage reduction virtually manifest wear-out faults? Q3: Are the manifested faults exposed to a higher level?
' ' ' ' '
Q4: Are the faults exposed to the higher level detected? Q5: What are the overheads? Q6: What is the delay to predict the wear out? Q7: When does this technique provably fail to predict wear out? Q8: How does this technique compare to the current state-of-the-art methods?
We examine each question for logic and SRAM. By design, we achieve low complexity, which was our other key goal.
Methodology Our evaluation of the Aged Full-Chip Predictor uses a prototype system we built on the basis of the OpenRISC processor (see Figure 5). For logic and Aged-SDMR, our general philosophy is as follows: '
Use Spice and MOSRA with the 32nm silicon-on-insulator library to evaluate any gate-level effects.
IEEE MICRO
Previous Page | Contents | Zoom in | Zoom out | Front Cover | Search Issue | Next Page
M q M q
M q
M q MQmags q THE WORLD’S NEWSSTAND®
'
Use gate-level delay-aware simulations to check for timing faults. Use full-system emulation on the field-programmable gate array when actual runtime data is required.
1
Is wear out measurably observable? Is the degradation deterministic?
Logic 1 1
For Aged-AsymChk, our evaluation is similar:
' '
Use Spice and MOSRA to evaluate any gate-level effects, including the noise margin. Use the noise-margin results to determine failures in SRAM reads. Use analytical models and workload measurements to determine the effect of applications on wear out.
One difference is that we run more benchmarks using larger input sets, totaling 35 and spanning SPEC2K, SPEC2006, MediaBench, and Parboil, to capture cache and SRAM effects more representatively.
1
1 0
32-nm lib
2
Delay degradation
SPEC2000, SPEC2K6, Mediabench, Parboil Time (cache Voltage intensive) Usage
32-nm lib
HSpice + Mosra
Voltage transfer characteristics
Degradation indeterministic
Time
Simulation Figure 7 Degradation indeterministic
Vin A1 : Figure 3 (b, c) A2 : Figure 4
@Different utilizations @Supply voltage reduction
3
Can reducing supply voltage virtually manifest wear-out faults? SRAM
SPEC2000
Simulation Time Voltage Switching Activity
HSpice + Mosra
Delay
'
M q M q
M q
M q MQmags q THE WORLD’S NEWSSTAND®
Vout
'
Previous Page | Contents | Zoom in | Zoom out | Front Cover | Search Issue | Next Page
Do the manifested faults get exposed to a higher level?
Are the faults exposed to the higher level detected?
4
Logic
SRAM
SPEC2000
No application dependency
Xilinx Zynq FPGA OpenRISC processor
Wornout SRAM
Xilinx Zynq FPGA
CLK
OpenRISC processor
OpenRISC Delay aware simulation processor 1 0 1 Fault vector
Checker
micro IEEE
A3: Figure 4(d) Read failure probability Stuck-at fault BIST captures all stuck-at faults
Architectural error rate
Timing fault rate
HSpice + Mosra
Aged-SDMR results Table 1 summarizes the key results for Aged-SDMR, and Table 2 compares AgedSDMR to three state-of-the-art techniques.9-11
5
What are the overheads? OpenRISC processor CLK
Logic
SRAM Synopsys Design Compiler- STA
Aged-AsymChk results
Fast gates
We address the evaluation questions for Aged-AsymChk in detail below.
Insert capture logic
Understanding degradation (Q1). Degradation in SRAM devices is measurably observable and cannot be statically determined because it depends on the switching activity. Figure 3 previously showed this aging behavior at the cell level. Figure 6a shows the wear out at the application level for every cell in a 64-Kbyte data cache (a two-way set associative, level-1 cache with 64-byte blocks). Here, we quantify and visualize wear-out intensity using a simple model: we count the number of cycles that a cell is 1 as a unit of wear out, and we assume every transition to 0 is "1/ 100th of one unit (modeling NBTI recovery). For all applications, we consider a 200-million-cycle window, and pixel values are normalized to maximum wear out. Two banks form the cache ways, shown side by side. We also determined the average and standard deviation of wear out across all the
6
7
Offline testing period ~ 10 hrs
Power, energy overhead ~ 0
Modified netlist
Reuse BIST
Area, power, energy overheads
No area overhead
What is the delay to predict? Logic
SRAM
Voltage reduction vs. virtual aging
Worst-case error occurrence HMM models No. of samples required
Worst-case prediction latency
Prediction latency, horizon
When does this technique provably fail to predict wear out? SRAM
Device failure analysis False positives/ negatives
Fault models Probabilistic models
8
Duration of 1 BIST test
How does it compare to the current state-of-the-art?
Logic State-of-the-art techniques
Failures that cannot be predicted
Caches with ECC (state-of-the-art)
Aged-SDMR
Analysis Table 1 Overheads area/power
Fault models
Time to predict
SRAM Cell failure probability (fc)
Wear-out rates Analytical Models
Prediction horizon
Table 3 Is ECC sufficient?
Figure 8
Figure 5. Evaluation setup. We built a prototype system based on the OpenRISC processor to evaluate the Aged Full-Chip Predictor.
.............................................................
NOVEMBER/DECEMBER 2015
micro IEEE
Wasted lifetime
31
Previous Page | Contents | Zoom in | Zoom out | Front Cover | Search Issue | Next Page
M q M q
M q
M q MQmags q THE WORLD’S NEWSSTAND®
micro IEEE
Previous Page | Contents | Zoom in | Zoom out | Front Cover | Search Issue | Next Page
M q M q
M q
M q MQmags q THE WORLD’S NEWSSTAND®
.............................................................................................................................................................................................. FAILURE PREDICTION
Table 1. Aged-SDMR results Evaluation questions
Results
Understanding
Delay degradation in CMOS logic is measurably observable.
degradation (Q1)
Dependent on factors including switching activity (cannot be statically determined).
Manifesting faults (Q2)
Reducing V DD mimics aging. For example, a 50-mV (4.1%) reduction corresponds to predicting up to nine months in advance.
Exposing faults (Q3)
While in Aged-SDMR mode, timing faults indicate impending hard or soft breakdowns. Virtual aging induces timing faults at the rate of between 0 to 9.8%.
Detecting faults (Q4)
Faults introduced in Aged-SDMR mode translate to architectural errors and can be caught without escapes. Empirically, errors were seen in at least 0.02% of cycles and were caught within a few samples.
Estimating
Aged-SDMR has small area (8.9%), power (2.54%), and energy (0.7%) overheads.
overheads (Q5) Delay to predict (Q6)
We can guarantee an upper bound on Aged-SDMR’s prediction latency mathematically, based on defect and sampling rates. The longest latency to predict is 0.4 days.
When the technique does not work (Q7)
Aged-SDMR cannot predict faults that do not start as delay faults. For delay-based faults, missed sites are those that have high switching activity but do not affect the architectural trace (integer benchmarks might do this to the floating-point pipeline). If more than 0.4 days of life remain, Aged-SDMR will still predict correctly. Masking scenario is rare in commercial designs because power/value gating avoids unnecessary switching.
Comparison to
Aged-SDMR is comparable, if not better, on other metrics and also provides generality.
state-of-the-art methods (Q8)
Previous techniques do not provide generality and accuracy, leaving fast gates (30 to 40% of gates) uncovered.
Table 2. A comparison of Aged-SDMR and three state-of-the-art techniques Overheads Area (%)
Power (%)
Time to predict
Prediction horizon
Online wear-out prediction
4.6†
8.6†
4 days
2 years, 4 days
WearMon11
(14‡
Not reported
Varies
Not reported
Technique 9
FIRST10 Not reported 0 1 day 9 months, 1 day* Aged-SDMR 8.94 3.2 0.4 days 9 months, 0.4 days ................................................................................................................................... †
For every eight signals monitored. Rough estimates from field-programmable gate array use numbers reported by the authors. * Assuming a virtual aging mechanism similar to this work. ‡
............................................................
32
micro IEEE
bits with all 35 applications and computed it to be 0.278 and 0.2895. Even simply looking at distributions of wear out among the bits, we observe they sometimes follow a normal
distribution but with large differences in standard deviation and variance across benchmarks (see Figure 6b). These data measurements demonstrate the diversity and
IEEE MICRO
Previous Page | Contents | Zoom in | Zoom out | Front Cover | Search Issue | Next Page
M q M q
M q
M q MQmags q THE WORLD’S NEWSSTAND®
micro IEEE
Previous Page | Contents | Zoom in | Zoom out | Front Cover | Search Issue | Next Page
M q M q
M q
M q MQmags q THE WORLD’S NEWSSTAND®
substantiate two points—that the degradation is highly application dependent, and that degradation within the different cells of an SRAM block can vary significantly. Manifesting faults (Q2). As we demonstrated earlier, reducing VDD mimics aging (see Figure 3). Empirically, for example, a 45-mV reduction emulated 28 weeks of aging. Exposing faults (Q3) and detecting faults at a higher level (Q4). Figure 2d showed that the end effect of SRAM cell aging is read failure stability. By design, writing 1s and then reading them exposes the wear-out fault under virtual aging.
Delay to predict (Q6). Compared to logic, the delay to predict for SRAM is on the order of milliseconds, because the prediction happens in a single S-epoch and is application independent. The delay guarantees for logic are probabilistic and are for the worst case, because some sampling windows are required to guarantee overlap of the DMR window with a fault occurrence by the application. When the technique does not work (Q7). Failures in SRAM that do not start as read failures cannot be detected. Although these exist and include electromigration, for example, there is evidence that NBTI, which we cover, is dominant. Unlike the logic case, for device
(a)
175-vpr
429-mcf
456-hmmer
60 gzip vpr
50
mcf
Percentage of bits
Estimating overheads (Q5). In terms of area, there is practically no additional overhead— we simply reuse the existing BIST circuitry. In terms of performance slowdown, AgedAsymChk can be run quite infrequently. Because it predicts wear out without memory corruption and is 100 percent accurate, the only requirement is to run at periods less than the age mimicked by virtual aging, which is on the order of weeks. On the basis of our empirical data, the overhead of checking is pessimistically on the order of 1 million cycles. Even assuming that S-epochs are activated as often as every 100 context switches, which at a 5-ms OS scheduling quantum would be half a second, a 1-Ghz processor at one instruction per cycle would have negligible overhead (0.2 percent). Therefore, Aged-AsymChk introduces no significant performance, power, or area overhead to the system.
164-gzip
hmmer
40 30 20 10 0 0.0
(b)
0.1
0.2
0.3
0.4
0.5
0.6
0.7
0.8
IEEE
1.0
Normalized wear-out intensity
Figure 6. Application-level behavior of the wear out in the SRAM cells. (a) Visualization of the SRAM wear out in a 64-Kbyte data cache for four applications. Wear out of each SRAM cell depends on the application behavior. (b) SRAM cells distribution. A point (x, y) indicates that y percent of the bits in the SRAM have the wear-out intensity of x.
faults that adhere to the model, AgedAsymChk is 100 percent correct because it is based on the formal BIST model that can generate vectors with 100 percent coverage.
.............................................................
NOVEMBER/DECEMBER 2015
micro
0.9
33
Previous Page | Contents | Zoom in | Zoom out | Front Cover | Search Issue | Next Page
M q M q
M q
M q MQmags q THE WORLD’S NEWSSTAND®
micro IEEE
Previous Page | Contents | Zoom in | Zoom out | Front Cover | Search Issue | Next Page
M q M q
M q
M q MQmags q THE WORLD’S NEWSSTAND®
.............................................................................................................................................................................................. FAILURE PREDICTION
Table 3. Defect rates (parts per million) of SRAM arrays Defect rate for ECC (16 data bits, 6 ECC bits)
Defect rate for ECC (256 data bits, 10 ECC bits)
fc ðtÞ
Single failure
Single failure
Double failure
10"7
4,495
0
53,018
1
10"6 10"5
44,055 362,700
0 47
419,881 995,662
72 7,179
10"4
988,903
4,716
999,999
508,041
10"3
1,000,000
373,043
1,000,000
1,000,000
Comparison to state-of-the art methods (Q8) As we mentioned earlier, prior work does not provide low overhead, high accuracy, and low complexity. Quantitatively, Aged-AsymChk either eliminates silent data corruptions for baselines without ECC or it increases the array’s lifetime. We developed an SRAM array defect-rate model to show how we can extend the average proficient lifetime by 14 months, considering common wear-out patterns. We first used a fixed cell-failure model (excluding dynamic sources of wear out such as the application and temperature) and then extended those results, considering timevarying failure rates.
............................................................
34
micro IEEE
Double failure
Failure model preliminaries. Using basic probability, we built a simple analytical model for how wear out affects SRAM array failure. The key input was a cell’s read failure probability at a given time ðfc ðtÞÞ. (The read failure probability indicates the probability that a six-transistor SRAM cell has a read failure at a given time. For example, the read failure probability 10"7 indicates that one SRAM cell out of 107 cells has read failure.) We considered an SRAM made of n blocks and used cache-block granularity single-error correction and double-error detection ECC. We used two cache block sizes with k data bits and e ECC bits: (16, 6) and (256, 10). Also, we define the defect rate as the defective parts per million. Furthermore, the singlefailure defect rate considers one bit failure to be a defect, whereas the double-failure defect rate considers two failures (in a single block) to be a defect. ECC-only arrays are proficient only until the first error, at which point they must be decommissioned to prevent uncor-
rectable errors. Arrays with prediction capability are proficient until just before the second error, extending their lifetime. SRAM array model for fixed defect rates. We can build a defect rate model, based on the binomial probability model, for an SRAM array by calculating the failure probability of bits in a cache block ðfc ðtÞÞ, then the failure probability of blocks in the array. We consider both single-failure (Equation 1) and double-failure (Equation 2) cases below. fblock ; 1ðtÞ ¼ 1 " ð1 " fc ðtÞÞkþe fblock ; 2ðtÞ ¼ 1 " ½ð1 " fc ðtÞÞkþe
ð1Þ
farray ðtÞ ¼ 1 " ½ð1 " fblock;i ðtÞÞn +
ð3Þ
þðk þ eÞ=1 * fc ðtÞÞ * ð1 " fc ðtÞÞkþe"1 + ð2Þ
Equations 1 and 2 calculate the probability that one or two bits, respectively, in a given ðk þ eÞ-bit block are erroneous at a given time. Equation 3 finds the probability that one block in a given SRAM array made of n blocks is faulty at a given time. Table 3 shows the single- and double-failure defect rates for various cell failure probabilities ðfc ðtÞÞ and two extreme granularities of ECC. We can draw three implications from Table 3. First, as expected, fine-grained ECC has a lower defect rate. Second, at low cellfailure probabilities, the number of failures with only a single defect is orders of magnitude more than when allowing prediction. And third, schemes decommissioning arrays and cache blocks at first failure incur wasted lifetime: nearly 100 and 36 percent of coarseand fine-grained ECC, with fc ðtÞ ¼ 10"5 .
IEEE MICRO
Previous Page | Contents | Zoom in | Zoom out | Front Cover | Search Issue | Next Page
M q M q
M q
M q MQmags q THE WORLD’S NEWSSTAND®
Normalized fc
10 9 8 7 6 5 4 3 2 1
Previous Page | Contents | Zoom in | Zoom out | Front Cover | Search Issue | Next Page
Optimistic Linear Pessimistic
0
(a)
M q M q
M q
M q MQmags q THE WORLD’S NEWSSTAND®
Months of added life
micro IEEE
10
20
40 50 30 Age in months
60
70
35 30 25 20 15 10 5 0
(b)
Optimistic Linear Pessimistic
0
20 40 60 80 Percentage of SRAM arrays
100
Figure 7. Wear-out models and added life from effective prediction. (a) The (x, y) point indicates the read failure probability of an SRAM cell normalized to 10"6 (fc ðtÞ is y after x months). (b) The (x, y) point indicates that the lifetime of x percentage of total fabricated SRAM arrays is extended by y months.
Extending results for dynamic wear out. To quantify the wasted lifetime for SRAM arrays, we extend the model to include dynamic SRAM wear out, the primary effect of which is to cause fc ðtÞ to become time dependent (increasing over time). Our extended model must incorporate several issues. First, the wear out of different bits will vary, implying that a single fc ðtÞ no longer models the entire array. Second, depending on the SRAM’s usage, the fc ðtÞ changes to some value by the end of the SRAM array’s lifetime. Third, fc ðtÞ changes at some rate with time to reach this final value. Finally, we must determine when the array is single-failure defective or double-failure defective. These phenomenon are highly application dependent, and we make some simplifying assumptions to capture firstorder effects. First, we assume the highest fc ðtÞ of the bits in a block, thus providing a lower-bound estimate on wasted life. Second, we assume fc ðtÞ changes by one order of magnitude due to wear out—this has strong empirical evidence from circuit literature.3,12 Finally, to model the rate of change of fc ðtÞ, we consider reciprocal, linear change and exponential change as in Figure 7a. Linear change is likely the common case. Exponential and reciprocal represent the worst (pessimistic) case and best (optimistic) case for the benefits of our technique, respectively. We considered a 36-month period discretized at monthly granularity, and we assumed the second error occurs at the end of this period. We used fc ðtÞ at each month to calculate the defect rates, which determine how many arrays are wasted due to early
decommissioning based on the first failure. Figure 7b shows the dynamic wear-out model’s results in terms of months of added life for a percent of the SRAM arrays, which suggests two things. First, the lifetime can be extended significantly to 17, 14, and 7 months on average for the three scenarios. Second, significant fractions of SRAM arrays are improved by 95, 87, and 46 percent, respectively.
B
y providing a unified technique for error prediction in both logic and SRAM settings, which is low overhead and has high fault coverage, the Aged Full-Chip Predictor could serve as an important component for future fault-dominated technologies. The mechanisms behind the concepts of virtual aging and sampling are well understood and easy to implement, making the idea attractive and practical to deploy. One primary implication is that future designs can more aggressively provision the resources for recovering from soft errors (such as ECC in SRAMs), while relying on the Aged FullChip Predictor for the prediction and detection of hard errors. Looking forward, understanding the relationship between delay degradation and failure modes in far-out semiconductor technologies will be the key to using virtual aging to address future reliMICRO ability challenges.
.................................................................... References 1. A. Haggag et al., “Realistic Projections of Product Fails from NBTI and TDDB,” Proc. 44th Ann. IEEE Int’l Reliability Physics Symp., 2006, pp. 541–544.
.............................................................
NOVEMBER/DECEMBER 2015
micro IEEE
35
Previous Page | Contents | Zoom in | Zoom out | Front Cover | Search Issue | Next Page
M q M q
M q
M q MQmags q THE WORLD’S NEWSSTAND®
micro IEEE
Previous Page | Contents | Zoom in | Zoom out | Front Cover | Search Issue | Next Page
M q M q
M q
M q MQmags q THE WORLD’S NEWSSTAND®
.............................................................................................................................................................................................. FAILURE PREDICTION
2. A.W. Strong et al., Reliability Wearout Mechanisms in Advanced CMOS Technologies, vol. 12, Wiley-IEEE Press, 2009. 3. K. Kang et al., “Impact of Negative-Bias Temperature Instability in Nanoscale SRAM Array: Modeling and Analysis,” IEEE Trans. Computer-Aided Design of Integrated Circuits and Systems, vol. 26, no. 10, 2007, pp. 1770–1781. 4. A. Bansal et al., “Impacts of NBTI and PBTI on SRAM Static/Dynamic Noise Margins and Cell Failure Probability,” Microelectronics Reliability, vol. 49, no. 6, 2009, pp. 642–649. 5. T.T.-H. Kim and Z.H. Kong, “Impact Analysis of NBTI/PBTI on SRAM VMIN and Design Techniques for Improved SRAM VMIN,” J. Semiconductor Tech. and Science, vol. 13, no. 2, 2013, pp. 87–97. 6. S. Kothawade et al., “Mitigating NBTI in the Physical Register File through Stress Prediction,” Proc. IEEE 30th Int’l Conf. Computer Design, 2012, pp. 345–351. 7. S. Nomura et al., “Sampling þ DMR: Practical and Low-Overhead Permanent Fault Detection,” Proc. 38th Ann. Int’l Symp. Computer Architecture, 2011, pp. 201–212. 8. R. Balasubramanian and K. Sankaralingam, “Virtually-Aged Sampling DMR: Unifying Circuit Failure Prediction and Circuit Failure Detection,” Proc. 46th Ann. IEEE/ACM Int’l Symp. Microarchitecture, 2013, pp. 123–135. 9. J. Blome et al., “Self-Calibrating Online Wearout Detection,” Proc. 40th Ann. IEEE/ ACM Int’l Symp. Microarchitecture, 2007, pp. 109–122. 10. J.C. Smolens et al., “Detecting Emerging Wearout Faults,” 3rd IEEE Workshop Silicon Errors in Logic-System Effects, 2007; http://jared.smolens.org/documents/first________________________ smolens-selse07.pdf. ____________ 11. B. Zandian et al., “WearMon: Reliability Monitoring Using Adaptive Critical Path Testing,” Proc. 40th Ann. IEEE/IFIP Int’l Conf. Dependable Systems and Networks, 2010, pp. 151–160. 12. K. Kang et al., “Estimation of Statistical Variation in Temporal NBTI Degradation and Its
Amir Yazdanbakhsh is a PhD student in the School of Computer Science at the Georgia Institute of Technology and a research assistant in the Alternative Computing Technologies (ACT) Lab. His research interests include computer architecture, approximate general-purpose computing, mixed-signal accelerator design, machine learning, and programming languages for hardware design. Yazdanbakhsh has an MS in computer engineering from the University of Wisconsin–Madison and an MS in electrical and computer engineering from the University of Tehran. He is a student member of IEEE. Contact him at
[email protected]. ___________________ Raghuraman Balasubramanian is a digital design engineer at Google. His research interests include microprocessor architecture and circuit design. Balasubramanian has an MS in computer science from the University of Wisconsin–Madison, where he completed the work for this article. Contact him at
[email protected]. _________________ Tony Nowatzki is a PhD student in the Department of Computer Sciences at the University of Wisconsin–Madison and a member of the Vertical Research Group. His research interests include architecture and compiler codesign and mathematical modeling. Nowatzki has an MS in computer science from the University of Wisconsin– Madison. He is a student member of IEEE. Contact him at
[email protected]. __________ Karthikeyan Sankaralingam is an associate professor in the Department of Computer Sciences and the Department of Electrical and Computer Engineering at the University of Wisconsin–Madison, where he also leads the Vertical Research Group. His research interests include microarchitecture, architecture, and very large-scale integration. Sankaralingam has a PhD in computer science from the University of Texas at Austin. He is a senior member of IEEE. Contact him at
[email protected]. ___________
Impact on Lifetime Circuit Performance,” Proc. IEEE/ACM Int’l Conf. Computer-Aided Design, 2007, pp. 730–734.
____________ _______
............................................................
36
micro IEEE
IEEE MICRO
Previous Page | Contents | Zoom in | Zoom out | Front Cover | Search Issue | Next Page
M q M q
M q
M q MQmags q THE WORLD’S NEWSSTAND®