runs as a Linux kernel module, based on the user-level DynamoRIO framework. ..... such, it exports an API for use by cli
Comprehensive Kernel Instrumentation via Dynamic Binary Translation Peter Feiner
Angela Demke Brown
Ashvin Goel
University of Toronto {peter,demke}@cs.toronto.edu,
[email protected]
Abstract Dynamic binary translation (DBT) is a powerful technique that enables fine-grained monitoring and manipulation of an existing program binary. At the user level, it has been employed extensively to develop various analysis, bug-finding, and security tools. Such tools are currently not available for operating system (OS) binaries since no comprehensive DBT framework exists for the OS kernel. To address this problem, we have developed a DBT framework that runs as a Linux kernel module, based on the user-level DynamoRIO framework. Our approach is unique in that it controls all kernel execution, including interrupt and exception handlers and device drivers, enabling comprehensive instrumentation of the OS without imposing any overhead on user-level code. In this paper, we discuss the key challenges in designing and building an in-kernel DBT framework and how the design differs from user-space. We use our framework to build several sample instrumentations, including simple instruction counting as well as an implementation of shadow memory for the kernel. Using the shadow memory, we build a kernel stack overflow protection tool and a memory addressability checking tool. Qualitatively, the system is fast enough and stable enough to run the normal desktop workload of one of the authors for several weeks. Categories and Subject Descriptors D.3.4 [Programming Languages]: Processors—Code generation, Run-time environments, Incremental compilers; D.2.5 [Software Engineering]: Testing and Debugging—Debugging aids, Monitors; D.4.m [Operating Systems]: Miscellaneous General Terms Design, Performance Keywords Dynamic binary translation, operating system instrumentation, Linux, interrupts
1.
Introduction
Dynamic binary translation (DBT) entails monitoring and potentially manipulating every instruction in an existing binary before its execution. Several popular frameworks, such as DynamoRIO [5], Pin [16], and Valgrind [17] support the development of powerful tools for program analysis, debugging, and security. For example, DBT is used by Valgrind’s Memcheck tool to detect memory refer-
Permission to make digital or hard copies of all or part of this work for personal or classroom use is granted without fee provided that copies are not made or distributed for profit or commercial advantage and that copies bear this notice and the full citation on the first page. To copy otherwise, to republish, to post on servers or to redistribute to lists, requires prior specific permission and/or a fee. ASPLOS’12, March 3–7, 2012, London, England, UK. c 2012 ACM 978-1-4503-0759-8/12/03. . . $10.00 Copyright
encing errors [22], by DynamoRIO’s Program Shepherding to improve security [13], and by vx32 to enforce modularity [12]. Currently, these tools cannot be applied to operating system binaries, since there is no comprehensive DBT framework for the kernel. Motivated by the ever-growing size and complexity of kernel code, the importance of its correctness for overall robustness and security, and the continued prevalence of kernel bugs despite advances in static bug-detection tools, we have developed an in-kernel DBT framework. The main contribution of our work is showing how to make DBT work for arbitrary devices and their drivers. Previous attempts recognized the value of DBT for kernel code, however they did not instrument important parts of the kernel or are limited to certain device drivers. For example, JIFL [19] only instruments code executed during system call handling; it does not cover interrupt handlers or kernel threads such as the Linux flusher threads that write dirty pages back to disk. PinOS [8] instruments all kernel code (including kernel threads and interrupt handlers) and user code running in a virtual machine. However, PinOS is incapable of instrumenting code that cannot run in a virtual machine, in particular, drivers for devices that the virtual machine monitor (VMM) does not support. Because VMMs support a small selection of devices by emulating hardware, most driver code cannot be debugged or secured with PinOS – an unfortunate limitation because drivers comprise a significant fraction of the code and the bugs in operating systems [11, 20]. A similar limitation exists with other VMMs [1] and emulators [23] that use DBT. We identified four primary goals for a kernel DBT framework: 1. Provide full coverage of kernel code, including kernel threads, interrupt and exception handlers, and all native device drivers. This is essential to support existing techniques such as Program Shepherding and Memcheck. 2. Impose no direct overhead for user code. While whole-system instrumentation has its uses, it also has high overheads as demonstrated by PinOS. Since many applications spend little time executing in the kernel, the usability of the system will be greatly enhanced if user code is not impacted. 3. Preserve original concurrency and execution interleaving. To detect the full range of concurrency-related bugs that can arise during native execution, we must interfere minimally with thread scheduling or the points where interrupts can occur. We must be able to use all native CPU cores that are present, and be able to support kernel preemption. 4. Be transparent. Original kernel code may behave differently or break if it observes the state of the instrumented system, rather than the expected native state. This concern is common to all DBT frameworks, and is explained in more detail in the following section.
Each of these goals presents its own challenges, but the key difficulty is in achieving all of them simultaneously, as we will discuss in Section 3. For example, the first goal requires our framework to maintain full control during all kernel execution, while the second one requires us to relinquish control when execution leaves the kernel. Naturally, this means that we must detect all kernel entry and exit points, and attach and detach our DBT framework correspondingly. User-space frameworks also support this ability to attach and detach during execution, however it is expected to be a rare event. In contrast, we expect frequent entries and exits, relative to the amount of time running in the kernel. A similar tension arises between providing full coverage while preserving the original execution interleavings. Typically, DBT frameworks control the points where signals (the user-space analog of interrupts) can occur because it simplifies many aspects of the implementation. It is tempting to take the same approach in the kernel, but as we will show, interrupt delivery cannot be controlled in the same way when we have full coverage of the interrupt handlers and all native device drivers. Our approach has been to start with the user-level DynamoRIO DBT framework and transform it to run as a Linux kernel module; we call this module DRK. We chose to start with DynamoRIO because it is available as an open source project, and is full-featured, robust and high-performing. No other existing DBT framework that we are aware of meets these requirements. We do not require any kernel modifications, so DRK can instrument any Linux kernel and can handle binary-only device drivers. The DRK module can be run on either native operating systems (i.e. those that run on bare metal) or in a virtualized environment, since we do not make use of any hardware virtualization features. Thus, DRK can be deployed to instrument systems running in the cloud, an increasingly common scenario. To help understand our work, we begin with some background on DynamoRIO in Section 2. Once initialized, DRK redirects all kernel entry points to itself, giving it full control over kernel execution. Wherever possible, we have chosen to port the existing DynamoRIO code to the kernel environment in the interests of getting experience with a working framework to guide future enhancements. Some key aspects, however, required different techniques to work in the kernel. Section 3 describes the design decisions we made, highlighting the differences of DRK over DynamoRIO. The “devil in the details” of the implementation can be found in Section 4. We evaluate the overhead of the framework and simple instrumentation clients in Section 5. We have only recently started to explore tools that are enabled by DRK. We describe a number of these in Section 6, ranging from simple ones (i.e., instruction and basic block profiling) to more sophisticated ones (i.e. an addressability checker and a stack overflow checker) that make use of a new shadow memory implementation for the kernel. We discuss related work in Section 7, and conclude in Section 8.
2.
DBT Background
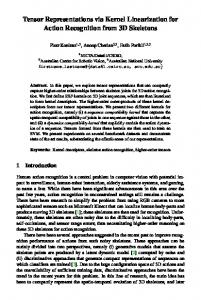
In this section, we give a brief overview of dynamic binary translation in general, and DynamoRIO in particular. Figure 1 illustrates the basic operation of a DBT framework. Two primary requirements govern the operation of any DBT system. First, all execution must be controlled by the DBT system. If native code is ever allowed to execute without first being translated by the DBT, it could perform arbitrary memory accesses and branches, defeating any analysis, security or debugging tools and making it impossible for the DBT framework to regain control. Second, the presence of the DBT framework must be transparent to the instrumented code, meaning that the behavior of the instrumented code must be the same as would have occurred on the native system. Existing DBT frameworks have varying degrees of transparency. For exam-
Start
x86 Binary Code
Dispatcher: save native state lookup target cached? Yes
No
direct branch? Yes No
Copy Block: • translate instructions • get client instrumentation
Instrumentation Client
Patch block: • link previous basic block directly to target in cache
restore native state enter code cache
Code Cache:
Figure 1. Basic operation of DBT framework. ple, some will store their own state on the same stack used by the instrumented code to increase performance. On the other hand, DynamoRIO makes great efforts to be transparent; the authors of that system found this feature to be essential for instrumenting more complex Windows applications. Dynamic binary translators achieve reasonable performance by caching translated blocks of native code (i.e. the binary x86 instructions that the program counter normally points to) and re-executing them from a code cache. This allows the overhead of decoding the binary instructions and performing analysis and instrumentation to be amortized over a large number of uses of the cached block. Blocks typically begin at the target of some control transfer instruction (e.g., branch, call, return) and end at the next control transfer instruction (CTI) in the sequence. Thus, these units of cached code are sometimes referred to as dynamic basic blocks or simply basic blocks. Unlike conventional basic blocks, however, code within a dynamic basic block may be the target of a control transfer instruction. In this case, a new basic block is started when execution branches to the target, and the code between the newly-discovered target and the end of the basic block is duplicated in the code cache. These replicated tails increase the size of the cached code relative to the native code being translated. To ensure that native code never executes, the CTIs that terminate basic blocks are manipulated to return control to the dispatcher component of the DBT framework. If the native CTI’s target has already been copied into the cache, the dispatcher transfers control to the target’s copy. Otherwise, the dispatcher interprets the target’s code, which involves finding the extent of the basic block starting at the target’s address, translating it, and copying the new basic block into the code cache. Finally, the dispatcher transfers control to the newly admitted block. Control transfers between the code cache and the framework are costly, because the state of the native code must be saved and restored to preserve transparency. To reduce the frequency of these context switches, DynamoRIO and other DBT frameworks perform additional optimizations. When the dispatcher is entered from the code cache, it checks if (a) the previous basic block ended with a direct branch and (b) the target is already in the code cache. If so, the code cache copy of the previous basic block is patched to jump directly to the target in the code cache, thereby eliminating any future exits to the dispatcher between these two basic blocks. Indirect control transfers (e.g. indirect branches and function returns) cannot be linked directly to the target in the code cache, because they can have multiple targets. In the original program, these targets would be stored in memory that is read and written by the
native code (e.g. the return address of a function call is pushed on the stack and popped upon return). To maintain transparency, the DBT framework must ensure that the native code sees the original values in its memory when it executes. For example, the original code may include checks on the values of function pointers, to ensure that they point to expected functions. If the checking code were to read the code cache addresses of the translated functions instead, it might conclude that the function pointers had been corrupted and execute some recovery path that should not actually be taken. Instead, the native addresses of indirect branch targets must be translated to their corresponding code cache address by the dispatcher. DynamoRIO uses a fast hash table lookup in this case. A further optimization links sequences of basic blocks that are frequently executed together into traces. Several heuristics for trace selection have been explored, but DynamoRIO uses the Next Executing Tail (NET) heuristic pioneered by the HP Dynamo project [3]. DynamoRIO also maintains separate caches for basic blocks and for traces, but refers to units of code in either one as fragments. We do not cover traces in more detail because we have not yet applied this optimization to our kernel DBT implementation (DRK). Finally, DynamoRIO was designed as a framework upon which to build dynamic instrumentation or optimization tools. As such, it exports an API for use by clients, which specify the transformations to be applied to blocks of code during translation. The client API includes callbacks to be invoked when the main framework encounters events of interest, such as the creation of a new basic block to be added to the code cache. The framework also invokes a client callback to handle any synchronous exceptions that occur during the execution of client-added instrumentation from the code cache.
3.
Architecture/Design
In this section we describe how DRK meets the goals laid out in Section 1. To do so, we discuss several challenges, mention some alternatives, and explain the solutions that we chose. We start with the simpler issues, before addressing the most challenging one, namely interrupts. 3.1
Detecting Kernel Execution
Our first goal of comprehensive coverage, needed for various security and memory checking tools, requires interposing on all code running in the kernel. Together with our second goal of no direct overhead for user-level code, this requires us to detect and interpose on all kernel entry points and relinquish control at all kernel exits. Interposing on all kernel execution requires each kernel entry point to be replaced with a call to the dispatcher (see Figure 2). Normally, these entry points are stored in descriptor tables in memory, with the address of each table stored in a dedicated hardware register. To execute the dispatcher on kernel entry points, instead of executing the original entry point code directly, we maintain a shadow descriptor table for each descriptor table maintained by the kernel; we point the descriptor table registers to these shadow tables. In the shadow tables, each entry effectively calls dispatch on the corresponding entry point stored in the original descriptor table. Section 4.1.2 gives details on how we take control of kernel entry points. In our current implementation, we have chosen to relax transparency in this case. That is, native code executing from the code cache that reads the hardware table descriptor registers would be able to observe that they point to DRK memory locations, rather than the original tables. To maintain transparency, native code instructions that read the descriptor table registers should be replaced with code cache instructions that load the original tables’ addresses, which are stored in memory. The original tables should be writeprotected so that changes can be detected and propagated to the
Kernel Binary Code
System Call HW Register
Interrupt and Exception Handler Descriptor Tables
HW Register
Dispatcher: Save state Cached?
No
Copy Block
Instrumentation Client
Yes
direct branch? Yes Patch block No
restore state enter cache
DRK Heap
Code Cache:
Interrupt
Figure 2. Schematic of DRK design. Dashed arrows indicate control flow that is triggered by hardware events such as system calls or interrupts. shadow tables. Finally, translated code that changes the table descriptor registers in the code cache should be replaced with instructions that update the shadow registers in memory. In the Linux kernel, these tables are all initialized at boot time and not modified thereafter. As a result, we have not found any cases where this loss of transparency creates a problem in the Linux kernel. Kernel exits are identified during fragment creation, since they are caused by the execution of specific instructions (e.g., sysexit, sysret, iret). Section 4.2.1 explains how we detach and resume native execution in user mode. Compared to whole-system instrumentation, our design imposes no direct overhead on code executing in user mode. However, running kernel code under control of DRK may impose indirect costs due to potentially increasing cache and TLB misses. 3.2
Reentrancy
The problem of reentrancy arises for a DBT framework when its own interpretation code uses native code that it is in the middle of interpreting, for example, to perform heap allocation or I/O. DBT frameworks avoid this problem by only using code that they do not interpret, i.e., their own code and the systems beneath them. Because the user-space frameworks do not interpret kernel code, they can safely make system calls. A VMM-based approach, such as PinOS, can make use of the VMM itself and virtual machines other than the one being instrumented (e.g., PinOS performs all I/O through Xen’s Domain 0 guest). This approach is not available to us since there is no lower-level uninstrumented code that we can invoke. JIFL addressed the reentrancy problem by implementing its own heap management routines, and by detaching itself before calling the original I/O functions of the kernel. Detaching during I/O is not an acceptable option for DRK, since we aim to be comprehensive. In our design, we avoid problems with reentrancy by making the dispatcher self-contained. Like JIFL, we allocate a large chunk of memory during initialization and implement our own heap allocator to manage this memory while DRK is running. The I/O problem is harder, since we cannot easily “push” data out of DRK without invoking functions that we are instrumenting. We solve this by adopting a “pull” model for I/O instead. We provide DRK functions that can be invoked by instrumented code (and are themselves instrumented). These functions simply copy data from DRK into a buffer supplied by the caller. In this way, user-level programs can be written to pull data out of DRK, and then use any of the normal I/O facilities (which will all be instrumented in the kernel) to display the data on screen, save it to a file, or send it out over the network. We explain how this works with standard Linux facilities in Section 4.1.1.
3.3
Preserving concurrency
To handle multithreaded code correctly, DBT frameworks must ensure that the dispatcher and execution in the code cache behave in a thread-safe manner. Concurrency problems arise in the dispatcher when it is used by multiple threads. For example, updates to shared data structures, such as the map of native-code addresses to codecache addresses, cannot conflict. Concurrency problems arise during code cache execution because the translated code in the cache contains accesses to data structures that are shared with the dispatcher (e.g., to spill native register values when registers are used by instrumentation code, and to restore them when they are needed by the native code). In user-space frameworks, two approaches are generally taken to managing concurrency: locking accesses to shared data or using thread-private data1 . Although shared code caches and data structures use less memory and avoid redundant interpretation and copying, the overhead of locking and the mutual exclusion that it enforces can seriously perturb the original thread interleaving. In the thread-private data approach, each thread has its own private code cache and auxiliary data structures. Thus, threads are not forced to synchronize in ways other than in the original code. In practice, use of thread-private data is only suitable for programs with a small number of threads or programs in which threads access disparate code, such as desktop applications [6]. Because many threads run inside the kernel (i.e., all user and kernel threads), using thread-private data would have prohibitive memory and interpretation overheads. A kernel DBT framework like DRK has another concurrency management technique at its disposal: CPU-private data (without control over preemption points, user-space frameworks cannot reliably use CPU-private data). Each CPU has its own private code cache and auxiliary data structures. This approach avoids locking while bounding redundant interpretation and copying. We adopt the CPU-private approach. To support kernel preemption when using CPU-private data, care must be taken to ensure that no CPU-private state is saved in non-CPU-private locations when the preempted task context switches. Otherwise, if the preempted task later resumes on another CPU, it will use the wrong CPU’s private data. Two scenarios can cause CPU-private state to be exposed. First, interrupt handlers can inspect the register state that was saved when the interrupt occurred. Thus, a register that temporarily holds CPU-private data may be exposed to the native interrupt handler. We avoid this problem by restoring native machine state before delivering interrupts and exceptions. Second, a DBT system may store CPU-private code cache addresses on the native stack to improve performance. We avoid this problem by always storing native code addresses, and not code cache addresses, on the native stack: we emulate call and ret by pushing and popping native addresses and calling the dispatcher. We further ensure that the interrupt stack contains native addresses when the native handler executes. Although JIFL also used CPUprivate data and code caches, it did not work with preemptible kernels because it did not interpose on interrupt handlers, and therefore allowed CPU-private data to be exposed. 3.4
Interrupts and Exceptions
The way we handle interrupts and exceptions has an impact on most of our goals for DRK2 . Comprehensiveness requires instrumenting exception and interrupt handlers. Using CPU-private data to manage multicore systems requires extra care to avoid exposing CPU-private data to another CPU following interrupts, as we discussed in the previous subsection. In addition, preserving con1 Valgrind 2 Our
simply serializes all thread execution. goal of not instrumenting user code is the exception to this.
currency means that we should allow interrupts to be delivered at all the points where they would normally occur in the native code. Finally, to be transparent, we must ensure that native interrupt and exception handlers observe machine state that could have occurred natively, rather than the DRK state. We define interrupts to be asynchronous events, not caused by any particular instruction, that redirect execution to their handlers. We define exceptions to be synchronous events, triggered by instruction execution, that immediately invoke their handlers. The key distinction between the two is that interrupts can technically be handled at any time whereas exceptions must be handled before the triggering instruction can proceed. For example, an instruction that accesses memory and triggers a page fault exception cannot complete until the page fault is handled. In either case, we interpose on the native handlers by pointing the appropriate hardware registers at our own descriptor tables, as illustrated in Figure 2. Because handlers can inspect machine state that was saved before their invocation (generally stack memory and registers), DBT frameworks must take care to present plausible machine state – i.e., machine state that could have been observed during native execution. This precaution is essential for correct execution. For example, Linux’s page fault handler intentionally panics if a page fault exception arises in the kernel unless the triggering instruction has a pre-allowed address [4]. Under the control of a DBT framework, the pre-allowed instruction never executes – only its copy in the code cache. Hence, to avoid causing a kernel panic, the interposing handler has to translate the code cache address of the faulting instruction to the native instruction’s address before invoking the kernel’s page fault handler. Presenting plausible machine state is tricky, particularly if an interrupt or exception arises during the execution of instrumentation code or the dispatcher. In this case, the interrupted instruction has no corresponding native code, thus translation to the native code address is impossible. Below, we describe how DRK handles exceptions and interrupts that occur during instrumentation code and dispatcher execution. Exceptions triggered by instrumentation code are handled by restoring native machine state – analogous to how x86 hardware delivers precise exceptions [2] – and invoking the instrumented copy of the original handler. DynamoRIO requires framework clients to implement callback functions that translate machine state when exceptions arise during instrumentation code. These callback functions restore registers used by the instrumentation code and provide a native code address for the faulting instruction. We impose the same requirement on instrumentation writers in DRK. Like other DBT frameworks, we only expect exceptions in the dispatcher while interpreting code. In this case, the dispatcher admits a copy of the code up to the exceptional instruction into the code cache and executes that copy before invoking the instrumented exception handler. To prevent page fault exceptions while fetching dispatcher and code cache instructions, the dispatcher and code cache are stored in page frames that are always present in all processes’ page tables. Asynchronous interrupts are harder to deal with. Because they can arise at any point, writing instrumentation callbacks to restore native machine state is intractable in general. Imposing this requirement would make it impossible to write many interesting instrumentation tools. To circumvent this problem, user-space DBT frameworks queue signals (the user-level analog of asynchronous interrupts) and deliver them at the next code cache exit, when the native state is known. Imposing such a delay is contrary to our goal of preserving the original execution interleaving. However, even if we were willing to compromise on this goal, there is a more fundamental problem. When executing instrumented native kernel code, some of the in-
structions running from the code cache may observe or modify the hardware interrupt delivery state (e.g. by executing certain instructions such as CLI or POPF or by reading or writing device registers using memory mapped I/O). This can cause the hardware state to appear inconsistent to the instrumented code, since interrupts are being queued by DRK and have not yet been seen by the native handlers. In addition, by the time we reach the next code cache exit, the deliverability of the interrupt may have changed from the time when it was queued (e.g., the OS has disabled interrupts and thus expects that they will not be delivered). Since we want to handle the full diversity of native hardware devices and drivers, trapping and emulating all instructions that might affect interrupt delivery becomes enormously complex. The difficulty is exacerbated by the need to do checks atomically with respect to other interrupt delivery, and to ensure that queued interrupts are delivered in the right order (respecting their priority levels). A VMM-based solution, like PinOS, has the advantage of only needing to manage the virtualized devices provided by the underlying hypervisor. Indeed, PinOS takes the approach of queuing interrupts, just like the user-space Pin framework. This, however, precludes instrumenting the native device drivers. We chart a middle course instead of always delaying interrupts or always delivering them immediately. While executing from the code cache, we delay the delivery of interrupts only until the next native instruction boundary. This delay allows us to emulate the behavior expected of precise interrupts (i.e. the interrupted instruction is either committed or removed, but is not seen to have partially executed), thus preserving transparency. Since no native instruction executes between the arrival of the interrupt and the dispatch of the native handler, we ensure that there is no inconsistency between the native software and hardware state. Furthermore, we delay interrupts over any instrumentation, thus side stepping the problem of rolling back arbitrary instrumentation instructions. Upon return from the native interrupt handler, we invoke the dispatcher on the address of the interrupted native instruction. This dispatch can cause a new basic block to be emitted into the code cache, beginning with the interrupted instruction and replicating the remaining instructions in the original basic block. These interrupt tails have the potential to cause bloat in the code cache, but in practice we have not observed it to be a serious problem. We disable interrupts while executing in the dispatcher, both because there is no corresponding native state and because the dispatcher is not itself reentrant. Before entering the code cache, we restore the native interruptability state. Because handling interrupts correctly involves many tricky corner cases, we explain our strategy in detail in Section 4.2.2 3.5
Code Cache Consistency
To faithfully emulate the native execution of the code being instrumented, a DBT framework must ensure that the code cache is kept consistent with native code. If some native code is modified after it has been copied into the cache, then the cached code is no longer valid. Likewise, if some native code becomes non-executable, then any cached blocks derived from it are no longer valid. Reliably detecting when native code and permissions change is a complex matter. Consequently, different frameworks maintain code cache consistency to various degrees (DynamoRIO, Valgrind, PinOS) or have no details published (JIFL, Pin, vx32). We do not maintain code cache consistency in our current implementation. The various problems that can arise with inconsistent caches are fundamentally of two types. The first is problems due to code changes. The second is problems due to page mapping changes. Both can be addressed using shadow page tables, which we have not yet implemented. Despite this limitation, the Linux kernel runs stably when instrumented by DRK, because runtime
code modification and page mapping changes for kernel code are rare events in Linux. Runtime code modification happens mainly during system boot and is already complete by the time our module loads. Other runtime modifications happen when the number of CPUs is dynamically reduced to a single CPU (to remove locking costs that are no longer needed), but we expect this is also a rare occurrence. The other problematic case occurs with module unloading, since cached copies of the unloaded module code should also be invalidated. These specific problems could be handled without shadow page tables, by detecting the relevant module unload or CPU change events, and flushing the code cache. This heavyweight solution would be acceptable for events that occur rarely. 3.6
Transparency Limitations in DRK
DRK is not fully transparent. However, it is transparent in places that matter to the native kernel code that we are instrumenting. As noted previously, native code could observe the addresses of DRK’s shadow descriptor tables by reading the hardware registers that point to them. Also, DRK’s lack of code cache consistency is essentially a transparency issue. In addition, since we do not have shadow page tables, native code could observe some inconsistencies in its page tables. For example, suppose some thread executes code from a newly-loaded module, causing it to be loaded into the code cache. Another thread running later on the same CPU will be able to execute the cached copies of those pages, even though its own top-level page table may be missing a mapping for the native module code address. We have not encountered any native Linux code that is affected by this inconsistency. With additional implementation effort, all of these issues could be addressed, but it has not been necessary to do so at this point.
4.
Implementation of Framework
As we described in Section 3, DRK operates as a loadable kernel module which hijacks all kernel entry points to redirect execution to itself. We now describe the details of how this works in the Linux kernel, beginning with the initialization steps, and normal operation. We then take a detailed look at how we handle exceptional control flow, namely interrupts and exceptions. 4.1
Initialization
The module’s initialization is divided into two phases: kernel and CPU initialization. During kernel initialization, the module directly invokes Linux code to make kernel requests; this is the only time the module uses possibly non-reentrant Linux code. These requests include memory allocation for DRK’s heap and creating ioctl interfaces and sysfs entries for I/O with user space. The module’s final request is for the kernel to begin the CPU initialization phase by calling a function on each processor via an inter-processor interrupt. 4.1.1
Kernel Initialization
DRK allocates memory for its heap using Linux’s vmalloc memory allocator. When vmalloc returns, Linux ensures that physical pages for the memory request are allocated and mapped into the current process’s page table and all newly created processes’ page tables, but it does not ensure that all of these pages are mapped into other existing processes’ page tables. In normal execution, Linux handles vmalloc page faults transparently by mapping in the missing page and resuming execution. However, DRK cannot use Linux’s page fault handler because of reentrance and comprehensiveness. So, after getting the memory from Linux, DRK iterates through all of the existing processes and to check that its memory is mapped in all of them. In our current system, this check always succeeds, so we have not yet implemented code to install any missing mappings during initialization.
DynamoRIO requires its heap to be located within 2GB of its text and data segments so that generated code can refer to DynamoRIO symbols using PC-relative addresses (i.e., specified by a signed 32-bit offset from the PC). However, normally on x86-64, Linux allocates virtual addresses for vmalloc’d memory some 55TB away from the virtual addresses used to allocate module memory (i.e. module text and data). Thus, DRK cannot obtain memory directly from vmalloc while still meeting the requirements of DynamoRIO. Instead, DRK uses the special module alloc interface, which returns vmalloc’d memory that is close enough to its text and data. I/O is accomplished asynchronously by copying memory. During initialization, the DRK module and its instrumentation clients create sysfs entries for their outputs. A sysfs file provides usermode programs with a standard file interface that they can read from and write to. When a user program reads from a sysfs file, Linux calls the file’s registered callback function with a buffer for the output. The DRK callback functions simply copy the requested output from DRK’s memory. For example, the instrcount instrumentation (described later in Section 5.1) keeps a CPU-private dynamic instruction count. When a user call reads from /sys/module/instrcount/dynamic/cpu0, cpu0’s instruction count is copied into the supplied buffer. 4.1.2
CPU Initialization
One CPU is arbitrarily designated as the main CPU. The main CPU executes DynamoRIO’s main initialization routine, which sets up global resources like the heap, and waits to continue. After the main CPU has initialized the global resources, the other CPUs call DynamoRIO’s thread initialization routine, which creates threadspecific resources like per-CPU code caches. As a part of each CPU’s initialization, the kernel entry points are replaced with calls to the DRK module. The 64-bit x86 architecture permits entry into the kernel via interrupts, system call instructions (syscall and sysenter), and certain far call and jmp instructions [2] (see [21] for a more concise explanation than [2]). However, the Linux kernel only enables entry via system calls and interrupts. For syscall and sysenter, the entry point is stored in a model-specific register (MSR). DRK can optimize these entry points because execution must have been in userspace prior to a system call entry (i.e. not already in the kernel). During initialization, DRK overwrites the system call MSRs with the addresses of fragments that are created from their native contents. For interrupts, the entry point for each interrupt vector is stored in the interrupt descriptor table, which is pointed to by the interrupt descriptor table register (IDTR). To redirect execution to the DRK module on interrupts, DRK replaces the native IDTR with a pointer to its own table of DRK interrupt entry points. Unlike the system call entry points, DRK cannot simply redirect interrupt entry points to fragments built from the corresponding native interrupt entry points. As described in Section 3, either the dispatching of interrupt handlers has to be delayed or the machine state has to be manipulated, or both, in some cases. To handle this requirement, the DRK interrupt descriptor table redirects all interrupt entry points to the same routine, which is described by the algorithm H ANDLE I NTERRUPT in Figure 3. Section 4.2.2 describes the algorithm in detail, but first we show how DRK operates during normal control flow. 4.2 4.2.1
Running Normal Operation
When execution enters the kernel, DRK operates like userspace DBT frameworks, as described in Section 2. The dispatcher determines the extent of the next basic block of native code, creates
a fragment from a copy of that code with client-added instrumentation, emits the fragment into the code cache, and enters the code cache by context switching to the beginning of the fragment. When execution reaches the end of a fragment, the target of the native control transfer instruction that terminated the block of native code determines the next address to dispatch on. DRK applies standard optimizations to avoid context switches: fragments ending in direct branches are directly linked to their target fragments and fragments ending in indirect branches are indirectly linked to their targets via a fast hash table lookup. When execution reaches a kernel exit point, DRK executes the exit instruction from a native context, thus returning to native usermode execution. When creating fragments, DRK recognizes instructions that might cause exits. Instructions that always exit the kernel (i.e., the system call return instructions sysret and sysexit) are simply copied into the code cache; when execution arrives at the end of the fragment with a system call return, the CPU will already be in a native context. Instructions that conditionally exit the kernel (i.e., the interrupt return instruction iret) are translated to return control to the dispatcher. In the dispatcher, DRK determines if the interrupt return is going to the kernel or to usermode based on the privilege level of the interrupted context stored on the interrupt stack frame. If the kernel was interrupted, then DRK treats an interrupt return like any other indirect control transfer: the interrupt stack frame is popped off of the stack and the interrupted instruction address is dispatched on. If usermode was interrupted, then DRK context switches and executes the interrupt return instruction natively.
4.2.2
Exceptional Control Flow
When an interrupt or exception arrives, DRK needs to arrange for its native handler to be run through the dispatcher. In this discussion we use the term “interrupt” to refer to both asynchronous interrupts and exceptions; we use the more precise term when a distinction needs to be made between them. DRK must ensure that the native handler runs while the computer is in a state that could be observed natively. As explained in Section 3, the pertinent observable native state comprises registers, relevant memory (such as return addresses stored on the stack), and the state of interrupt-generating hardware. Natively, x86 guarantees precise interrupt delivery: an interrupt will arrive only on instruction boundaries; all instructions have either executed entirely or not at all before the handler is invoked. However, because native instructions may be translated into multiple code cache instructions to emulate their operation, interrupts will sometimes arrive when native instructions have been partially emulated. To emulate precise interrupt delivery, DRK simulates delivering interrupts on native instruction boundaries by either recreating native state at a native instruction boundary or delaying the interrupt until the end of the partially executed translation. Although most translations simply copy the native instruction, others are complex, namely the translations of native control transfer instructions, which involve the dispatcher. DRK’s interrupt handler determines what translation was interrupted and the appropriate action to take. Because correct interrupt emulation is extremely tricky, we describe the different cases in detail. The algorithm for handling interrupts is presented in Figure 3. When an interrupt arrives, the hardware disables asynchronous interrupts, pushes an interrupt stack frame, and redirects execution to DRK’s interrupt handler. The interrupt stack frame contains information about how to return to the interrupted instruction, in particular, the interrupted instruction’s address and a flag indicating whether or not the CPU had asyn-
H ANDLE -I NTERRUPT(ISF , REGS , vector ) 1 Hardware pushes interrupt stack frame ISF 2 Switch stacks and save pre-interrupt registers REGS 3 Interrupts-Were-Enabled = ISF. interrupts enabled 4 Invoke client’s interrupt instrumentation 5 if Client handled interrupt 6 goto 35 7 elseif Interrupted in user space 8 D ISPATCH(NATIVE -H ANDLERS[vector ], REGS ) 9 elseif Interrupted in fragment F on instruction I 10 Determine source S of I 11 if Interrupt is an exception 12 Recreate native register state REGS 13 goto 31 14 elseif S is a control transfer instruction 15 Unlink F 16 goto 33 17 elseif S is a native instruction 18 goto 12 19 elseif S is an instrumentation instruction 20 Determine next instruction N following S with a native source 21 Patch start of translation for N to return to dispatcher 22 goto 33 23 elseif Interrupted during indirect branch lookup 24 Patch last instruction of lookup routine to return to dispatcher 25 goto 33 26 elseif Interrupted while exiting code cache 27 goto 33 28 elseif Interrupted while entering code cache 29 REGS = registers saved during last code cache exit 30 goto 31 31 Pending-Vector = vector 32 D ISPATCH(NATIVE -H ANDLERS[vector ], REGS ) N.B. D ISPATCH does not return. 33 Pending-Vector = vector 34 Disable interrupts on ISF 35 Switch stacks and restore registers REGS 36 Pop ISF 37 Return to interrupted code cache instruction D ISPATCH(TARGET , REGS ) 1 if Pending-Vector 6= NULL 2 Relink fragment or unpatch code if necessary 3 Push interrupt stack frame ISF for TARGET and REGS 4 ISF. interrupts enabled = Interrupts-Were-Enabled 5 T ARGET = NATIVE -H ANDLERS[Pending-Vector ] 6 Pending-Vector = NULL 7 Enter code cache at fragment for TARGET and restore REGS Figure 3. Interrupt handling algorithm. H ANDLE -I NTERRUPT shows DRK’s interrupt handler and D ISPATCH shows the relevant parts of the dispatcher. chronous interrupts enabled prior to interruption3 . The register state prior to interruption is also available, which DRK saves to its own stack upon entry to its interrupt handler. Lines 1–3 of H ANDLE I NTERRUPT show these state-saving steps, which are common to all interrupt handling cases. Next, DRK gives the instrumentation client (if one exists) a chance to handle the interrupt (lines 4–6). If 3 Recall
that exceptions and non-maskable interrupts may occur even if the CPU had asynchronous interrupts disabled.
the client has not fully handled the interrupt, DRK then decides to either compute native state and immediately dispatch or delay the interrupt. When DRK recreates native state, it records the pending interrupt vector and transfers control to the dispatcher immediately (lines 31–32 of H ANDLE -I NTERRUPT). To delay an interrupt, DRK records the pending interrupt, arranges for execution to return to the dispatcher at the boundary between the current translation and the translation for the next native instruction, and returns to the interrupted instruction with interrupts disabled (lines 33–37 of H ANDLE -I NTERRUPT). Interrupts are disabled so that another interrupt doesn’t arrive before the pending interrupt is delivered, leaving hardware to implicitly queue subsequent device interrupts. Letting hardware queue interrupts avoids the problem of queueing interrupts in software (which, in itself is challenging for general hardware because emptying the queue requires an understanding of hardware interrupt routing). When execution reaches the dispatcher after the delayed interrupt, the arrival of the pending interrupt is emulated (lines 1–6 of D ISPATCH). Because interrupts were artificially disabled before returning to the dispatcher, the wrong interruptibility state will have been saved during the last context switch. However, since Pending-Vector is not N ULL, the last code cache exit must have been caused by a pending asynchronous interrupt, therefore the dispatcher modifies the emulated interrupt stack frame to indicate the native state of the interrupt flag (line 4 of D ISPATCH). Then the dispatcher enters the code cache at the fragment for the delayed interrupt’s handler. The remainder of this section describes why DRK delays interrupts or immediately transfers to the dispatcher when an interrupt arrives. The decision to delay or not depends on where the CPU is interrupted. Case 1: Interrupt in user mode. Because usermode execution is not instrumented, the interrupted instruction will always be on a native instruction boundary, hence no undoing or delaying is necessary. In this case, DRK simply calls dispatch on the native interrupt handler (lines 7–8 of H ANDLE -I NTERRUPT). Case 2: Interrupted in a code cache fragment. To handle interrupts in code cache fragments, DRK first determines what kind of translation the interrupted instruction came from (line 10). To determine the translation, DRK makes use of DynamoRIO’s state recreation code for synchronous userspace signals. Case 2A: Exception in fragment. Exceptions are synchronous interrupts triggered by an instruction, such as a page fault. Natively, the exception is delivered with the state of the CPU before the exceptional instruction executed. DRK is therefore forced to determine native state at the exceptional instruction (line 12) and dispatch on the exception handler (line 13). DRK uses DynamoRIO’s state recreation code to determine native state. This code scans from the beginning of the interrupted fragment to the interrupted instruction address; it keeps track of outstanding register spills and adjustments to the stack pointer made by DynamoRIO’s translations and reverts them. Because it is impossible to undo arbitrary translations, DRK (like DynamoRIO) requires clients to handle any exceptions that their instrumentation code generates (line 5). Case 2B: Interrupted during the translation of a control transfer instruction. Interrupts are delayed until the target of the control transfer instruction. This approach avoids creating a redundant fragment tail because the target of the control transfer instruction would be the beginning of a new fragment in spite of interruption. This is accomplished by unlinking the last instruction in the fragment’s control transfer translation, via patching,
to return to the dispatcher (line 15 of H ANDLE -I NTERRUPT). After the fragment is unlinked, execution returns to the interrupted translation with interrupts disabled (lines 33–37). When the CPU executes the dispatcher next, it sees the pending interrupt and emulates its arrival. Translations for control transfer instructions involve emulation in some cases. For instance, a return instruction’s translation involves spilling a register, popping the return address off of the stack into the spilled register, jumping to the indirect branch lookup routine, and returning to the dispatcher if the lookup fails to find the fragment for the return address. Interrupts during the first three steps (spilling, popping, and jumping), take place in the fragment and are thus handled by Case 2B. Interrupts during the last two steps are handled by Case 3 and Case 4. Case 2C: Interrupted during a native instruction translation. Native state is recreated and the dispatcher is invoked immediately. The interrupt cannot be delayed because subsequent native instructions might affect interrupt delivery. Case 2D: Interrupted during instrumentation. Undoing in this case is unfeasible because instrumentation is arbitrary code. So the interrupt is delayed until the end of the instrumentation (line 20). The translation following the interrupted instrumentation is patched with a control transfer to the dispatcher (line 21). Because DRK uses CPU-private code caches, this patch will not affect other CPUs. However, a shared code cache could be patched atomically if instructions following instrumentation code were padded to the proper alignment. Case 3: Interrupted during indirect branch lookup routine. On the hit path of the indirect branch lookup routine, there is a final jump instruction that transfers control to the fragment. To delay interrupts in this case, this final jump is patched to return to the dispatcher (line 24), effectively delaying the interrupt. DRK uses CPU-private indirect branch lookup routines to make patching simple and efficient. However, the patch could be done atomically for shared caches at the performance cost of spurious code cache exits on other CPUs. Case 4: Interrupted while exiting the code cache. DynamoRIO saves the kernel’s native state when control exits the code cache and enters the dispatcher. If interrupted during a context switch, DRK needs to delay the interrupt until the context switch finishes to allowing the remaining native state to be saved. To delay interrupts in this case, DRK simply makes note of the pending interrupt and returns to the interrupted context switch (line 27 of H ANDLE -I NTERRUPT). Case 5: Interrupted while entering the code cache. DRK has nothing to undo because the native state was recorded during the last code cache exit. DRK makes note of the pending interrupt and calls D ISPATCH with the registers saved during the last code cache exit (line 29 of H ANDLE -I NTERRUPT).
5.
Framework Evaluation
Before examining applications that are enabled by DRK, we evaluate the overhead of the framework alone and with a simple instrumentation client. For these experiments, we operate with a large enough maximum code cache size so that flushes do not occur. We perform a number of stress tests with a high level of kernel activity, to show the robustness of DRK and to illustrate worst-case behavior. As noted in Section 2, we have not yet ported certain DynamoRIO optimizations, such as traces, to DRK. The current results are therefore conservative.
fileserver webserver webproxy varmail
nthreads 50 100 100 16
data size 1.25 GB 15.6 MB 15.6 MB 15.6 MB
Table 1. Filebench parameters 5.1
Simple Tools
We implemented two simple instrumentation clients to illustrate the overhead of the DRK framework. Null Client does nothing. This client illustrates DRK’s bare performance. Instruction Count keeps a per-CPU tally of the number of instructions that have executed. Instruction Count instruments every basic block to increment the CPU’s counter by the number of instructions in the basic block. Our implementation of this client uses a standard optimization that avoids spilling and restoring the CPU’s arithmetic flags if they are dead. Note that if an interrupt arrives after the Instruction Count instrumentation clobbers the flags, but before the native instruction kills the flags, then the interrupt handler will see the non-native flag state. During our experiments, we have not seen this affect the correctness of the kernel execution. 5.2
Experimental Results
Our test system is a Dell Optiplex 980 with 8 GB of RAM and 4 64-bit Intel Core i7 CPUs operating at 2.8GHz. We disabled hyperthreading in the BIOS for our performance experiments, but note that DRK runs stably with all 8 cores that are available when hyperthreading is enabled. We use lmbench version 3.0 to get a fine-grained view of the performance during a variety of system activities4 . We then present server and desktop benchmarks. All results are an average of five warm runs. Figure 4 shows the lmbench results. We have grouped tests with similar original native performance into subfigures to better show the performance. For simple system calls, our slowdown with the Null client ranges from 1.4 (for the null system call) to 2.7 for open+close. Other “fast” kernel operations have higher overheads, with a worst-case slowdown of 4.9 during protection faults. Signal delivery and page faults on file pages are more like system calls, with slowdowns of 2.8 and 2.1 respectively. The results for the other system calls are similar. The slowdowns on select and pipe range from 1.9 to 2.5, although sock is worse. The slowdowns for the fork calls are also similar, ranging from 2.2 up to 2.7. The Instruction Count client adds significant additional overhead for these simple microbenchmark tests, although as the complexity of the operation increases, the additional overhead of Instruction Count is less significant, as can be seen for the fork operations. We observe that the overheads are lower for simple system calls than for protection faults because DRK points system call entries directly to their fragments in the code cache (as described in Section 4.1.2), while other entry points to the kernel are more costly. Based on these results, we are investigating optimizations for other entry points, especially page fault exceptions. We use the Linux port of Filebench version 1.4.9, with four of the standard workload personalities, using the default settings for each5 . The relevant parameters for the workloads are in Table 1. With the default parameters, the datasets easily fit in memory on our test machine, so the workloads are not limited by the performance of I/O operations. The filebench workloads use a specified number of threads to perform file system operations. These threads 4 We
present the most interesting lmbench results here. The raw data for all experiments is available from our website at http://csng.cs. toronto.edu/projects/23 5 The oltp workload hung our native system regularly.
4.5 4 1 = Native 2 = DRK, null client 3 = DRK, instruction count client
3.5
Time (seconds)
3 2.5 2 1.5 1 0.5 0 1
2
3
1
null
2
3
1
read
2
3
1
write
2
3
1
2
stat
3
1
fstat
2
3
1
open/close
2
3
1
2
3
sighdl install sighdl ovrhd
1
2
3
1
prot fault
2
3
pg fault file
(a) Fast operations
5000
50
4000
Time (seconds)
40
30
20
3000
2000
1000
10
0
0
1
2 10 fds
3
1
2
3
100 fds
1
2
3
250 fds
1
2
3
1
500 fds
2
3
1
10 tcp fds
2
3
100 tcp fds
1
2
3
250 tcp fds
1
2
3
500 tcp fds
1
2
3
pipe
1
2
3
1 2 3
sock
1 2 3
fork+exit fork+execve
(b) Communication related (select on varying numbers of fds, pipe, sock) operations
20000
10000
1 = Native 2 = DRK, null client 3 = DRK, instruction count client
18000 16000
9000
12000 10000 8000 6000
1 = Native 2 = DRK, null client 3 = DRK, instruction count client
8000 Throughput (ops/s)
14000
7000 6000 5000 4000 3000
4000
2000
2000
1000
0
0
1 2 3 fileserver
1 2 3 webserver
1 2 3 webproxy
(a) Filebench throughput
1 2 3 fork+sh
(c) Fork operations
Figure 4. Microbenchmark results from lmbench
Throughput (ops/s)
Time (seconds)
1 = Native 2 = DRK, null client 3 = DRK, instruction count client
1 = Native 2 = DRK, null client 3 = DRK, instruction count client
1 2 3 varmail
1
2 3 apachebench
(b) Apachebench throughput
Figure 5. Throughput results on server benchmarks
native null client instruction count client
User time (s) 853.5 1008.6 1044.3
System time (s) 90.4 219.8 262.9
Page faults (major + minor) 0.0 maj + 44330667.2 min 0.0 maj + 44330627.8 min 0.0 maj + 44331392.0 min
context switches (vol + invol) 381416.2 vol + 318502.4 invol 411537.6 vol + 367363.6 invol 416782.2 vol + 377980.2 invol
Table 2. Kernel compile statistics (make -j4) use shared memory and synchronization primitives to communicate with each other. This means we are really testing the performance of a varying number of threads that exercise IPC and kernel operations heavily, rather than file system performance. The exception is varmail, which has some I/O activity due to issuing sync calls. The throughput of the Filebench workloads, in file system operations per second, is shown in Figure 5(a). Null Client reduces throughput by 3X for fileserver, and by 4.5X and 4.2X for webserver and webproxy, respectively. There is only a small additional reduction in throughput with Instruction Count. We can see that the drop in throughput is correlated with the number of threads used in the workload, with webserver and webproxy both using 100 threads. The overhead for varmail, which syncs its data to disk frequently, is much lower, with only a 1.4X drop in throughput. To get a better sense of the impact on server workloads, we set up an apache web server (using default settings) on our instrumented system and ran apachebench from a separate client machine connected via gigabit ethernet. We used 500K requests and a concurrency level of 200. We found that our client was unable to generate enough load to saturate the CPUs on the 4-core test system. In this configuration, there was effectively no loss in throughput as measured at the client, since the server CPU (which is affected by the overhead of DRK) was not the bottleneck. We therefore configured our test system to boot with a single CPU and verified that the client running apachebench was able to saturate the CPU on the server running natively. With this setup, we observed roughly 28% of the CPU time was spent in system mode, with another 38% of the CPU time spent in interrupt handling. Figure 5(b) shows the throughput measured at the client. As with the CPUbound Filebench workloads, there is a 3X drop in throughput. This is not surprising given the high proportion of time spent handling interrupts, and the costs of recreating native state to handle interrupt delivery, as detailed in Section 4.2.2. To assess the impact on desktop workloads, we timed a compile of the Linux kernel tree, using “make -j4” on the 4-core system. Table 2 shows the relevant statistics. We show the user and kernel time accumulated by all sub-processes of make. Here, we can see the indirect impact of DRK on the user-time, as well as the much higher kernel overheads. The overall CPU time (user+kernel) to complete the compile with Null Client increased by about 30%. Instruction Count adds an additional 8% overhead to the CPU time. We also tested kernel compile with the 1-CPU system and obtained essentially the same results. We also tested browser javascript performance using the Mozilla Kraken benchmark. In this case, the total time to run the benchmark increased by only 3% over native when running with DRK (the Null client and Instruction Count client were essentially the same). This result is expected since javascript execution has little kernel interaction, and is largely unaffected by DRK. Small, but noticeable, overheads occur primarily in the tests that use a large amount of memory (and hence have many page faults).
6.
Applications
This section describes more sophisticated DBT applications we have built using DRK. Before introducing these applications, we describe our shadow memory implementation. Then, we give examples of two non-trivial debugging tools built using DRK.
0000000000000000-00007fffffffffff 0008000000000000-ffff7fffffffffff ffff800000000000-ffff80ffffffffff ffff880000000000-ffffc7ffffffffff ffffc80000000000-ffffc8ffffffffff ffffc90000000000-ffffe8ffffffffff ffffe90000000000-ffffe9ffffffffff ffffea0000000000-ffffeaffffffffff ffffeb0000000000-ffffffff7fffffff ffffffff80000000-ffffffffa0000000 ffffffffa0000000-fffffffffff00000 fffffffffff00001-ffffffffffffffff
user space sign extension guard hole physical direct map unused (1TB) vmalloc unused (1TB) virtual memory map unused (≈ 21TB) kernel text modules unused (≈ 1GB)
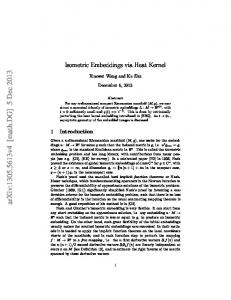
Figure 6. Map of 64-bit x86 Linux kernel memory, adapted from [14]. The kernel’s valid virtual addresses are in the range shown between two horizontal lines, which is 120TB in size. 24TB of the address space is unused. 6.1
Shadow Memory
Shadow memory is a technique for storing metadata about every byte of memory that a program uses. Some of the most popular userspace applications of DBT rely on shadow memory. For example, Memcheck [22] keeps track of the addressability of memory with byte-level granularity and tracks definedness with bit-level granularity. The main challenge in implementing shadow memory is implementing an efficient mapping between application memory and shadow memory. The simplest scheme directly maps addresses to shadow addresses by a constant offset. However, this simple scheme requires a region of address space as large as the range of addresses being shadowed. If such a region does not exist, then an indirect mapping scheme is required. Indirect mapping associates chunks of application addresses with chunks of shadow addresses. For the 64-bit x86 Linux kernel, direct shadow mapping is inapplicable. As Figure 6 shows, the kernel addresses 120TB of memory with only 1GB to spare. Note that the lower half of the virtual address space where user mappings reside cannot be used to map shadow memory because user mappings are changed arbitrarily by the kernel. So kernel shadow memory requires an indirect mapping. We decided to port the userspace Umbra shadow memory framework [25] for 64-bit x86 to the Linux kernel. Umbra is implemented using DynamoRIO, making it a DynamoRIO client. However it is a general framework for use by tools that require shadow memory – such tools are in turn referred to as Umbra clients. Umbra implements a simple indirect mapping. It divides the virtual address space into 4GB-aligned ranges called application units. When an application unit is in use, shadow memory is allocated. Umbra keeps a list of application units and the offset to their shadows. On every memory access, Umbra’s instrumentation searches the list of application units to find the offset for the unit being accessed. To avoid searching in most cases, Umbra caches the last application unit and offset for each instruction. Our port of Umbra allocates virtual address for shadow units when a kernel memory ‘application unit’ is first accessed. Shadow virtual address is allocated by stealing unused page table entries from the unused ranges in Linux’s virtual memory map (Figure 6). Initially, all pages in a shadow unit are mapped copy-on-write to a single default physical page initially populated with client-specified data. Pages for the shadow are taken from the kernel when the
module loads and kept in a shadow page pool to satisfy copy-onwrite faults on the default shared shadow page. DRK shadow memory is a heavyweight instrumentation that results in roughly 10X overhead compared to native performance. 6.2
KAddrcheck
We implemented an addressability checking tool, called KAddrcheck, for Linux’s slab allocator using our kernel version of Umbra. The slab allocator is a general purpose memory allocator used by virtually every part of the kernel; Linux’s analog to malloc, called kmalloc, is implemented using the slab allocator. KAddrcheck checks, at byte granularity, if memory on pages allocated by Linux’s slab allocator is addressable. The slab allocator maintains lists of free objects of various sizes. To satisfy an allocation request of a certain size, the slab allocator returns the next free object from the list of the requested size. If the list is empty, then the slab allocator extends the list using pages allocated by Linux’s lower-level page allocator. To free an object, the slab allocator adds it back to the freelist of the page from whence it came. When a page contains only free objects, the slab allocator may return the page to the page allocator. KAddrcheck maintains the addressability state for every byte of kernel memory using our Umbra port. Memory on slab freelists, allocated objects’ metadata, and wasted bytes due to alignment are considered unaddressable. Accessing (i.e., reading or writing) unaddressable memory is an error. Memory on a slab page that is part of an allocated object is considered addressable. Memory that is not on a slab page is also considered addressable because we do not keep track of it. The KAddrcheck client marks all bytes on the default read-only shadow page as addressable, effectively setting the state for all memory to addressable. During initialization, KAddrcheck scans the slab allocator’s data structures to locate all of its pages and their freelists. Shadow bytes for objects on freelists are marked as unaddressable; these initial writes to the shadow memory cause copy-on-write faults for each page, which are handled by allocating a new page from the shadow page pool and updating the mapping. KAddrcheck wraps calls to the slab allocator’s interfaces to track changes to slab memory. To wrap a slab allocator interface, KAddrcheck instruments its entry point to execute the pre-interface wrapper and pushes a stack frame for the post-wrapper. When slab objects are allocated and freed, KAddrcheck’s wrappers mark them as addressable and unaddressable respectively. When the slab allocator acquires a page, it is marked as unaddressable because nothing has been allocated from the page yet. When a page is released, KAddrcheck marks the entire page as addressable because it no longer tracks it. On every memory access, KAddrcheck’s instrumentation checks if the shadow memory is marked as unaddressable, and if so, reports an error. Errors are suppressed if the unaddressable access happens while a wrapped slab function is on the call stack. We tested the KAddrcheck tool on our own code in which we deliberately inserted various memory addressing errors. These bugs were reported by KAddrcheck, confirming that it operates as expected. We have also run KAddrcheck on the Linux kernel during our performance tests. Since we are using a stable kernel version, it is not surprising that no errors were reported during these tests. A heavyweight instrumentation tool like this is most suited for use on code that is still under development, where memory referencing bugs are more likely. 6.3
Stackcheck
Natively, when the Linux kernel crashes fatally, it does a postmortem check on the current thread’s stack. Linux checks to see
if the last 4 bytes of the stack match a magic number written when the stack was created. The Stackcheck tool proactively guards against stack overflow. Stackcheck marks the shadow for the last 4 bytes of all kernel stacks as unaddressable. If an addressability error occurs on a write to the unaddressable stack bytes, then Stackcheck redirects execution to Linux’s oops function, which kills the calling thread and continues running. Unlike Linux’s native stack magic check, Stackcheck can detect an overflow early enough to keep the rest of the system running. The Stackcheck tool is a modified version of KAddrcheck. In addition to monitoring for accesses to unaddressable slab memory, Stackcheck checks for overflow of kernel stacks. To guard against overflow, Stackcheck marks the shadow for the last 4 bytes of all kernel stacks as unaddressable. Stackcheck wraps kernel stack allocation and deallocation functions to know when to protect and unprotect stack memory.
7.
Related Work
There are several widely-used userspace DBT instrumentation frameworks, including DynamoRIO [5], Pin [16], and Valgrind [17], all of which aim to offer comprehensive instrumentation for the user space, and export instruction inspection and manipulation APIs. Analogous to DRK’s handling of hardware-generated interrupts, these frameworks interpose on signal delivery. However, all of them delay asynchronous signals until code cache exits, which happens in some pathological cases after an unbounded amount of time. Worse, pending signals might be dropped if too many signals are queued. DRK avoids these problems by dispatching on interrupt handlers as soon as possible. JIFL [19] instruments native operating systems using DBT by providing an API for instrumenting system calls. Unlike DRK, JIFL does not aim to be comprehensive as JIFL does not instrument interrupt handlers or kernel threads, precluding many kinds of instrumentation. Furthermore, unlike DRK, JIFL is incompatible with preemptible kernels. PinOS is a whole-system instrumentation framework based on Pin and the paravirtualized Xen hypervisor [8]. PinOS captures all virtual machine execution, including booting and usermode execution, unlike DRK which is attached after startup and only instruments the kernel. PinOS’s increased coverage comes at the cost of overhead, which is 50x higher than DRK in the case of ApacheBench. Because paravirtualized Xen emulates all of its interrupt-generating hardware, it is feasible for PinOS to delay interrupts until code cache exits, similar to the userspace frameworks. This convenience comes at the cost of not being able to instrument native device drivers. VMWare’s virtual machine monitor implements virtualization using DBT (i.e., as an alternative to using hardware virtualization) [1]. Although VMWare is not intended as an instrumentation platform, it could presumably be adapted to expose an instrumentation API. However, like PinOS, VMWare emulates devices, precluding instrumentation of the native devices drivers. Note that both Xen and VMWare support device passthrough, which enables VMs to interact with native devices directly [9]. Although this approach puts native device drivers back in the VM, it also removes device emulation from the VMM. Without the convenience of emulated devices, delaying interrupts until code cache exits becomes intractable. So DBT that used device passthrough would have essentially the same interrupt delivery problem that we have solved with DRK. Kprobes [15], KernInst [24], and DTrace [10] are dynamic kernel instrumentation frameworks, designed for debugging and profiling. These frameworks work by patching entry points of functions with trampolines to instrumentation routines. However, the
overhead of trampolines and context switching to instrumentation routines is prohibitive for fine-grained instrumentation as simple as instruction counting [19]. DRK avoids this overhead by providing an API for inline instrumentation. Memcheck [22] and Dr. Memory [7] are full-featured memory checking tools for userspace built using shadow memory on top of Valgrind and DynamoRIO respectively. Like our KAddrcheck tool, Memcheck and Dr. Memory wrap heap functions and check for addressability of accesses. In addition, Memcheck and Dr. Memory propagate definedness through registers and memory. These tools raise errors for undefined accesses of consequence (e.g., dereferencing an undefined pointer). We plan on adding definedness checking and propagation to KAddrcheck in the future. Included with the Linux kernel, kmemcheck [18] uses page protection and single stepping to implement addressability checking and limited definedness checking for slab memory. We plan to compare our approach with kmemcheck once propagation tracking is implemented in Kaddrcheck.
8.
Conclusions and Future Work
We have presented the design and implementation of DRK, a dynamic binary translation-based kernel instrumentation framework. DRK provides complete control over all kernel execution, including interrupt and exception handlers and device drivers, enabling comprehensive instrumentation of the OS without imposing any direct overhead on user-level code. We found that the most challenging aspect of our design involved handling interrupts without relying on emulated interrupt-generating hardware, while meeting our goals of preserving execution interleaving and execution transparency. Our results show that DRK’s performance equals or far exceeds existing fine-grained kernel instrumentation frameworks. We also demonstrated the utility of DBT-based kernel instrumentation by implementing two useful debugging tools, KAddrcheck and Stackcheck. As future work, we plan on enhancing KAddrcheck to match the features provided by Dr. Memory and Memcheck.
9.
Acknowledgements
We thank Derek Bruening and Qin Zhao for answering questions about DynamoRIO and giving early feedback on our plan to port DynamoRIO to the Linux kernel. We also thank the anonymous reviewers for their insightful comments. This research was supported by NSERC through a Canada Graduate Scholarship for Peter Feiner and the Discovery Grants program.
References [1] Keith Adams and Ole Agesen. A comparison of software and hardware techniques for x86 virtualization. In ASPLOS, pages 2–13, San Jose, CA, 2006. ACM. [2] Advanced Micro Devices. AMD64 Architecture Programmer’s Manual Volume 2: System Programming. 3.15 edition, 2009. [3] Vasanth Bala, Evelyn Duesterwald, and Sanjeev Banerjia. Dynamo: A Transparent Dynamic Optimization System. PLDI, pages 1–12, 2000. [4] Daniel P. Bovet and Marco Cesati. Understanding the Linux Kernel. O’Reilly, Sebastopol, CA, 3rd edition, 2005. [5] Derek Bruening. Efficient, Transparent, and Comprehensive Runtime Code Manipulation. Ph.d. thesis, Massachusetts Institute of Technology, 2004. [6] Derek Bruening, Vladimir Kiriansky, Timothy Garnett, and Sanjeev Banerji. Thread-shared software code caches. In CGO, New York, NY, 2006. ACM. [7] Derek. Bruening and Qin Zhao. Practical memory checking with dr. memory. In CGO, pages 213–223, april 2011.
[8] P. P. Bungale and C. K. Luk. PinOS: A programmable framework for whole-system dynamic instrumentation. In VEE, pages 137–147, San Diego, CA, 2007. ACM. [9] T. W. Burger. Intel Virtualization Technology for Directed I/O (VT-d): Enhancing Intel platforms for efficient virtualization of I/O devices. http://software.intel.com/en-us/articles/intel-virtualizationtechnology-for-directed-io-vt-d-enhancing-intel-platforms-forefficient-virtualization-of-io-devices/. Last accessed July 25, 2011. 2009. [10] Bryan M. Cantrill, Michael W. Shapiro, Adam H. Leventhal, and Sun Microsystems. Dynamic instrumentation of production systems. In USENIX ATC, pages 15–28. USENIX Association, 2004. [11] Andy Chou, Junfeng Yang, Benjamin Chelf, Seth Hallem, and Dawson Engler. An empirical study of operating systems errors. In SOSP, pages 73–88, Banff, Canada, 2001. ACM. [12] Bryan Ford and Russ Cox. Vx32: Lightweight user-level sandboxing on the x86. In USENIX ATC, Boston, MA, 2008. USENIX Association. [13] Vladimir Kiriansky, Derek Bruening, and Saman P. Amarasinghe. Secure Execution via Program Shepherding. In USENIX Security, pages 191–206, San Francisco, CA, 2002. USENIX Association. [14] Andi Kleen. Linux Kernel Documentation: Virtual memory map with 4 level page tables. http://www.kernel.org/doc/Documentation/x86/x86 64/mm.txt. Last accessed July 24th, 2011. 2004. [15] Linux Technology Center. KProbes. http://sourceware.org/systemtap/kprobes/. Last accessed May 2nd, 2010. [16] C. K. Luk, Robert Cohn, Robert Muth, Harish Patil, Artur Klauser, Geoff Lowney, Steven Wallace, V. J. Reddi, and K. Hazelwood. Pin: building customized program analysis tools with dynamic instrumentation. In PLDI, pages 190–200, Chicago, IL, 2005. ACM. [17] Nicholas Nethercote and Julian Seward. Valgrind: a framework for heavyweight dynamic binary instrumentation. In PLDI, pages 89–100, San Diego, CA, 2007. ACM. [18] Vegard Nossum. kmemcheck: trap uses of uninitialized memory. http://lwn.net/Articles/259974/. Last accessed July 25th, 2011. 2007. [19] Marek Olszewski, Keir Mierle, Adam Czajkowski, and Angela Demke Brown. JIT Instrumentation: a Novel Approach to Dynamically Instrument Operating Systems. In EUROSYS, pages 3–16, Lisbon, Portugal, 2007. ACM. [20] Nicolas Palix, Ga¨el Thomas, Suman Saha, Christophe Calv`es, Julia Lawall, and Gilles Muller. Faults in linux: ten years later. In ASPLOS, ASPLOS ’11, pages 305–318, New York, NY, USA, 2011. ACM. [21] Arvind Seshadri, Mark Luk, Ning Qu, and Adrian Perrig. SecVisor : A Tiny Hypervisor to Provide Lifetime Kernel Code Integrity for Commodity OSes. In SOSP, pages 335–350, Stevenson, WA, 2007. ACM. [22] Julian Seward and Nicholas Nethercote. Using Valgrind to Detect Undefined Value Errors with Bit-Precision. In USENIX ATC, pages 17–30, Anaheim, CA, 2005. USENIX Association. [23] Dawn Song, David Brumley, Heng Yin, Juean Caballero, Ivan Jager, Min Gyung Kang, Zhenkai Liang, James Newsome, Pongsin Poosankam, and Prateek Saxena. BitBlaze: A New Approach to Computer Security via Binary Analysis. In ISS. Keynote invited paper, Hyderabad, India, 2008. [24] Ariel Tamches and Barton P. Miller. Fine-grained dynamic instrumentation of commodity operating system kernels. In OSDI, pages 117–130, Berkeley, CA, USA, 1999. USENIX Association. [25] Qin Zhao, Derek Bruening, and Saman Amarasinghe. Umbra: Efficient and Scalable Memory Shadowing. In ASPLOS, Toronto, Canada, 2010. ACM.