Computation of linear elastic properties from microtomographic images: Methodology and agreement between theory and experiment
by Christoph H. Arns and Mark A. Knackstedt Department of Applied Mathematics Australian National University Canberra, ACT 0200 AUSTRALIA and W. Val Pinczewski University of New South Wales, Sydney New South Wales 2052, AUSTRALIA and E. J. Garboczi Building and Fire Research Laboratory National Institute of Standards and Technology Gaithersburg, MD 20899 USA
Reprinted from Journal of Geophysics, Vol. 67, No. 5, 1396-1405, Sept.-Oct. 2002. NOTE:
This paper is a contribution of the National Institute of Standards and Technology and is not subject to copyright.
GEOPHYSICS, VOL. 67, NO. 5 (SEPTEMBER-OCTOBER 2002); P. 1396–1405, 9 FIGS. 10.1190/1.1512785
Computation of linear elastic properties from microtomographic images: Methodology and agreement between theory and experiment
Christoph H. Arns∗ , Mark A. Knackstedt∗ , W. Val Pinczewski‡ , and Edward J. Garboczi∗∗ surements. Expressions that relate elastic moduli to porosity, pore-fluid compressibility, and fluid saturation form the basis for reservoir assessment and monitoring procedures. They are used to infer porosity from well logs as well as from in-situ indicators of pore fluid type. Properties of porous rocks depend primarily on the morphology of the pore space and solid phase(s). Relevant aspects of the rock structure include porosity, pore shape and size, and the type and frequency of interconnections between pore and solid regions. These features, some of which unfortunately lack precise definition, comprise the morphology of the rock. Accurately predicting properties from microstructural information requires an accurate quantitative description of the complex microstructure of the medium, and the ability to solve for mechanical properties on large 3-D grids. In the absence of a full structural characterisation, past attempts to relate the elastic properties of rocks to porosity have been limited to empirical relationships (Han, 1986), effective medium theories (Berryman, 1980), rigorous bounding methods (Hashin and Shtrikman, 1962; Milton, 1981) and simple deterministic models (Wyllie et al., 1956; Raymer et al., 1980). None of these is entirely satisfactory. Typically, empirical formulas are obtained statistically from experimental data sets. They provide a simple and convenient, but deceptive, form of summarizing extensive experimental data. Lacking a rigorous connection with microstructure, these formulas do not offer predictive or interpretive power, seldom carry physical insight, and often fail when applied to a wider range of rock types. In effective medium theory, the microstructure corresponding to a specific model is not realistic; agreement or disagreement with data can neither confirm nor reject a particular model. A clear advantage of bounds is that they incorporate microstructural information and can be
ABSTRACT
Elastic property-porosity relationships are derived directly from microtomographic images. This is illustrated for a suite of four samples of Fontainebleau sandstone with porosities ranging from 7.5% to 22%. A finiteelement method is used to derive the elastic properties of digitized images. By estimating and minimizing several sources of numerical error, very accurate predictions of properties are derived in excellent agreement with experimental measurements over a wide range of the porosity. We consider the elastic properties of the digitized images under dry, water-saturated, and oilsaturated conditions. The observed change in the elastic properties due to fluid substitution is in excellent agreement with the exact Gassmann’s equations. This shows both the accuracy and the feasibility of combining microtomographic images with elastic calculations to accurately predict petrophysical properties of individual rock morphologies. We compare the numerical predictions to various empirical, effective medium and rigorous approximations used to relate the elastic properties of rocks to porosity under different saturation conditions.
INTRODUCTION
Discovering accurate relationships between pore structure and elastic properties of porous rocks is a long standing problem in geophysics. Understanding the interaction between rock, pore space, and fluids, and how they control rock properties is crucial to better interpretation of geophysical mea-
Manuscript received by the Editor May 9, 2001; revised manuscript received January 10, 2002. ∗ Formerly University of New South Wales, Sydney, New South Wales 2052, Australia; presently Australian National University, Department of Applied Mathematics, Research School of Physical Sciences & Engineering, Canberra, ACT 0200, Australia. E-mail:
[email protected];
[email protected]. ‡University of New South Wales, Sydney, New South Wales 2052, Australia. E-mail:
[email protected]. ∗∗ National Institute of Standards and Technology, Building Materials Division, Gaithersburg, Maryland 20899. E-mail:
[email protected]. ° c 2002 Society of Exploration Geophysicists. All rights reserved. 1396
Elastic Properties from X Ray–CT Images
applied to arbitrarily complex structures. Bounds are extremely useful if the constituent materials have similar properties. For materials like porous sedimentary rocks, the bounds are quite far apart due to the large contrast in elastic properties between pore fluid and rock matrix which severely limits their predictive power. Simple deterministic models attempt to find a meaningful explanation for experimental observations. The best known example is Wyllie’s equation (Wyllie et al., 1956). This equation is based on the observation that, for clean sandstones, the compressional wave velocity has a strong linear correlation with porosity. Raymer et al. (1980) modified this formula by suggesting different laws for different porosity ranges. Nur et al. (1995) also used this method in suggesting a critical porosity model. These models work for certain classes of rock types, but do not have general applicability. An alternative approach is to computationally solve the equations of elasticity directly on digitized models of microstructure (Roberts and Garboczi, 2000). Computer memory and processing speed now make it possible to handle the large 3-D models and number of computations needed to obtain useful results. As input to these methods, statistical models have been proposed for reconstructing 3-D porous materials (Joshi, 1974; Quiblier, 1984; Adler et al., 1990, 1992; Roberts, 1997; Yeong and Torquato, 1998). Complete characterization of the effective morphology, however, requires knowledge of an infinite set of n-point statistical correlation functions. In practice only lower order morphological information is available; common methods (Joshi, 1974) are based on matching the first two moments (volume fraction and two-point correlation function) of the binary phase function to a random model. Random 3-D models are then generated which match the measured statistical properties. It is widely recognised (Adler et al., 1990, 1992; Roberts, 1997; Yeong and Torquato, 1998) that although the two-point correlation functions of a reference and a reconstructed system are in good agreement, this does not ensure that the structures of the two systems will match well. Adler et al. used this technique to reconstruct Fontainebleau sandstone and found that computations of permeability (Adler et al., 1990) and conductivity (Adler et al., 1992) were consistently lower than experimental data, a result most likely due to percolation differences between model and real materials (Bentz and Martys, 1994; Roberts and Knackstedt, 1996). Direct techniques which provide a detailed 3-D description of the pore structure were initially limited to sets of 2-D serial sections imaged and combined to build the 3-D image (Lin and Cohen, 1982). However this method is extremely tedious and time consuming. Direct measurement of a 3-D structure is now readily available from synchotron and micro X-ray computed microtomography (Flannery et al., 1987; Dunsmuir et al., 1991; Spanne et al., 1994) and laser confocal microscopy (Fredrich et al., 1995). These techniques provide the opportunity to directly measure the complex morphology of the pore space of sedimentary rock in three dimensions at resolutions down to a few microns. In parallel, computational techniques have progressed to the point where material properties such as diffusivity, elasticity, and conductivity can be calculated on large 3-D digitised images containing up to one billion (10003 ) voxels. With the development of these experimental and computational methods, it is possible to replace synthetic images derived from statistical models with actual images and base calculations directly on the measured 3-D microstructure. This has
1397
been done (Schwartz et al., 1994; Spanne et al., 1994; Auzerais et al., 1996) for the geometric and transport properties of sandstones. Their calculations showed good agreement with laboratory measurements for porosity and pore-volume-to-surface ratio. Their calculations of transport properties were less successful. In a recent paper (Arns et al., 2001a), we showed that it is possible to accurately predict transport properties from digitized images by estimating and minimizing sources of numerical error. In the present paper, we calculate for the first time the elastic properties of a tomographic image of sandstone. We consider the elastic properties of the digitized images under dry, water-saturated, and oil-saturated conditions. Numerical predictions are in excellent agreement with available experimental data. The observed change in the elastic properties due to fluid substitution is consistent with the exact Gassmann’s equations (Gassmann, 1951; Berryman, 1999). This shows both the feasibility and the accuracy of combining microtomographic images with elastic calculations to predict petrophysical properties of individual rock morphologies. We compare the numerical predictions to various empirical, effective medium, deterministic, and rigorous approximations used to relate the elastic properties of rocks to porosity. The paper is organized as follows. We first briefly describe the experimental acquisition method and define morphological measures used to choose an appropriate window size for simulation. Numerical methods used to derive the linear elastic properties are described in detail along with a discussion of potential numerical errors. We then give the predictions for the suite of Fontainebleau samples used in this study, and compare them to experiment and to theory. Finally, we compare the numerical predictions with commonly used empirical methods. METHODOLOGY
Image acquisition Fontainebleau sandstone is an ideal experimental system for this study. First, experimental data is available for the elastic properties of Fontainebleau sandstone over a range of porosity (Han, 1986). Second, Fontainebleau is homogeneous, it is made up of a single mineral (quartz) and does not contain clay, and the structure of the sandstone is quite simple as it only displays intergranular porosity. Modeling the system as a simple two-phase material may be expected to provide a good match to experimental data. The images were obtained from 4.52-mm diameter cylindrical core samples extracted from each of four blocks of Fontainebleau sandstone with bulk porosities φ = 7.5%, 13%, 15%, and 22%. A 2.91-mm length section of each core was imaged (Flannery et al., 1987; Dunsmuir et al., 1991; Spanne et al., 1994). The reconstructed images have a resolution of 5.7 µm resulting in 795 × 795 × 512 imaged sections. X-ray computed tomographic images of porous media are grayscale images, usually with a bimodal population apparent, one mode corresponding to the signal from the void space and the second to the signal from the grain space. Each grayscale image was thresholded using a kriging-based thresholding method (Oh and Lindquist, 1999) to give a binary poresolid image (Lindquist and Venkatarangan, 1999; Lindquist et al., 2000). From the original cylindrical plug, we extracted the central 4803 cubic subset for analysis, corresponding to a volume of 20.5 mm3 .
1398
Arns et al.
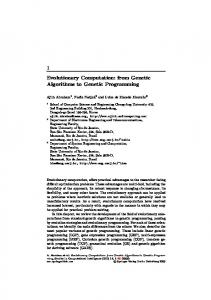
Choice of representative image volume The question of how the results depend on the total volume imaged has to be addressed. In previous work (Schwartz et al., 1994; Spanne et al., 1994; Auzerais et al., 1996), calculation of transport properties on microtomographic images were performed on either the full image or on a few subsets of the imaged data. Auzerais et al. (1996) found that cubes of size of much greater than 1 mm3 were required to estimate fluid permeability with acceptable accuracy. Unfortunately, the analysis of only a small number of subsets provides only a few datapoints to compare to experiment. The subsequent requirement to experimentally image many samples to obtain data across the full range of φ is both expensive and time consuming. In recent work (Lindquist et al., 2000), the distributions of the flow-relevant geometrical properties (e.g., poresize distribution, throat size, etc.) were measured on the same set of Fontainebleau sandstone cores considered here. They extracted, from the center of each core, a 2563 voxel image (3.09 mm3 ) and compared geometrical properties to the full core of seven times the volume. Even at this smaller scale, roughly ten grains on a side, the comparison showed good agreement for most blocks. The prospect of using smaller block sizes is an encouraging one. Rocks, even as homogeneous as Fontainebleau sandstone, exhibit local variability in the porosity (Arns, 2001; Thovert et al., 2001). We illustrate this for the four Fontainebleau sandstone samples in Figure 1. By choosing independent subsamples ((L/N )3 ) of the original (L 3 ) image, one can obtain a larger ensemble (N 3 ) of samples which exhibit a wide range of porosity. The combination of an appropriately small window size on the imaged core and the natural heterogeneity of the rock allows properties of the rock to be derived over a wide range of porosities from a small number of core samples. In this section, we use morphological measures to help define an “appropriate” window size. A first test of the dependence of digitized data on image volume is the requirement to ensure that the geometrical and the topological descriptors of the image volume are consistent. A family of measures based on the Euler-Poincare´ characteristic
FIG. 1. Variations in porosity of the four Fontainebleau sandstone samples measured along the core (4803 subvolumes).
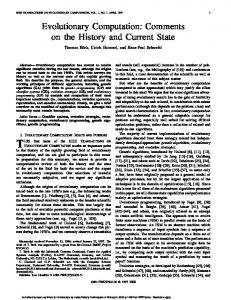
(Santalo, ´ 1953; Hadwiger, 1957) has been shown to be very sensitive to the morphology of random materials (Arns et al., 2001b). In three dimensions, there are four measures related to the familiar measures of volume fraction, surface area, integral mean curvature, and Euler characteristic (connectivity). Figure 2 illustrates the three latter measures [surface-tovolume (S/V ), integral mean curvature (H ), and Euler characteristic (χ)] as functions of the porosity for the original image at 4803 and for cubic subsets of the image at scales of 2403 and 1203 . Variability of the measures increases with decreasing window size, but the values are consistent with the data for the larger volumes, suggesting that the averages obtained for the smaller blocks are meaningful. At low porosity, near the percolation threshold of the pore space, the scatter is greatest, but still acceptable at the scale of 1203 . One can also define the representative cell size by considering the two point correlation function: the probability of finding two end points of a segment of length ` within the same phase. Defining a correlation length ξ as the first zero of this two point function (Joshi, 1974), we find that ξ ' 130 µm. This is consistent with values reported in the literature (Oren and Bakke, 2002). For our system size of 1203 at 5.7 µm per voxel, this implies the cell spans more than five times the correlation length and good averaging behavior may be expected. Previous microtomographic work (Auzerais et al., 1996) found that for a system of similar size (1123 at 7.5 µm resolution), the averaging of the porosity was acceptable. It is important to carefully select the number of samples over which the results are averaged in order to produce acceptable uncertainties. Use of samples of 1203 results in 64 samples per core, provides a wide spread of porosities from each core, and is computationally realizable on common workstations. Example snapshots of 1203 subvolumes from the four cores are shown in Figure 3. Further assessment of the errors associated with the choice of the window size on the numerical computation of the elastic properties of the images is addressed in the next section. Property prediction A microstructure defined by a digital image is already naturally discretized and lends itself immediately to numerical computation of many useful quantities. We use a finite-element method (FEM) to estimate the elastic properties of the model system. FEM uses a variational formulation of the linear elastic equations and finds the solution by minimizing the elastic energy using a fast conjugate-gradient method. Each voxel is taken to be a trilinear finite element. A strain is applied, with the average stress or the average elastic energy giving the effective elastic modulus. The digital image is assumed to have periodic boundary conditions. Most of the simulations were performed on a modern workstation (500 MHz Compaq XP1000). Each FEM simulation at 1203 required ∼1 hour of CPU time and 214 MB of memory. Further details of the theory and the programs can be found elsewhere (Garboczi and Day, 1995; Garboczi, 1998; Arns, 2001). We assign to the rock skeleton values of the elastic properties of quartz given by Mavko et al. (1998): bulk modulus K = 37.0 GPa, shear modulus µ = 44.0 GPa, and mineral density ρ = 2.65 g/cm3 . We model the water-saturated case at T = 200◦ C and 40 MPa pressure [K Water = 2.2 GPa, µWater = 0 GPa (Han, 1986; Castagna et al., 1993)], and the oil-saturated case (30 API oil) at T = 200◦ C
Elastic Properties from X Ray–CT Images
and 25 MPa pressure (K Oil = 0.5 GPa, µOil = 0 GPa) using temperature-adjusted moduli (Castagna et al., 1993). The choice of the water-saturated condition is made to allow for comparison with the experimental data from Han (1986). In order to obtain accurate numerical results it is necessary to estimate and minimize three sources of error: finite-size effects,
FIG. 2. Measures of morphology based on the Euler-Poincare´ characteristic for the Fontainebleau sandstone at the scale of the full 4803 image and for smaller cubic subsets [surface-to-volume (S/V ), integral mean curvature (H ), and Euler characteristic (χ )].
1399
statistical fluctuations, and discretization errors. These error analyses have not been carried out in the past due to limitations in computational speed. However, if one wishes to compare computations directly to experiment, such error analyses must be carried out (Roberts and Garboczi, 2000). We discuss the three sources of error separately. In the previous section, we argued that, at the length scale of 120 voxels, the averaging of the porosity is acceptable. To test if this cell size provides good averaging of the elastic properties, we compare data measured at 1203 , 1603 , and 2403 cells (see Figure 4a). The finite-size errors appear to be small for the 1203 cell size. To further quantify these errors, we discuss statistical uncertainties for the various cell sizes. To estimate statistical uncertainties, we bin the data as a function of porosity φ with bin sizes 1φ = 0.025. The error bars reflect twice the standard √ error (S.E. = σ/ N ), where σ is the standard deviation. There is a 95% chance that the “true” value lies between the indicated standard error bars shown in Figure 4b. The results are accurate to within 2–3% for most data points. The binned data is presented for different cell sizes (1203 , 1603 , and 2403 ). Differences between the predictions at the different cell sizes are well within statistical error, indicating that finite-size effects are acceptably small. Finally, we consider the discretization error: the error due to the use of discrete voxels to represent continuum objects. To do this we coarse-grain the original images by generating realisations of the tomographic data sets at integer multiples of the resolution of the original image (i.e., n × 5.7 µm = 11.4 µm, 17.1 µm, . . .). To generate the images at poorer resolution, we bin voxel clusters of sizes n 3 (n = 2, 3, 4) using a simple majority rule. It has been previously shown (Roberts and
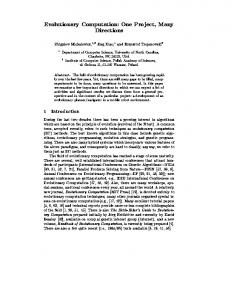
FIG. 3. Pore space images of a central 1203 subset of each of the four 4803 samples. The images are from the Fontainebleau cores at (a) 7.5% (7.04%), (b) 13% (12.6%), (c) 15% (19.6%), and (d) 22% (19.0%). The values in parentheses are the porosities of the individual 1203 subsamples compared to the macroscopic porosity of the original core plugs. The differences in the bulk and subsample porosities again illustrate how one may obtain a large ensemble of samples with variable porosity from a single core plug.
1400
Arns et al.
Garboczi, 2000) that the variation of an elastic property P follows
P(1) = P0 + a1,
(1)
where 1 is the voxel size, a is a fitting parameter, and P0 is the “continuum” value corresponding to infinite resolution. In Figure 4c, we show the scaling behavior of the discretization error with 1 for different porosities. Figure 4d shows the change in elasticity with resolution along with the continuum values P0 given by equation (1). It is important to note that even at a resolution of 1 = 5.7 µm, the predictions P(1) differ from the “continuum” P0 value by up to 15%. The errors increase approximately linearly with porosity. The statistical error in the continuum limit P0 , is estimated from equation (1) using the standard deviations at the different lattice sizes. ELASTIC PROPERTIES OF FONTAINEBLEAU SANDSTONE
Fluid substitution One of the most common problems in rock physics is the prediction of seismic velocities in rocks saturated with one fluid
from the velocities in rocks saturated with a second fluid or from dry rock velocities. The low-frequency Gassmann’s equations (Gassmann, 1951) relate the bulk and shear moduli of a saturated porous medium to the moduli of the same medium in a drained (dry) state. The effective bulk modulus K sat of the saturated rock is given by
K dry Kf K sat = + , K 0 − K sat K 0 − K dry φ(K 0 − K f )
(2)
where K 0 , K dry , and K f are the bulk moduli of the mineral material, the dry rock, and the pore fluid, respectively. Gassmann’s equations show that the shear modulus is mechanically independent of the properties of any fluid present in the pore space: µdry = µsat . Gassmann’s equations assume that the porous medium contains only one type of solid constituent with a homogeneous mineral modulus and that the pore space is statistically isotropic. The equation is valid for quasi-static conditions or at frequencies which are sufficiently low such that the induced pore pressures are in equilibrium throughout the pore space. These conditions coincide exactly with the conditions simulated with the finite-element approach. Fontainebleau
FIG. 4. Illustration of the errors in the numerical simulation of the elastic properties. In (a), we compare results on samples at 1203 to data from samples at 1603 and 2403 . This shows that finite size errors at 1203 remain small. We show in (b) the statistical fluctuations in the measurement of the bulk modulus for data sets at different sizes binned as described in the text. The fit to equation (1) is given in (c) for different porosities. In (d), the discretization errors are summarized. The original data at 1203 and 5.7 µm resolution and the results for poorer resolutions are shown. The continuum value fitted by matching to equation (1) is also shown.
Elastic Properties from X Ray–CT Images
sandstone is both clean and homogeneous and, in our simulations, we impose a uniform modulus in the solid phase. We would therefore expect the numerical data for Fontainebleau to obey Gassmann’s equations for different pore fluids. A comparison of the numerically predicted moduli of the Fontainebleau images for dry, water-saturated, and oilsaturated conditions to Gassmann’s equations provides a good test of the accuracy of the numerical results. The results of such a comparison are summarized in Figure 5. The numerical prediction for both the bulk and shear modulus are in excellent agreement with Gassmann’s equations.
1401
and Shtrikman, 1963), the self-consistent approximation (SCA) (Budiansky, 1965; Hill, 1965; Berryman, 1980), and the differential effective medium (DEM) approach (Berryman, 1992; Mavko et al., 1998). A specification of the volume fraction and constituent moduli allows the calculation of rigorous upper and lower bounds
Comparison with experiment In Figure 6, we compare the computed bulk and shear modulus data for dry and water-saturated Fontainebleau sandstone with experimentally measured values (Han, 1986). Although Han’s measurements were made at ultrasonic frequencies, he suggests that the frequency dispersions are minimal (the Biotdispersions ' 1% and the non-Biot dispersions negligible for clean sandstones). The predicted velocities are in good agreement with the experimental data. Generally, we see a slight overestimation of the measured moduli, which is most likely due to the finite resolution of the images. Small cracks and pores may not be resolved by the tomographic images but may have an effect on the elastic properties. This effect is enhanced for the dry samples (Han, 1986), which is in accord with our numerical data. The results from the simulations may be considered to provide an excellent upper bound for the bulk and shear velocity data. COMPARISON WITH THEORETICAL AND EMPIRICAL FORMULAS
A number of theoretical methods have been proposed for describing the properties of sedimentary rock. Bounding methods are rigorously based on microstructural information. The best bounds on the properties of a two-phase composite without specifying any geometric information beyond porosity are the Hashin-Shtrikman bounds (Hashin and Shtrikman, 1963). Higher order bounds can be derived (Milton, 1982), but the microstructural information needed to evaluate the results is not easy to obtain. A second approach is to assume a specific inclusion or pore shape, for which the dilute effect on the elastic properties can be analytically calculated. Various effective medium approaches (Hashin, 1983) can then be used to systematically approximate the results to higher porosity systems. Certain microstructures have been shown to correspond to these theories, but the physical structures are not realistic. Experimental measurements have often shown that relatively simple empirical relationships can be used to describe the properties of sedimentary rock. In this section, we compare a number of well-known bound predictions, effective medium approaches, and empirical results with the numerically “exact” data computed from the microtomographic images discussed in the previous section. Theoretical formulas We first compare our results to three of the most commonly used theoretical methods: Hashin-Shtrikman bounds (Hashin
FIG. 5. Comparison of the results of the simulations for dry, water-saturated, and oil-saturated conditions to Gassmann prediction based on the dry rock data. In (a), we give the numerical predictions for the dry rock data (squares) and show a best fit to the data points (solid line). We use this fit and equation (2) to predict the values of the water- and oil-saturated curves (dotted curves). We show the numerical predictions for the waterand oil-saturated results. The fit to the Gassmann’s equations is excellent, further indicating the ability of this methodology to quantitatively predict geophysical properties. In (b), we show that the shear modulus is independent of the pore fluid as predicted by Gassmann (1951).
1402
Arns et al.
for the elastic moduli of any composite material. The so-called Hashin-Shtrikman bounds (Hashin and Shtrikman, 1963) are given by
K H+ S = K s +
φ , (K f − K s )−1 + (1 − φ)(K s + 4/3µs )−1 (3)
µ+H S = µs +
φ . 2(1 − φ)(K s + 2µs ) −1 (µ f − µs ) + 5µs (K s + 4/3µs )
(4)
Upper and lower bounds are computed by interchanging the moduli of the solid and fluid components. In the case where one phase has zero elastic moduli, the lower bound becomes zero, and so only the upper bound is meaningful. A commonly used effective medium theory, the differential method (DEM) is constructed by incrementally adding inclusions of one phase into the second phase with known constituent properties. DEM does not treat each constituent symmetrically, but defines a preferred host material. From the composite host medium, K D∗ E M (φ) at some porosity value φ is known. One then treats K D∗ E M (φ) as the composite host medium and K D∗ E M (φ + dφ) as the effective constant after a small proportion dφ/(1 − φ) of the composite host has been replaced by inclusions of the second phase. For a solid matrix host, the coupled system of ordinary differential equations for the moduli is given by (Berryman, 1992)
d [K ∗ (φ)] = (K f − K ∗ )P ∗ , dφ d (1 − φ) [µ∗ (φ)] = (µ f − µ∗ )Q ∗ , dφ
(1 − φ)
(5) (6)
with initial conditions K ∗ (0) = K s and µ∗ (0) = µs , and where P ∗ and Q ∗ are shape dependent geometric factors for inclusions of the second phase in a background medium with effective moduli K ∗ and µ∗ , as given in several texts (see, e.g., Table 4.9.1 of Mavko et al., 1998). For the present work, we use the geometric factors for spherical grains (pores). In the self consistent model (SCA) of Hill (1965) and Budiansky (1965), the host medium is assumed to be the composite itself. The equations of elasticity are solved for a spherical inclusion embedded in a medium of unknown effective moduli. The effective moduli are then found by treating K scm , µscm as tunable quantities. The result is given in a general form (Berryman, 1980) by
φ(K f − K scm )P ∗ f i + (1 − φ)(K s − K scm )P ∗si = 0, φ(µ f − µscm )Q
FIG. 6. Comparison of the “continuum” prediction of the elastic simulations for the digitized images under dry and water-saturated (40 MPa) conditions to experimental data (Han, 1986). The figures give predictions for the (a) dry and (b) wet bulk modulus, and (c) the shear modulus.
∗fi
+ (1 − φ)(µs − µscm )Q
∗si
= 0.
(7) (8)
In the present work, we use the geometric factors for spherical pores and a number of granular inclusion shapes. The variation with granular shape had a minimal effect (∼1%) on the predictions, so we report results for spherical pores and grains only. The indices to P and Q note the inclusions of fluid “∗ f i” and solid “∗si” into a background medium of effective moduli K ∗ and µ∗ . As for the DEM equations, the solution for the effective bulk moduli is found iteratively. The SCA produces a single formula in which all components are treated equally, with no material distinguished as the host to others. Such a symmetric formula has been thought to be
Elastic Properties from X Ray–CT Images
1403
more appropriate in complex aggregates like granular rocks and has been shown (Berge et al., 1993) to accurately predict the mechanical behavior of a sintered glass bead sample. We compare the three theories to our numerical predictions and experimental data for both dry and water-saturated rock in Figure 7. We note that none of the theoretical methods results in a satisfactory fit to the experimental data. In contrast, the numerical results are in excellent agreement with the experimental data. The SCA theory gives a much better fit to the experimental data than either the DEM or the HashinShtrickman upper bound. This is consistent with the observation of Berge et al. (1993) that the SCA should more accurately predict the elastic properties of granular rocks. However, the numerical prediction is far superior to any of the theoretical estimates. This conclusion is in accord with recent results of Roberts and Garboczi (2000), who show that neither bounds, SCA, nor DEM successfully predict the properties of sintered granular materials. Empirical relationships Experimental measurements have often shown that relatively simple empirical relationships can be used to describe the properties of sedimentary rocks. Measurements by Wyllie et al. (1956, 1958, 1963) revealed that a relatively simple monotonic relationship exists between the sonic velocity and porosity in fluid-saturated sedimentary rocks with relatively uniform mineralogy. They approximated these relationships with the expression
φ 1−φ 1 = + , Vp Vp f V ps
(9)
where V p , V p f , and V ps are the P-wave sonic velocities of the saturated rock, the pore fluid, and the mineral p material making up the rock, respectively, and where V p = (K + 4/3µ)/ρ. The interpretation of this expression is that the total transit time is the sum of the transit time of the elastic wave in the mineral and the transit time in the pore fluid. It is therefore often referred to as the time-averaged equation. Raymer et al. (1980) suggested improvements to Wyllie’s empirical equation. For low porosities, they proposed the relationship
V p = (1 − φ)2 V ps + φV p f ,
φ < 37%.
(10)
A comparison of the predicted and numerically derived velocities for water-saturated Fontainebleau sandstone is shown in Figure 8. The Raymer et al. empirical equation along with the numerical data give a reasonable match to the measured data. Nur et al. (1991, 1995) proposed that the moduli of rocks should trend between the mineral grain modulus at low porosity to a value for a mineral-pore suspension at some limiting high porosity. The idea is based on the observation that for most porous materials there is a critical porosity φc which separates the mechanical behavior into two distinct domains. For porosities lower than φc the mineral grains are load bearing, whereas at porosities greater than φc the material falls apart. Theoretical models may be modified by incorporating percolation behavior at any desired φc by simply redefining the endpoint porosity. The simplest model of this type is based on a modified Voigt equation, where the original Voigt upper bound for a property P is given by P(φ) = P1 φ + P2 (1 − φ). This
FIG. 7. Comparison of the simulation results to a range of theories used to predict the moduli of porous rocks. The curves include predictions for the (a) dry and (b) water-saturated bulk modulus, and (c) the shear modulus. All theories overestimate the data for all porosities. The SCA gives the best theoretical fit to the data as expected from Berge et al. (1993), but is much poorer than the numerical prediction from the tomographic data.
1404
Arns et al.
empirical model (Nur et al., 1995) is based on the observation that the modulus of porous rocks often trends linearly with porosity between the two values in the load-bearing domain is given by
µ
K dr y µdr y
¶ φ = K0 1 − , φc µ ¶ φ = µ0 1 − . φc
(11) (12)
The critical porosity for sandstones was found empirically in Nur et al. (1991) to be φc = 0.40. Recently, Roberts and Garboczi (2000) developed empirical equations for the elastic properties of overlapping sphere packs under dry conditions:
¶2.23 φ = Y0 1 − , 0.652 ¶ µ φ 1.22 = 0.14 − 1 − × (ν0 − 0.14), 0.5
demonstrated that it is possible to obtain a large ensemble of samples from a single tomographic image which allows measures of elastic properties to be derived over a wide range of porosities. We have shown that it is practical to generate numerical data for dry, water-saturated, and oil-saturated conditions. The results for dry and water-saturated conditions are in good agreement with experimental measurements. The calculated change in the elastic properties due to fluid substitution is consistent with the exact Gassmann’s equations. Overall, we have demonstrated the feasibility of combining microtomographic images with elastic calculations to accurately predict the petrophysical properties of specific rock morphologies.
µ
Ydr y νdr y
(13) (14)
where Y0 and ν0 are the Young’s modulus and the Poisson ratio of the spherical grains, respectively. A comparison of the above equations with the numerical and experimental data is shown in Figure 9. The agreement is excellent over the full range of φ. CONCLUSIONS
We have shown, for the first time, that elastic propertyporosity relationships for clean sandstones can be derived directly from microtomographic images. Moreover, we have
FIG. 8. Comparison of the results of the simulations (squares and dashed line) for water-saturated sandstone to experimental data (circles) and the empirical equations of Wyllie et al. [equation (9)] and Raymer et al. [equation (10)]. The fit of the numerical data and the Raymer et al. equation is satisfactory. The Wyllie et al. equation gives a poor fit.
FIG. 9. Comparison of the simulation results to (a) the critical porosity model of Nur et al. (1995) and of Roberts and Garboczi (2000) for the dry case and (b) the critical porosity model of Nur et al. (1995) for the water-saturated case. Under both conditions, the fit of the empirical equations to experiment and numerical data is excellent and comparable to the data obtained from images.
Elastic Properties from X Ray–CT Images ACKNOWLEDGMENTS
MAK and WVP thank the Australian Research Council for financial support. We thank the Australian National University Supercomputing Facility and the Australian Partnership for Advanced Computing (APAC) for generous allocations of computer time. REFERENCES Adler, P., Jacquin, C., and Quiblier, J., 1990, Flow in simulated porous media: Internat. J. Multiphase Flow, 16, 691–712. Adler, P., Jacquin, C., and Thovert, J.-F., 1992, The formation factor of reconstructed porous media: Water Resources Res., 28, 1571. Arns, C. H., 2001, The influence of morphology on physical properties of reservoir rocks: Ph.D. thesis, Univ. of New South Wales. Arns, C. H., Knackstedt, M. A., Pinczewski, W. V., and Garboczi, E. G., 2001a, Accurate estimation of transport properties from microtomographic images: Geophys. Res. Lett., 28, 3361–3364. Arns, C. H., Knackstedt, M. A., Pinczewski, W. V., and Mecke, K. R., 2001b, Euler-Poincare` characteristics of classes of disordered media: Phys. Rev. E, 63, 031112. Auzerais, F. M., Dunsmuir, J., Ferreol, B. B., Martys, N., Olson, J., Ramakrishnan, T. S., Rothman, D. H., and Schwartz, L. M., 1996, Transport in sandstone: A study based on three dimensional microtomography: Geophys. Res. Lett., 23, 705–708. Bentz, D., and Martys, N., 1994, Hydraulic radius and transport in reconstructed model three-dimensional porous media: Transport in Porous Media, 17, 221–238. Berge, P. A., Berryman, J. G., and Bonner, B. P., 1993, Influence of microstructure on rock elastic properties: Geophys. Res. Lett., 20, 2619–2622. Berryman, J. G., 1980, Long-wavelength propagation in composite elastic media: J. Acoustic Soc. Am., 69, 416–424. Berryman, J. G., 1992, Single-scattering approximations for coefficients in Biot’s equations of poroelasticity: J. Acoust. Soc. Am., 91, 551– 571. ——— 1999, Origin of Gassmann’s equations: Geophysics, 64, 1627– 1629. Budiansky, B., 1965, On the elastic moduli of some heterogeneous materials: J. Mech. Phys. Solids, 13, 223–227. Castagna, J. P., Batzle, M. L., and Kan, T. K., 1993, Rock physics—The link between rock properties and AVO response, in Castagna, J. P., and Backus, M. M., Eds., Offset-dependent reflectivity—Theory and practice of AVO analysis: Soc. Expl. Geophys., 135–171. Dunsmuir, J. H., Ferguson, S. R., and D’Amico, K. L., 1991, Design and operation of an imaging X-ray detector for microtomography: Institute of Physics Conference Series, 121, 257–261. Flannery, B. P., Deckman, H. W., Roberge, W. G., and D’Amico, K. L., 1987, Three-dimensional X-ray microtomography: Science, 237, 1439–1444. Fredrich, J., Menendez, B., and Wong, T. F., 1995, Imaging the pore structure of geomaterials: Science, 268, 276–279. Garboczi, E. J., 1998, Finite element and finite difference programs for computing the linear electric and linear elastic properties of digital images of random materials: National Institute of Standards and Technology Internal Report 6269. Garboczi, E. J., and Day, A. R., 1995, An algorithm for calculating the effective linear elastic properties of heterogeneous materials: Threedimensional results for composites with equal phase poisson ratios: J. Mech. Phys. Solids, 43, 1349–1362. ¨ Gassmann, F., 1951, Uber die Elastizitat ¨ poroser Medien: Vierteljahrsschrift der Naturforschenden Gesellschaft in Zurich, ¨ 96, 1–23. Hadwiger, H., 1957, Vorlesungen uber ¨ Inhalt, Oberflache ¨ und Isoperimetrie: Springer. Han, D.-H., 1986, Effects of porosity and clay content on acoustic properties of sandstones and unconsolidated sediments: Ph.D. thesis, Stanford Univ.
1405
Hashin, Z., 1983, Analysis of composite materials: a survey: J. Appl. Mech., 50, 481–505. Hashin, Z., and Shtrikman, S., 1962, A variational approach to the theory of effective magnetic permeability of multiphase materials: J. Appl. Phys., 33, 3125–3131. ——— 1963, A variational approach to the elastic behaviour of multiphase materials: J. Mech. Phys. Solids, 11, 127–140. Hill, R., 1965, A self-consistent mechanics of composite materials: J. Mech. Phys. Solids, 13, 213–222. Joshi, M., 1974, A class of stochastic models for porous materials, Ph.D. thesis, Univ. of Kansas. Lin, C., and Cohen, M. H., 1982, Quantitative methods for microgeometric modelling: J. Appl. Phys., 53, 4152–4165. Lindquist, B., and Venkatarangan, A., 1999, Investigating 3D geometry of porous media from high resolution images: Phys. and Chem. of the Earth, 24, 87. Lindquist, W. B., Venkatarangan, A., Dunsmuir, J., and Wong, T. F., 2000, Pore and throat size distributions measured from synchrotron x-ray tomographic images of Fontainbleau sandstones: J. Geophys. Res., 105B, 21508. Mavko, G., Mukerji, T., and Dvorkin, J., 1998, The rock physics handbook: Cambridge Univ. Press. Milton, G. W., 1981, Bounds on the electromagnetic, elastic, and other properties of two-component composites: Phys. Rev. Lett., 46, 542– 545. ——— 1982, Bounds on the elastic and transport properties of twocomponent composites: J. Mech. Phys. Solids, 30, 177–191. Nur, A., Marion, D., and Yin, H., 1991, Wave velocities in sediments, in Hovem, J., Richardson, M. D., and Stoll, R. D., Eds., Shear waves in marine sediments: Kluwer Academic, 131–140. Nur, A., Mavko, G., Dvorkin, J., and Galmundi, D., 1995, Critical porosity: The key to relating physical properties to porosity in rocks: 65th Ann. Internat. Mtg., Soc. Expl. Geophys., Expanded Abstracts, 878. Oh, W., and Lindquist, W. B., 1999, Image thresholding by indicator kriging: IEEE Trans. on Pattern Analysis and Machine Intelligence, 21, 590. Oren, P., and Bakke, S., 2002, Process-based reconstruction of sandstones and prediction of transport properties: Transport in Porous Media, 46, 311–343. Quiblier, J., 1984, A new three-dimensional modeling technique for studying porous media: J. Colloid Interface Sci., 98, 84–102. Raymer, L. L., Hunt, E. R., and Gardner, J. S., 1980, An improved sonic transit time to porosity transform: 21st Ann. Logging Symp., Soc. Prof. Well Log Analysts, paper P. Roberts, A. P., 1997, Statistical reconstruction of three-dimensional porous media from two-dimensional images: Phys. Rev. E, 56, 3203– 3214. Roberts, A. P., and Garboczi, E. J., 2000, Elastic properties of model porous ceramics: J. Amer. Ceramic Soc., 83, 3041–3048. Roberts, A. P., and Knackstedt, M., 1996, Structure-property correlations in model composite materials: Phys. Rev. E, 54, 2313-2328. Santalo, ´ L. A., 1953, Introduction to integral geometry: Hermann & Cie Editeurs. Schwartz, L. M., Auzerais, F. M., Dunsmuir, J., Martys, N., Bentz, D. P., and Torquato, S., 1994, Transport and diffusion in three-dimensional composite media: Physica A, 207, 28–36. Spanne, P., Thovert, J., Jacquin, J., Lindquist, W. B., Jones, K., and Coker, D., 1994, Synchotron computed microtomography of porous media: Topology and transports: Phys. Rev. Lett., 73, 2001– 2004. Thovert, J.-F., Yousefian, F., Spanne, P., Jacquin, C. G., and Adler, P. M., 2001, Phys. Rev. E, 63, 061307. Wyllie, M., Gregory, A., and Gardner, G., 1956, Elastic wave velocities in heterogeneous and porous media: Geophysics, 21, 41–70. ——— 1958, An experimental investigation of factors affecting elastic wave velocities in porous media: Geophysics, 23, 459–493. ——— 1963, Studies of elastic wave attenuation in porous media: Geophysics, 27, 569–589. Yeong, C. L. Y., and Torquato, S., 1998, Reconstructing random media: Phys. Rev. E, 57, 495–506.