An alternative to Mark-. Houwink equation was ... Mark-Houwink equation is given by: [ ] a ..... This algorithm is based on positions r(t), accelerations a(t), ...... Gohlke, J. Mongan, V. Hornak, G. Cui, P. Beroza, C. Schafmeister, J.W. Caldwell, W.S..
COMPUTATIONAL AND EXPERIMENTAL INVESTIGATION OF THE ROLE OF HYALURONIC ACID-PROTEIN INTERACTIONS IN THE RHEOLOGY OF SYNOVIAL FLUID
by AMOL BHUSARI, B.Tech. A THESIS IN CHEMICAL ENGINEERING Submitted to the Graduate Faculty of Texas Tech University in Partial Fulfillment of the Requirements for the Degree of MASTER OF SCIENCE IN CHEMICAL ENGINEERING
Approved Rajesh Khare Chairperson of the committee
Mark Vaughn Sukalyan Bhattacharya Accepted John Borrelli Dean of Graduate School
May, 2007
Copyright 2007, Amol Bhusari
Texas Tech University, Amol Bhusari, May 2007
ACKNOWLEDGEMENTS
As I complete this work on the role of Hyaluronic acid-protein interactions in the rheology of synovial fluid, I think of the tortuous path that led me to this accomplishment. This also reminds me of people who helped me all along, and without whom, this work would not have been possible. The greatest source of inspiration has been my advisor, Dr. Rajesh Khare. He has been a strong support all through, getting me out of problems and making me think in the right direction. He went beyond just guiding me in my thesis work by instilling values and work ethics. Dedication, systematic work, punctuality were some of the things I tried to learn from him during this one and a half year journey, and at the end of it, I am proud and content with the work I am presenting here towards completion of my master’s degree. There has been not a single dull moment in pursuing this goal, thanks to my colleagues and roommates. They have been understanding and accommodating, and have helped me in all possible ways. They have supported me, through thick and thin, and I would say, I am lucky to have their company. I wish to thank people at the High Performance Computing Center, whose help was valuable in getting the Molecular Dynamics simulations done on the Khare Community Cluster. I would take the opportunity to thank the Department Chair, Dr. Naz Karim for providing all the facilities, and people at the office of the Department of Chemical Engineering for all their help. In the end, I would like to thank my family for all the love and affection they have showered on me. Their continuous support and encouragement has guided me through all my endeavors.
ii
Texas Tech University, Amol Bhusari, May 2007
TABLE OF CONTENTS
ACKNOWLEDGEMENTS ………………………………………..
ii
ABSTRACT ………………………………………………………..
v
LIST OF TABLES …………………………………………………
viii
LIST OF FIGURES ………………………………………………...
ix
1. INTRODUCTION ……………………………………………….
1
2. BACKGROUND …………………………………………………
6
2.1 Rheology of pure HA …………………………………...
6
2.2 Effect of proteins on rheology of HA …………………..
8
2.3 Effect of other additives on rheology of HA ……………
11
2.4 Study of viscoelastic properties of HA …………………
14
2.5 Study of thin film properties ……………………………
16
2.6 Molecular Dynamics simulations of HA .………………
17
2.7 Studies on samples from arthritic patients ……………...
19
2.8 Proposed work ………………………………………….
21
3.MOLECULAR DYNAMICS SIMULATIONS…………………..
25
3.1 Introduction to Molecular Dynamics simulations ………
25
3.2 Generation of polymer for simulations …………………
29
3.2.1 Analysis of simulations ………………………
31
3.3 HA decamer-water simulation …………………………
33
3.3.1 Analysis of HA decamer-water simulation ….. ii
34
Texas Tech University, Amol Bhusari, May 2007 3.4 HA-protein-water simulation ………………………………..
44
3.4.1 Analysis of HA-protein-water simulation …………
45
3.4.2 HA monomer-protein interactions ………………...
52
3.5 HA trimers-water MD run …………………………………..
53
3.5.1 Analysis of HA trimers-water MD run ……………
54
3.6 Visualizations ………………………………………………...
62
4. RHEOLOGICAL MEASUREMENTS …………………................…..
67
4.1 Rheometry …………………………………………………….
67
4.2 Viscoelasticity and dynamic shear ……………………………
68
4.3 Sample preparation ……………………………………………
71
4.4 Experimental procedure ……………………………………….
72
4.5 Results of oscillatory shear measurements ……………………
74
4.5.1 Oscillatory shear measurement results for samples with NaHA concentration 10 mg/mL ……………………
74
4.5.2 Results from steady flow measurements for 10 mg/mL NaHA ……………………………………
87
4.5.3 Data from steady flow and oscillatory shear measurements ……………………………………….
99
4.5.4 Temperature dependence of viscosity ……………….
102
4.5.5 Effect of proteins ……………………………………
103
4.5.6 Effect of different BSA concentrations ……………..
104
4.5.7 Effect of different γ-globulin concentrations ……….
104
5. SUMMARY & CONCLUSIONS ………………………………... …...
105
iii
Texas Tech University, Amol Bhusari, May 2007 BIBLIOGRAPHY …………………………………………………………
108
APPENDIX …………………………………………………......................
115
iv
Texas Tech University, Amol Bhusari, May 2007 ABSTRACT Hyaluronic acid (HA) is the key component of synovial fluid responsible for lubrication in human joints. It has a concentration of 3 mg/mL in healthy synovial fluid. It behaves as a lubricant and a shock absorber in synovial fluid . This glycosaminoglycan (GAG) is a very important biomacromolecule on account of its role in various biological processes like signal transduction and cell motility. It is widely used in the treatment of inflammatory and degenerative joint diseases . Intra-articular injections of HA are administered to patients of osteoarthritis (OA) for healing and regeneration of the cartilage, and are known to provide temporary relief from pain in the knee joint. However, the concept behind this treatment for OA is not clear. If the cause of lubrication in synovial fluid can be found out, it can help significantly in the treatment of arthritis. Studies by Oates and coworkers point towards protein-HA aggregation playing an important role in the viscoelastic properties of synovial fluid. This, however, is in contrast with their earlier work where they suggest HA-protein repulsion. The mechanism of lubrication needs to be explored further and the components of synovial fluid responsible for its viscoelastic properties need to be studied. Studies on viscoelastic properties of HA and artificial synovial fluid have been carried out, but these studies do not focus on the role of proteins on account of their interaction with HA. They do not discuss the individual effects of proteins (serum albumin, γ-globulin) on the viscoelastic properties of HA. There is a need to look into the influence of individual proteins on HA viscoelasticity due to possible structure formation.
v
Texas Tech University, Amol Bhusari, May 2007 To delve deeper into this aspect, we undertake rheological measurements on samples of HA and HA+ proteins. These measurements are taken at three different temperatures (20, 25, 37 °C) on the TA instruments AR-2000 rheometer. All samples contain 10 mg/mL Sodium Hyaluronate (NaHA). Bovine serum albumin (BSA) and γglobulin concentrations of 12 mg/mL and 2.4 mg/mL have been used. These correspond to the concentrations in normal synovial fluid. Both steady flow and oscillatory shear measurements have been performed on these samples. The properties studied are zero shear viscosities from steady flow measurements, and G′ (storage modulus) and G″ (loss modulus) from oscillatory shear measurements. Characteristic relaxation time is determined from the crossover of G′ and G″. Molecular dynamics can help in studying the intermolecular interactions between various components of the synovial fluid. We undertake molecular dynamics simulations on systems of HA and water as well as HA-proteins-water. These simulations are analyzed for hydrogen bond formation and radial distribution functions. Addition of proteins to HA is found to affect both steady flow and dynamic mechanical properties of HA solutions. Addition of proteins is found to increase the zero shear viscosity of HA. Oscillatory shear properties show that both G′ and G″ values increase with angular frequency for addition of proteins to HA. Characteristic relaxation time determined from the crossover of G′ and G″ also increases with the addition of proteins. The changes in viscoelastic properties have been found to be significant due to the addition of γ-globulin than BSA, although γ-globulin is at a lower concentration than BSA.
vi
Texas Tech University, Amol Bhusari, May 2007 Molecular dynamics simulations carried out in this work on a system containing HA, proteins and water shows that HA is in more spatial proximity to proteins than water. Another MD simulation of a HA decamer and water shows that HA does not associate with water. Another MD simulation of HA trimers and water has shown that HA trimers form aggregates among themselves rather than binding with water. The Hydrogen bond calculations for systems of HA-water and HA-protein-water show that the hydrogen bond formation between HA and water molecules is disrupted due to addition of the protein (BSA). The decrease in the number of Hydrogen bonds between HA-water due to addition of BSA confirms that interaction exists between HA and BSA. Thus, addition of proteins is seen to affect both the structure and rheology of HA solutions. Rheological studies on samples of synovial fluids with different protein concentrations from patients of OA would throw more light on the effect of HA-protein interactions. Identification of HA-protein binding sites could help analyze the HAprotein-water MD simulations in a better way. This work on HA-protein interaction shows that it is not just HA, but other components of synovial fluid also, which are responsible for rheological properties of synovial fluid.
vii
Texas Tech University, Amol Bhusari, May 2007 LIST OF TABLES 1.1 Chemical composition of physiological
2
synovial fluid 3.1 Comparison of charges assigned as per
31
OPLS-AA and AMBER FF03 force fields 4.1 Effect of addition of proteins on
99
viscoelastic properties of NaHA 4.2 Effect of BSA concentration on
100
viscoelastic properties of HA solution 4.3 Effect of γ-globulin concentration on
100
viscoelastic properties of HA solution 4.4 Effect of proteins on zero shear viscosity
101
of NaHA 4.5 Effect of proteins on the viscosity of NaHA
101
4.6 Effect of proteins on the relaxation time
102
of NaHA
viii
Texas Tech University, Amol Bhusari, May 2007 LIST OF FIGURES 1.1 Disaccharide repeating unit of hyaluronic acid
1
1.2 Structure of Hyaluronic acid trimer
5
1.3 Helical structure of 10 units of HA
5
3.1 Representation of a monosaccharide with atom labels
30
3.2 Geometrical Hydrogen bond criterion
32
3.3 Plot of Density vs. time for the 5.7 ns HA decamer-water
34
NPT mdrun at 1 bar and 298 K 3.4 Plot of Pressure vs. time for the 5.7 ns HA decamer-water
35
NPT mdrun at 1 bar and 298 K 3.5 Plot of Temperature vs. time for the 5.7 ns HA decamer-water
36
NPT mdrun at 1 bar and 298 K 3.6 Plot of Total Energy vs. time for the 5.7 ns HA decamer-water
37
NPT mdrun at 1 bar and 298 K 3.7 Number of Hydrogen bonds between HA decamer and water
38
for the 5.7 ns HA decamer-water NPT mdrun at 1 bar and 298 K 3.8 Plot of radial distribution function ( HA decamer-water) for the 5.7 ns HA decamer-water NPT mdrun at 1 bar and 298 K
ix
39
Texas Tech University, Amol Bhusari, May 2007 3.9.1 Plot of radial distribution function
40
(O7 of first monomer and O7 of last monomer during 1-2 ns) for the 5.7 ns HA decamer-water NPT mdrun at 1 bar and 298 K 3.9.2 Plot of radial distribution function (O7 of first monomer and O7 of last monomer during 5-5.7ns) for the 5.7 ns HA decamer-water NPT mdrun at 1 bar and 298 K
41
3.9.3 Plot of radial distribution function (C6 of first monomer and C6 of last monomer during 1-2 ns) for the 5.7 ns HA decamer-water NPT mdrun at 1 bar and 298 K
42
3.9.4 Plot of radial distribution function (C6 of first monomer and C6 of last monomer during 5-5.7 ns) for the 5.7 ns HA decamer-water NPT mdrun at 1 bar and 298 K
43
3.10 Plot of density vs. time for the 20 ns HA monomers-protein-water NPT mdrun at 1 bar and 298 K
45
3.11 Plot of pressure vs. time for the 20 ns HA monomers-protein-water NPT mdrun at 1 bar and 298 K
46
3.12 Plot of temperature vs. time for the 20 ns HA monomers-protein-water NPT mdrun at 1 bar and 298 K
47
3.13 Plot of Total Energy vs. time for the 20 ns HA monomers-protein-water NPT mdrun at 1 bar and 298 K
48
3.14 Number of Hydrogen bonds between all HA monomers-water vs. time for the 20 ns HA monomers-protein-water NPT mdrun at 1 bar and 298 K
49
3.15 Number of Hydrogen bonds between all HA monomers-protein vs. time for the 20 ns HA monomers-protein-water NPT mdrun at 1 bar and 298 K
50
3.16 Radial distribution function (HA monomer-water) for the 20 ns HA monomers-protein-water NPT mdrun at 1 bar and 298 K
51
3.17 Radial distribution function (HA monomer-protein) for the 20 ns HA monomers-protein-water NPT mdrun at 1 bar and 298 K
52
3.17.1 Plot of density vs. time for the 5 ns HA trimers-water NPT mdrun at 1 bar and 300 K
54
x
Texas Tech University, Amol Bhusari, May 2007
3.17.2 Plot of pressure Vs time for the 5 ns HA trimers-water NPT mdrun at 1 bar and 300 K
55
3.17.3 Plot of temperature Vs time for the 5 ns HA trimers-water NPT mdrun at 1 bar and 300 K
56
3.17.4 Plot of Total Energy Vs time for the 5 ns HA trimers-water NPT mdrun at 1 bar and 300 K
57
3.17.5 Radial distribution function (O6 of first trimer and O6 of second trimer) during 1-2 ns for the 5 ns HA trimers-water NPT mdrun at 1 bar and 300 K
58
3.17.6 Radial distribution function (O6 of first trimer and O6 of second trimer) during 4-5 ns for the 5 ns HA trimers-water NPT mdrun at 1 bar and 300 K
59
3.17.7 Radial distribution function (C6 of first trimer and C6 of second trimer) during 1-2 ns for the 5 ns HA trimers-water NPT mdrun at 1 bar and 300 K
60
3.17.8 Radial distribution function (C6 of first trimer and C6 of second trimer) during 4-5 ns for the 5 ns HA trimers-water NPT mdrun at 1 bar and 300 K
61
3.18 HA monomers in proximity with Protein atoms
62
3.19 HA – protein and water after a 20 ns MD run
63
3.20 HA decamer generated in XLEAP
64
3.21 HA decamer coiled around itself after 5.7 ns of MD run
65
3.22 HA trimers aggregated after 5 ns of HA trimers-water run
66
4.1 Schematic of a rotational rheometer
67
4.2 Cone and plate geometry representation showing correct volume of sample loaded between the cone and plate
72
4.4 Sample plot of mean G’ and mean G” Vs angular frequency with error bars showing standard deviation from mean values
74
xi
Texas Tech University, Amol Bhusari, May 2007 4.5 Storage and Loss moduli from oscillatory shear measurement at 20 °C using cone & plate geometry on a sample containing 10 mg/mL NaHA in PBS (pH 7.4)
75
4.6 Storage and loss moduli from oscillatory shear measurement at 25 °C using cone & plate geometry on a sample containing 10 mg/mL NaHA in PBS (pH 7.4)
76
4.7 Storage and loss moduli from oscillatory shear measurement at 37°C using cone & plate geometry on a sample containing 10 mg/mL NaHA in PBS (pH 7.4)
77
4.8 Storage and loss moduli from oscillatory shear measurement at 20 °C using cone & plate geometry on a sample containing
78
10 mg/mL NaHA, 12 mg/mL BSA in PBS (pH 7.4) 4.9 Storage and loss moduli from oscillatory shear measurement at 25 °C using cone & plate geometry on a sample containing
79
10 mg/mL NaHA, 12 mg/mL BSA in PBS (pH 7.4) 4.10 Storage and loss moduli from oscillatory shear measurement at 37 °C using cone & plate geometry on a sample containing
80
10 mg/mL NaHA, 12 mg/mL BSA in PBS (pH 7.4) 4.11 Storage and loss moduli from oscillatory shear measurement at 20 °C using cone & plate geometry on a sample containing
81
10 mg/mL NaHA, 2.4 mg/mL γ-globulin in PBS (pH 7.4) 4.12 Storage and loss moduli from oscillatory shear measurement at 25 °C using cone & plate geometry on a sample containing
82
10 mg/mL NaHA, 2.4 mg/mL γ-globulin in PBS (pH 7.4) 4.13 Storage and loss moduli from oscillatory shear measurement at 37 °C using cone & plate geometry on a sample containing
83
10 mg/mL NaHA, 2.4 mg/mL γ-globulin in PBS (pH 7.4) 4.14 Storage and loss moduli from oscillatory shear measurement at 20 °C using cone & plate geometry on a sample containing
84
10 mg/mL NaHA, 2.4 mg/mL γ-globulin, 12 mg/mL BSA in PBS (pH 7.4) 4.15 Storage and loss moduli from oscillatory shear measurement at 25 °C using cone & plate geometry on a sample containing 10 mg/mL NaHA, 2.4 mg/mL γ-globulin, 12 mg/mL BSA in PBS (pH 7.4) xii
85
Texas Tech University, Amol Bhusari, May 2007 4.16 Storage and loss moduli from oscillatory shear measurement at 37 °C using cone & plate geometry on a sample containing 10 mg/mL NaHA, 2.4 mg/mL γ-globulin, 12 mg/mL BSA in PBS (pH 7.4)
86
4.17 Viscosity and shear stress profile from a steady flow measurement at 20 °C using cone & plate geometry on a sample containing 10 mg/mL NaHA in PBS (pH 7.4)
87
4.18 Viscosity from steady flow measurement at 25 °C using cone & plate geometry on a sample containing 10 mg/mL NaHA in PBS (pH 7.4)
88
4.19 Viscosity from steady flow measurement at 37 °C using cone & plate geometry on a sample containing 10 mg/mL NaHA in PBS (pH 7.4)
89
4.20 Viscosity from steady flow measurement at 20 °C using cone & plate geometry on a sample containing 10 mg/mL NaHA, 12 mg/mL BSA in PBS (pH 7.4)
90
4.21 Viscosity from steady flow measurement at 25 °C using cone & plate geometry on a sample containing 10 mg/mL NaHA, 12 mg/mL BSA in PBS (pH 7.4)
91
4.22 Viscosity from steady flow measurement at 37 °C using cone & plate geometry on a sample containing 10 mg/mL NaHA, 12 mg/mL BSA in PBS (pH 7.4)
92
4.23 Viscosity from steady flow measurement at 20 °C using cone & plate geometry on a sample containing 10 mg/mL NaHA, 2.4 mg/mL γ-globulin in PBS (pH 7.4)
93
4.24 Viscosity from steady flow measurement at 25 °C using cone & plate geometry on a sample containing 10 mg/mL NaHA, 2.4 mg/mL γ-globulin in PBS (pH 7.4)
94
4.25 Viscosity from steady flow measurement at 37 °C using cone & plate geometry on a sample containing 10 mg/mL NaHA, 2.4 mg/mL γ-globulin in PBS (pH 7.4)
95
4.26 Viscosity from steady flow measurement at 20 °C using cone & plate geometry on a sample containing 10 mg/mL NaHA, 2.4 mg/mL γ-globulin, 12 mg/mL BSA in PBS (pH 7.4)
96
xiii
Texas Tech University, Amol Bhusari, May 2007 4.27 Viscosity from steady flow measurement at 25 °C using cone & plate geometry on a sample containing 10 mg/mL NaHA, 2.4 mg/mL γ-globulin, 12 mg/mL BSA in PBS (pH 7.4)
97
4.28 Viscosity from steady flow measurement at 37 °C using cone & plate geometry on a sample containing 10 mg/mL NaHA, 2.4 mg/mL γ-globulin, 12 mg/mL BSA in PBS (pH 7.4)
98
xiv
Texas Tech University, Amol Bhusari, May 2007 CHAPTER 1 INTRODUCTION Hyaluronic acid which is also called as hyaluronan and abbreviated as HA, is a key component of the synovial fluid and the intercellular matrix of connective tissues such as cartilage and eye vitreous humor [1]. It is a linear glycosaminoglycan (GAG) composed of a repeating disaccharide unit of D-glucuronic acid and N-acetyl-Dglucosamine linked by β 1-4 and β 1-3 glycosidic bonds. The viscoelastic properties of HA and its role in different biological processes like signal transduction and cell motility make it a very important material for biomedical applications. Large polymers of HA are space filling, intermediate sized polymers of 25-30 disaccharides are inflammatory and small polymers induce heat shock proteins [2] (abbreviated as HSPs, these are proteins which show enhanced expression at elevated temperature). It is believed [1] that fibroblasts beneath the synovial membrane intima and synovial membrane lining cells produce HA. HA is assumed to modulate inflammation processes, and is thought to be an effective drug carrier due to its high affinity with body tissues. New applications of HA include HA as a major component of scaffolds engineered with cells effective for articular cartilage repair.
Fig. 1.1 Disaccharide repeating unit of hyaluronic acid [3] 1
Texas Tech University, Amol Bhusari, May 2007
HA was discovered by Meyer and Palmer in 1934 in the vitreous humor of cattle eyes [4]. Commercially available HA is extracted from umbilical cord, rooster comb, synovial fluid or vitreous humor. Biotechnological production of HA is done from Streptococcus. Table 1.1 Chemical composition of physiological synovial fluid [5] COMPONENT
CONCENTRATION (g/100mL)
Na+
0.3335
Cl-
0.394
Urea
0.0082
Urate
0.00155
Glucose
0.066
Lipids
0.24
Phospholipids
0.08
Proteins
1.90
Albumin
1.20
γ-globulin
0.24
Hyaluronates
0.2-0.4
Lubricin
0.005
HA is used in several biomedical applications. It facilitates eye surgery and protects the corneal endothelium [6]. It is widely used in the treatment of inflammatory and degenerative joint diseases [7]. Physiologically, the synovial fluid lubricates the joint 2
Texas Tech University, Amol Bhusari, May 2007 during resting and walking and prevents mechanical damage during running. Hence it behaves as a viscous fluid at low frequency and an elastic ‘shock-absorber’ at high frequency [8]. Due to its viscoelastic properties, Hyaluronic acid acts as a lubricant and shock absorber in synovial fluid [9,10,11]. The molecular weight of HA in synovial fluid of human knee is reported to be six million [12]. Schurz et al [13] have found that the protein concentration in HA is 10-30 mg/mL. Their rheological measurements also show that decrease in the molecular mass of HA causes deterioration of synovial fluid. Soltes et al [14] have pointed out that under inflammatory conditions like osteoarthritis HA is degraded and its viscosity is reduced. This reduces its lubricant and shock absorbing capabilities, thus deteriorating joint movement and pain. It has been suggested that intraarticular application of highly purified Sodium Hyaluronate with a high molecular weight can influence healing and regeneration of cartilage and soft tissues of a joint. The concept was introduced by Balazs and Denlinger [15]. NaHA is used as a medicine for arthritis and a surgical aid in ophthalmic surgery [12,16,17]. The concentration in human joint is around 3 mg/mL and that in vitreous humor is highest, around 10 mg/mL [18]. HA is proposed to represent an extended random coil at low concentrations [19] (ca 1 mg/mL) and forming an entanglement network at concentrations greater than 1 mg/mL [20]. HA has the ability to associate with large quantities of water to form a jelly-like matrix between cells [21]. For normal human joint function, both high molecular mass of HA and high concentration of HA is necessary [13]. HA in synovial fluid allows exchange of nutrients and waste products from the joint.
3
Texas Tech University, Amol Bhusari, May 2007 The flow properties of synovial fluid from human and cattle joints show that synovial fluids are shear thinning and show a power law behavior at high shear rates, and a constant zero shear viscosity at low shear rates [11,12]. Interactions with proteins can alter the rheology of synovial fluid [22] by changing the viscosity under steady shear. Hyaluronan molecular weight in the articular cartilage decreases significantly from 2 x 10⁶ to 3 x 10⁵ Da between 2.5 and 86 years of age[18]. Aggrecan content is also shown to decrease during aging and inflammation [22], and this can affect cartilage elasticity. (Aggrecan is an aggregate of chondroitin sulfate, a GAG; and is an important component of the cartilage) HA is found to be chemically degraded by hydroxyl radicals and peroxynitrite which may be generated during inflammatory conditions [23]. Reduced molecular weight of HA is observed during osteoarthritis [12]. HA is shown to be a network forming polymer. Scott et al have shown that HA chains form an irregular honeycomb-like structure of enormous dimensions even at low concentration of 1 µg / mL [24]. The works of Cleland on Sodium Hyaluronate solutions show that it behaves as a worm-like polyelectrolyte [25].
4
Texas Tech University, Amol Bhusari, May 2007
Fig 1.2 Structure of Hyaluronic acid trimer [26]
Fig.1.3 Helical structure of 10 units of HA ( structure generated in XLEAP [27] and viewed in VMD [27A])
5
Texas Tech University, Amol Bhusari, May 2007 CHAPTER 2 BACKGROUND
2.1 Rheology of pure HA Rheology of synovial fluid in terms of an entanglement network has been studied by Schurz [13]. He has compared the network properties of HA from a deteriorated joint with that of pure HA and polyacrylamide. The properties studied were shear viscosity and solution elasticity. He found that synovial fluid from a healthy joint was characterized by high viscosity, high solution elasticity where as synovial fluid from a deteriorated joint showed reduced viscosity and a reduced solution elasticity. The deterioration is supposed to be caused by decrease in the molecular weight of HA. Schurz has proposed that beyond an overlap concentration of 0.5 mg/mL, HA forms a dense entanglement network. Rheological measurements for healthy synovia show a high zero shear viscosity and shear thinning. There is a clear plateau in shear modulus G′ for shear rates of 1 to 100 sec-1, which is same as that for normal knee movements. The arthritic synovia shows decrease in zero shear viscosity and shear modulus G′ no longer shows a plateau when measured against shear rate. The plateau observed in G′ is proposed to play an important role in the damping mechanism. Rheological measurements to study the effect of concentration and molecular weight have been done by Ambrosio et al [28]. Hyaluronic acid of two different molecular weights ( 150 kDa and ca. 2 kDa) was used. Viscosity was determined as a function of shear rate. Low molecular weight HA exhibited Newtonian characteristics throughout the shear rate analyzed (100 to 103 sec-1). For high molecular weight HA, a 6
Texas Tech University, Amol Bhusari, May 2007 Newtonian plateau was observed at low shear rates and shear thinning behavior was observed at shear rates greater than 1 sec-1. Change in molecular weight of Hyaluronic acid during measurement with a coneplate rotational viscometer was observed by Miyazaki, Yomota and Okada [29]. Measured viscosity values of HA in NaCl solution decreased gradually. The decrease in apparent viscosity was pronounced in high molecular weight HA than low molecular weight HA. From LALLS (Low Angle Laser Light Scattering) measurements, it was concluded that the cause for reduction in viscosity could be attributed to degradation of polymer chains, rather than disentanglement of characteristic network. High molecular weight chains were found to be ‘preferably’ severed. Gatej and coworkers [30] have studied the effect of pH on rheological behavior of hyaluronan in aqueous solution. They have also studied the structural changes associated with change in pH. From the molecular weight distribution they have interpreted that degradation of the polymer occurs under both acidic (pH=1.6) and basic (pH=12.6) conditions. They have studied the rheological behavior of 10g/L Sodium Hyaluronate solutions at 20°C on a AR 1000 rheometer with cone and plate geometry. G′ and G″ are studied for a range of angular frequencies. Rheological studies indicate that the behavior of the polymer remains unchanged between pH 2.8 and 12. At a pH of 2.5, a thermoreversible gel-like behavior is observed. It is proposed that hydrogen bond network might be formed as net charge of polymer decreases. At a pH of 1.6 polymer is resolubilized. A reversible transition to a random coil is seen for pH greater than 12.5
7
Texas Tech University, Amol Bhusari, May 2007 Dubin et al have shown that bovine serum albumin (BSA, the most abundant protein in synovial fluid) binds to NaHA at low pH but not above pH 5. Hence, Oates suggests that under physiological conditions (pH=7.4), binding between NaHA and BSA (bovine serum albumin) in synovial fluid is unlikely. Mazzucco et al [31] have examined the flow properties of joint fluid in total knee arthroplasty (TKA) patients. All samples showed characteristic shear thinning behavior but the shear viscosity differed in three orders of magnitude in normal samples of synovial fluid and samples of patients undergoing TKA. Bovine Serum Albumin (BSA) however showed Newtonian behavior throughout the range Cowman and Matsuoka [32] have discussed experimental studies (viscometric analysis, osmotic pressure analysis, light scattering analysis, NMR spectroscopy, ORD and CD spectroscopy, EM, AFM) on the structure of HA. HA in neutral aqueous solution containing NaCl shows behavior like that of a semi-flexible polymer. HA shows the capability of self association in the formation of viscoelastic putty state at pH 2.5 in the presence of salt and gel. Ordered and associated structures resulting from intramolecular condensation have been observed for HA on surfaces in the presence of surface structured water.
2.2 Effect of proteins on rheology of HA Grymonpre et al [33] have carried out electrostatic protein modeling and light scattering studies of Serum Albumin-HA binding site. The electrostatic calculations suggest that the binding energy for the formation of the complex is ca. 1 kT. They suggest that weak electrostatic binding could result in the protein-glycosaminoglycan 8
Texas Tech University, Amol Bhusari, May 2007 interaction. With the combined results of modeling and experimentation, they have attempted to define the domain governing binding of serum albumin to HA. The viscosity of HA increases when it combines with synovial fluid proteins [11]. Albumin, being the most concentrated protein in synovial fluid, the increase in viscosity is attributed to an expansion of hyaluronic acid upon binding albumin [11]. Xu et al. have observed HAbovine serum albumin interaction for pH less than 5 only [34]. These results are in line with the scattering data of Grymonpre et al. which is not close to physiological conditions. Synovium allows exchange of proteins between blood and synovial fluid. Low viscosities of synovial fluid are reported for RA (Rheumatoid Arthritis) and OA (Osteoarthritis) patients. RA patients are found to have higher than normal albumin concentration in their synovial fluid and smaller than normal albumin concentration in their plasma [35]. It is suggested by Oates et al. [36] that albumin binds to itself forming multi protein polymeric aggregates. Lot of studies show that mechanical properties of synovial fluid are controlled by high molecular weight of NaHA. Boger et al. [11] observed that proteins contribute to the mechanical properties of synovial fluid. Krause et al [37] have worked on rheology of Sodium Hyaluronate (sodium salt of Hyaluronic acid) under physiological conditions (pH 7.4 and temperature 37 °C ). The main purpose of their study was to determine whether NaHA (Sodium Hyaluronate) forms reversible gel in solution. There is no evidence of reversible gel formation in solution from the experiments performed for studying viscosities versus shear rates. This is believed to be caused by interactions of NaHA and proteins. 9
Texas Tech University, Amol Bhusari, May 2007
Oates et al. [36] have found synovial fluid and albumin solutions to be rheopectic (i.e. stress increases in time with steady shear). The reason given is protein aggregation. They have predicted that stress is enhanced by entanglement of protein network with NaHA (Sodium Hyaluronate). Protein aggregation is suggested to play an important role in mechanical properties of synovial fluid. Oates et al. [40] have suggested a connection between rheopexy and lubrication properties . In OA (osteoarthritis) , reduction in viscosity is severe and results from a decline in molecular weight and concentration of HA. Synovial fluid is composed of: NaHA which is a anionic polysaccharide, proteins (albumin,ca. 11 mg/mL ; globulins,ca. 7 mg/mL) Oates et al suggest that proteins were incorrectly assumed to bind irreversibly to NaHA forming a NaHA-protein complex [38]. Oates and coworkers conclude that NaHA forming irreversible viscoelastic gels is incorrect. They have observed both BSA and PBS (phosphate buffered saline) to be rheopectic . Aggregation of BSA was seen using SANS (small angle neutron scattering). It was seen that the aggregation was enhanced by NaHA. However, interaction between NaHA and BSA is repulsive according to equilibrium dialysis studies. At low shear rates, rheopexy is observed for BSA, BSA in PBS and model synovial fluid. Oates and coworkers suggest that this rheopexy indicates some structure formation over time. At high shear rates rheopexy is less pronounced .Rheopexy is predicted to be caused by the macromolecules in synovial fluid. Reasons suggested are- NaHA self associations, protein aggregation, protein binding to NaHA or a combination of all of these. BSA10
Texas Tech University, Amol Bhusari, May 2007 NaHA interactions have been ruled out because of negative charge of -15e on BSA and the anionic nature of the polysaccharide NaHA. Proteins are found to attract each other and form aggregates. BSA in PBS is rheopectic, but apparent viscosity at any time shows a shear thinning nature. Oates et al [36] find that this viscoelastic character is consistent with protein aggregation. SANS from solutions of BSA in D2O with PBS show evidence of protein aggregation. It is suggested that BSA aggregates under physiological conditions and other globular proteins may be involved in the aggregates that form synovial fluid. In the suggested structure of synovial fluid, proteins create a tenuous network around NaHA chains. NaHA might repel proteins and encourage their aggregation. By aggregating around the NaHA chains, proteins would “lock up” a structure that has both proteins and HA. Protein aggregation suggests formation of weak solid in BSA solutions in PBS (temporary protein network) .Oates et al. suggest that aggregation might be a general feature of globular protein solutions, NaHA in PBS are normal polymer solutions without any evidence of association and Protein aggregation is responsible for rheopexy. According to them, rheopectic behavior indicates structure formation which could explain joint stiffness after inactivity as well as elastic character. Hence the connection of rheopexy to boundary lubrication needs to be explored taking into consideration protein aggregation.
2.3 Effect of other additives on rheology of HA Synovial fluid present inside the human body performs several functions including wetting of articular surfaces to provide the necessary lubrication, absorbing 11
Texas Tech University, Amol Bhusari, May 2007 impact load, and transporting nourishing substances to the articular cartilage. Casentini, Di Paola and Palma [1] have studied the rheological features of artificial synovial fluid with composition and physical properties similar to physiological fluid[1]. Table1.1 illustrates the chemical composition of a healthy physiological synovial fluid. Renaud, Belgacem, Rinuado [39] have found correlations for viscosity of polysaccharides. Viscosity data for water soluble polysaccharide solutions were collected and processed using different rheological models. Relationships between polymer solution viscosity, molecular weight and solution concentrations were established and checked for their validity. Viscosity, shear rate and solution concentration were correlated using Cross model [40] and Carreau model [41] . An equation relating zeroshear viscosity and concentration of solutions was proposed. An alternative to MarkHouwink equation was found. Mark-Houwink equation is given by:
[η ] = KxMW a
(2.1)
where, η is the intrinsic viscosity, K is a constant, MW is the molecular weight, a is a scalar which depends on the type of polymer molecule The alternate equation derived by Renaud et al. was:
MV0 α = α 2 η s 18 x10 −3 2
A0
0.823± 0.020
(2.2)
where, α is a dimensionless parameter. A0 is ‘hypothetic’ zero shear viscosity at zero concentration 12
Texas Tech University, Amol Bhusari, May 2007
η s is solvent viscosity in Pa.s M is molecular weight in g/mol V0 is specific volume of solute at zero concentration
Normal synovial joint has low coefficient of friction. For bovine synovial fluid, coefficient of friction is 0.002-0.01. For simple saline it is found to be 0.01-0.03 , which is a 300% increase. With 10 mg/mL HA the coefficient of friction is 0.005-0.02. Oates et al. have therefore suggested that other components of synovial fluid play an important role in lubrication. Pisarcik, Bakos and Ceppan [41, 42] have studied systems of HA aqueous solution as against acetylsalicylic acid salt in HA solution. Both systems are found to display pseudoplastic behavior. The viscosity dependence on shear rate for the systems was defined by:
ηαγ −3 / 4
(2.3)
For acetylsalicylic salt in aqueous solution, polymer chains are seen to turn into contracted shapes as a result of suppression of the repulsion in polyelectrolyte chain by addition of salt counterions. Presence of acetylsalicylic acid salt in HA has been seen to cause reduction in viscosity. The reason predicted is electrostatic interactions between salt counterions and polyelectrolyte. Mo, Nishinari et al [43] have discussed the effects on viscosity of Sodium hyaluronate in presence of Sodium Chloride, Guanidine Hydrochloride and sucrose. Viscoelastic measurements were performed. Sodium Chloride and Guanidine Hydrochloride decreased both the storage and loss moduli and sucrose increased both moduli. It is 13
Texas Tech University, Amol Bhusari, May 2007 suggested that sodium ions and guanidium ions shield the electrostatic repulsion of NaHA molecules and hence reduce the coil dimension. In dilute NaHA solutions,sucrose reduces coil dimension andhence decreases zero shear specific viscosity. In concentrated solution, it promotes to form a transient network of NaHA molecules. Sucrose enhances the entanglement coupling between NaHA molecules and promotes creation of hydrogen bonds. Addition of sucrose thus increases the interaction between NaHA monomer units and this results in the increase of storage and loss moduli because of temporary network formation. In another work, Mo and coworkers [44] have studied the effect of addition of Sodium Chloride, sucrose and DMSO (Dimethyl sulfoxide) on extensional viscosity and steady shear viscosity of NaHA. Extensional viscosity decreased on addition of Sodium Chloride. Sodium ions shield the electrostatic repulsion between carboxyl residues of HA molecules and constrict the coil dimensions. Strain thickening of HA solution in presence of Sodium Chloride at higher extensional rates is due to coil stretching. Addition of sucrose increased extensional viscosity. This gives evidence that polymer solvent interaction is promoted by sucrose and there is shrinkage in HA coil dimensions.
2.4 Study of viscoelastic properties of HA A study on the cohesive and rheological properties (viscosity, elastic and viscous moduli-G′, G″;cohesive density index) of HA at different molecular weights ( 0.35 x 10⁶ to 1.8 x 10⁶ Da) has been done by Falcone, Palmeri and Berg [45]. It was found that the cohesive nature of HA was highly dependent on molecular weight and
14
Texas Tech University, Amol Bhusari, May 2007 solution concentration. Data shows that viscosity strongly depends on concentration and molecular weight of the polymer. Fujii et al. [46] have looked at the effect of addition of hyaluronate segments on the viscosity of HA solutions. Shorter NaHA was found to decrease storage (G′) and loss (G″) moduli whereas longer NaHA increased both moduli. Also, addition of N-acetyl glucosamine was found to increase both the moduli whereas addition of sodium glucuronate was found to decrease both the moduli. The changes in moduli were suggested to be because of intermolecular interactions. Ambrosio et al [28] conducted dynamic measurements on samples of different molecular weights of HA by subjecting them to sinusoidal shear strain. They observed that low molecular weight samples showed viscous behavior (G″>G′); whereas high molecular weight samples showed viscous behavior (G″>G′) at low frequency and elastic behavior (G′>G″) at high frequency. The reason cited for this change in behavior was network formation at high molecular weights. The effect of concentration on elasticity of hyaluronan-aggrecan solutions was studied by Nishimura, Kawata et al. [47]. They determined G′ and G″ using a controlled stress rheometer. Elasticity at different concentrations was studied. Aggrecan solution alone showed little elasticity. Addition of Hyaluronan (0.001 to 0.1 mg/ml) markedly increased elasticity, but not viscosity. Elasticity of the hyaluronan-aggregan solution reached a plateau at 500:1 (w/w) ratio. Hyaluronan with 1000kDa molecular weight was found to have less effect on the elasticity of aggregan solution than 3300 kDa hyaluronan.
15
Texas Tech University, Amol Bhusari, May 2007 Hence they concluded that upto 50 % reduction in aggregan concentration or reduced hyaluronan size (< 1000kDa, as compared to physiological levels in young cartilage) can abolish the elastic network of aggrecan-hyaluronan complex.
2.5 Study of thin film properties A study on normal, viscous and shear lubrication forces between smooth mica surfaces in aqueous HA to mimic human knee joint conditions has been done by Tadmor, Chen and Israelachvili [48]. In the study, the role of HA as a protective layer and responses of confined HA solution to sudden changes in stress were investigated using surface forces apparatus. Mean film viscosity against film thickness was plotted. It was found that polymer was being forced out from between the surfaces. This suggests that free HA cannot protect cartilage during an impact. Hence administration of free HA in a defective joint might not help in boundary lubrication. Zhu and Granick [49] have studied the viscoelastic shear response of confined HA as a function of frequency and shear rate. HA was confined to spacings of few nanometers for mimicking the condition of flow of synovial fluid between gaps in cartilage. The experiments were done on a surface forces apparatus. Measurements were performed with and without the drug D-penicillamine. There was enhanced resistance to compression after addition of the drug. In presence of the drug, viscous and elastic forces were larger in magnitude. However, they have not suggested that the drug modifies rheological properties of HA by increasing its viscosity. Both boundary and fluid film lubrication are found to work in human joints. For boundary lubrication, surface properties of intra articular fluid and coupled materials 16
Texas Tech University, Amol Bhusari, May 2007 are important to determine friction and wear of the joint and in the fluid film regime, properties like viscosity and density play an important role. HA is present in synovial joints at a high molecular weight and also in prosthetic joints, at a lower molecular weight. This suggests that joint replacement arthroplasties cause an adaptive tissue response and formation of lining cells able to synthesize and secrete hyaluronate.
2.6 Molecular Dynamics simulations on HA Kaufmann et al. [50] have studied the HA-water interactions through molecular dynamics simulations. They employed the GROMACS [51] force field to HA dimer and trimer subunits surrounded by water molecules (SPC [51A] water model). The analysis included pair distribution functions, diffusion coefficients and reorientation times for water molecules. Self diffusion coefficients of water molecules were found to vary from 1.5 x 10⁻⁹ m2 s-1 to 2.3 x 10⁻⁹ m2 s-1 . The reorientation correlation times for water molecules were estimated to be about 2 ps for a polymer concentration of 7 wt.% HA. Energy and geometry criteria helped them determine the number of hydrogen bonds between water molecules and acceptor atoms of HA to be 10-15 per HA dimer. They have hence proposed that HA has high hydration ability. Integration of pair distribution functions has shown that around 3.2 water molecules have localized within 0.34nm of each hydroxyl group oxygen. The criteria for energy was geometrical: distance between water oxygen atom and hydrogen bond acceptor atom of HA should be less than 0.320 nm. Thus according to experimental studies there are 10-15 hydrogen bonds between HA dimer subunit and water [52]. From differential scanning calorimetry, the number is 5-20
17
Texas Tech University, Amol Bhusari, May 2007 [53]. NMR relaxation measurements suggest 4-9 hydrogen bonds with surrounding water [54]. All these results show high hydration ability of HA. Almond, Sheehan and Brass [55] have done Molecular mechanics simulations of two disaccharides of HA in aqueous solution. Their work was focused on determining the molecular basis for stiffness of HA. Simulations show that stable sets of hydrogen bonds frequently connect neighboring residues of HA. Water caging around glycosidic linkage was observed to increase connectivity between sugars and further constrain them. This is proposed to explain the stiffness of polymeric HA. Molecular Dynamics simulation of heparin-water-sodium systems was carried out by Verli, Guimaraes [56] to study heparin solution conformation under physiological conditions. The conformational behavior of the glycosidic linkage was studied and was found to be in line with NMR data. Molecular modeling of heparin interactions with its binding proteins is suggested as a tool for development of new antithrombotic agents. In another work [57], the same group has worked on Molecular dynamics and atom charge calculations in the study of heparin conformation in aqueous solution. They did an evaluation of different atomic charge basis sets in heparin MD simulations. Lowdin, Mulliken and Electrostatic potential (ESP) charges were derived. Mulliken analysis was found to have a tendency to place all charge on the oxygen atom. Hence Lowdin population analysis was tried. It was found that ESP and Lowdin charges gave better results in heparin simulations, followed by Mulliken charges. Haxaire, Braccini, Milas et al. [58] have examined the structural basis of ordered hyaluronan structures and their interactions with counterions using molecular modeling techniques. It was found that HA polysaccharide can assume a wide range of 18
Texas Tech University, Amol Bhusari, May 2007 energetically stable helices ranging from left handed 4 fold symmetry to right handed 5 fold symmetry. Left handed models are lower in energy than the right handed models. In the presence of Sodium, the conformation of the chain is that of a two-fold helix. Structure and dynamics of oligosccharides using various approaches has been reviewed by Imberty and Perez [59]. Low energy conformers of a disaccharide can be estimated using molecular mechanics. The global shape depends upon rotations about glycosidic linkages. Various force fields including GROMOS [60], AMBER[27], GLYCAM[61] have been modified and are appropriate for carbohydrates. MD simulations of disaccharides of hyaluronan performed in water demonstrate the use of ‘water bridges’at both linkages. Intramolecular hydrogen bonds and ‘water bridged’ hydrogen bonds together play an important role in the conformational behavior of oligosaccharides. Some molecular dynamics studies have also shown unusual high density of water around hyaluronan fragments. There are around 10 to 15 hydrogen bonds between a disaccharide and the surrounding water. Scott and Healey [62] have mentioned that up to five Hydrogen bonds per tetrasaccharide unit of HA have been found in NMR studies[63,64] of water in dimethyl sulfoxide solutions and x-ray diffraction data [21]. A tape-like two-fold helix is proposed for HA structure. They have also observed self-aggregation of HA in strands of honeycomb meshwork in aqueous solutions. [62]
2.7 Studies on samples from arthritic patients Mazzucco et al [31] have investigated rheological parameters in Total Knee Arthroplasty (TKA) patients. The flow properties studied were steady shear viscosity 19
Texas Tech University, Amol Bhusari, May 2007 and storage and loss moduli. These properties were also evaluated for commercially available sodium hyaluronate preparations. The general behavior of joint fluid samples was shear thinning. The characteristic shape of the viscosity versus shear rate curves was same. A plateau was observed at low shear rates. However, the steady shear viscosity was found to vary over three orders of magnitude for patients undergoing TKA. Oscillatory shear measurements were done on a CSL500 rheometer. At low frequencies, loss modulus was found to dominate over shear modulus and both moduli increased at higher frequencies. Crossover frequencies could be measured for some samples. The authors observed that crossover frequency increased in arthroplasty fluids in comparison to normal synovial fluid. Also, storage and loss moduli were found to decrease in patients undergoing arthroplasty. An important limitation of the study mentioned was the gap employed in the rheometer which was 300 µm. Literature suggests that the minimum gap on a loaded knee is about 0.1 µm. The authors also found that viscosity of the synovial fluid varied substantially between the right and left knee samples. In a 2003 review by Grace et al. [65] the efficacy of intra articular injections of Hyaluronic acid was shown to be moderate in comparison to intra articular placebo. The authors did a meta analysis of different studies on the intra articular HA efficacy. They support the hypothesis that majority of the effect of intra articular HA is an intra articular placebo effect. 80% of the effect of injections was credited to the placebo effect. Grecomoro et al. [66] have also studied the rheological changes in synovial fluid of patients due to intraarticular infiltration of HA. In their study, three treatment methods were administered to the patients. One group of patients was treated with intra articular infiltration of Sodium Hyaluronate, the second group was given oral anti-inflammatory 20
Texas Tech University, Amol Bhusari, May 2007 agents, and the third group was treated with fluid aspiration to relieve pain. The results indicated that for group one and two, the viscosities were found to increase by a mean of 110 cP. For other groups, average viscosity values of 15 cP were recorded. Thus intraarticular hyaluronic acid was found to temporarily increase viscosity of synovial fluid in patients. Elsaid et al. [67] have conducted friction experiments to determine boundary lubricating ability in a rabbit knee. Their results showed decrease in lubricin concentration over a period of three weeks. This indicates the role of lubricin in boundary lubrication, which is independent of fluid viscosity. Brandt and coworkers [68] have studied changes in frictional coefficient on porcine joints due to application of Hyaluronic acid. The coefficient of friction was found to decrease by 50 to 75 %. However, the coefficient of friction was not found to recover to the level of intact joints.
2.8 Proposed work The work of Colby and coworkers [37] focusses on protein-protein interaction. They suggest that the rheopexy observed in synovial fluid is due to some structure building. From their earlier (2001) study they negate self association for Sodium hyaluronate and on the basis of their results in 2002 [69], they suggest NaHA-protein repulsion. Hence they conclude that protein-protein aggregation contributes to rheopexy and, in turn, lubricating properties of synovial fluid. Their hypothesis (2006) [40] of globular proteins forming a tenuous network and NaHA chains entangling with this network has problems because of negative charge on both NaHA and proteins. This is in 21
Texas Tech University, Amol Bhusari, May 2007 contrast with their earlier hypothesis (2002) which advocated HA-protein repulsion. Their sample synovial fluid model ( HA + albumin + γ-globulin ) , however, does not contain lubricin, which, according to Swann and coworkers (1985) and Jay and coworkers, is important for lubrication. Swann and coworkers [70] have studied lubrication in synovial fluid on account of lubricin in 1985. Jay and coworkers (1992) have hypothesized that some glycoproteins, and not hyaluronate, are responsible for boundary lubrication. They claimed that digestion of synovial fluid with testicular hyaluronidase did not change its viscosity and it was the protein which was the lubricating factor. They identified this protein to be lubricin. Their study, however, neglects other protein components of synovial fluid such as albumin, γ-globulin. The study of Gribbon et al. (2000) [71] suggests that there is no chain-chain association in hyaluronan solutions. Gribbon and coworkers have also studied the effect of counterions, urea, electrolytes on HA network properties. Though the studies on synovial fluid and its lubricating ability started around 1950s, the exact cause of the lubricating ability of hyaluronic acid is still not clear. The studies listed above have focussed on different components of the synovial fluid for explaining its lubricating ability, but none is complete yet. Whether it is hyaluronic acid by itself or proteins or other components, or the interaction between these components which is responsible for the lubrication property of synovial fluid still needs to be found out. Intraarticular Hyaluronic acid is currently used on patients suffering from osteoarthritis. Miltner et al. [72] have commented on the efficacy of intraarticular hyaluronic acid in patients with
22
Texas Tech University, Amol Bhusari, May 2007 osteoarthritis. If the cause of lubrication in synovial fluid can be found out, it can help significantly in the treatment of arthritis. Molecular Dynamics could help in investigating the cause of lubrication. The only Molecular Dynamics studies done till date on Hyaluronic acid are by Kaufmann and coworkers [50]; Almond and coworkers [55]. Kaufmann’s group has worked on Molecular Dynamics simulations of Hyaluronic acid in water. They have observed the high hydration ability of Hyaluronic acid. Almond and coworkers have studied conformation of Hyaluronan from Molecular Dynamics simulations. Molecular dynamics can help studying the intermolecular interactions between various components of the synovial fluid and also help studying properties such as diffusion coefficient, viscosity which can help us understand the mechanism of lubrication. We plan to undertake Molecular Dynamics studies of Hyaluronic acid and synovial fluid models consisting of different components like albumin. With the TA instruments’ AR-2000 rheometer, we plan to undertake rheological studies on HA and synovial fluid model. These would be parallel to our Molecular dynamics studies and would include effect of various parameters on the viscosity, effect on the viscosity due to addition of various synovial fluid components, changes in viscosity for saline buffers of various concentration, resulting change in viscosity due to shear history. We are also interested in measuring viscoelastic properties, i.e. G′ (storage modulus) and G″ (loss modulus) which would help understanding the viscoelastic behavior of synovial fluid and HA in a better way.
23
Texas Tech University, Amol Bhusari, May 2007 Experimental observations would then be compared with Molecular Dynamics studies to give reasons for various observations. Earlier hypotheses from different studies listed above could then be possibly explained.
24
Texas Tech University, Amol Bhusari, May 2007 CHAPTER 3 MOLECULAR DYNAMICS SIMULATIONS 3.1 Introduction to Molecular Dynamics simulations Molecular Dynamics involves solution of classical equations of motion for a system of molecules which interact with each other. Every atom of the system is treated as a point mass and is represented by co-ordinates. For a system of N atoms, the equation of motion is: mi
d 2 ri = Fi , i = 1...N dt 2
(3.1)
where,
If the potential function is represented by V (r1 , r2 ,..., rn ) ; forces can be expressed as: Fi = −
∂V ∂ri
(3.2)
These equations are numerically integrated in time. The general MD algorithm consists of: 1. Positions, velocities and Potential interactions given as input 2. Computation of forces on atoms 3. Calculation of potential and kinetic energies 4. Solving Newton’s equations of motion to obtain the co-ordinates, forces and velocities at each time step.
25
Texas Tech University, Amol Bhusari, May 2007 The system in consideration is enclosed in a box with desired density. If we know the positions of atoms and their velocities at a time ‘t’, we can obtain the values of all these variables at time ‘t+dt’. Different algorithms have been proposed towards this step-by-step approach to obtain trajectories of atoms. The Verlet algorithm is used in the simulations carried out here. This algorithm is based on positions r(t), accelerations a(t), and the positions r( t − δ t ) from the previous step. The equation is given by: r (t + δ t ) = 2r (t ) − r (t − δ t ) + δ t 2 a (t )
(3.3)
Empirical potential functions are used to describe the interactions between atoms. These include the bonded and non-bonded interactions. Bonded interactions include bond stretching, bond angles, improper dihedrals and proper dihedrals. Nonbonded interactions are described by weak van der Waals (Lennard-Jones) or electrostatic (Coulombic) potentials. The set of parameters in the potential energy functions is known as force field. In this work, the AMBER FF03 force field was employed for simulations. This force field was developed by Duan et al. [73] and was called the “third generation point charge all-atom force field for proteins”. The potential function for interactions described in this force field is: Etotal =
∑K bonds
b
(b − beq ) 2 +
∑ K θ (θ − θ angle
eq
)2 +
Aij Bij q i q j Vn [1 + cos(nφ − γ )] + ∑ 12 − 6 + Rij εRij dihedrals 2 i< j Rij
∑
(3.4)
where, 26
Texas Tech University, Amol Bhusari, May 2007 K b and K θ are force constants for bond and bond angles, b and θ are bond length and bond angle,
beq and θ eq are equilibrium bond length and bond angle,
φ is the dihedral angle and Vn is the corresponding force constant, γ is the phase angle and takes values of 0° or 180° The nonbonded part of the potential is represented by van der Waals ( Aij ) and London dispersion terms ( Bij ) and interactions between the partial atomic charges ( q i and q j ). The dielectric constant is represented by ε , and is equal to 1 in a system where the solvent is represented explicitly. Nonbonded terms are calculated for all atom pairs that are separated by more than 3 bonds or are not bonded. Periodic boundary conditions are employed to minimize edge effects in a finite system. This implies that atoms are inside a box which is surrounded by translated copies of itself. In addition, minimum image convention is used. This states that the nearest image of each particle is considered for short-range non-bonded interactions. For long range electrostatics, methods like Particle Mesh Ewald [74] are used. Calculation of Kinetic energy is done by using the following equations: For a system of N particles, at a temperature T,
K .E . =
1 N mi vi2 ∑ 2 i −1
(3.5)
The system is coupled to an external ‘heat bath’ for controlling temperature and similarly, to a ‘pressure bath’ for controlling pressure.
27
Texas Tech University, Amol Bhusari, May 2007 In this work, all of the MD simulations are carried out using the GROMACS [75] package. The calculations were run on a linux cluster. GROMACS [51] (GROningen Machine for Chemical Simulation) is a Gnu public license free Molecular Dynamics package developed at the University of Groningen, Netherlands. It comes with different tools for analysis of the simulation results. A system is defined by size, shape, number and types of molecules, and coordinates and velocities of atoms. The input files required by the program are listed below. Sample files from simulations are included in the appendix. 1. pdb file: This file contains information about the co-ordinates of atoms in a molecular structure and the format is as approved by the Brookhaven protein data bank. 2. top file: This is the topology file which contains information about the bonds, angles, dihedrals, charges and other parameters for atoms of the system in consideration. It is in the ASCII format. 3. mdp file: This file contains all parameters (eg. time step) for the molecular dynamics program. 4. gro file: This file, which is an alternative to the pdb file, has information about the atomic positions and initial velocities, if any. This file follows a format defined by Gromacs. The title line is followed by the total number of atoms. Subsequent lines contain information about the residue name, atom name, atom number, co-ordinates in nm, velocities if any. The last line of this file specifies the box dimensions in nm. 5. tpr file: This is the run input file created by Gromacs as per the input parameters and initial configuration. This single file contains all the information from the gro, top and mdp files and the tpr file is the only file required by Gromacs’ mdrun program. 28
Texas Tech University, Amol Bhusari, May 2007 The topology file mentions the force field used for calculation of intermolecular interactions. GROMACS is compatible with certain types of force fields only. The first step in a MD simulation consists of building molecular models of the system of interest.
3.2 Generation of polymer for simulations XLEAP, a utility in AMBER [27] (Assisted Model Building with Energy Refinement) molecular dynamics package was used for generation of monomer units of Hyaluronic acid. These monomer units were relaxed and the atomtypes were defined according to AMBER ff03 force field definitions. During relaxation, XLEAP compares bond lengths, bond angles, torsional angles to the defaults in the force field file and gives the best possible configuration for a structure drawn by the user. Using ANTECHAMBER, another utility in AMBER, charges were assigned to all atoms. The charge method used was AM1 BCC [76]. Further to this step, three units of hyaluronic acid were edited such that they would make the head, center and tail which would join together to form a polymer. These units were “sequenced” together to form a polymer of desired length. The polymer unit was checked for connections and charges. Charges were compared with the OPLS-AA [75] force field results for carbohydrates. The charges assigned by AMBER were in agreement with the OPLS-AA force field for carbohydrates. The co-ordinate and topology files were written in AMBER. These files were converted to GROMACS format using ambconv [86] (ambconv is a free contributed software developed by Filip Ryjacek. It converts AMBER topology and coordinate files to GROMACS format). The above method was used to generate a decamer of hyaluronic 29
Texas Tech University, Amol Bhusari, May 2007 acid which was used in the HA decamer-water simulation. HA monomers were used in HA-protein-water simulation. A comparison of charges calculated by AMBER with the OPLS-AA charges for a monosaccharide is shown in Table 3.1
Fig.3.1 Representation of a monosaccharide with atom labels. Atom names assigned as per AMBER FF03 defaults
30
Texas Tech University, Amol Bhusari, May 2007 Table 3.1 Comparison of charges assigned as per OPLS-AA and AMBER FF03 force fields. Some charges are not available from OPLS-AA defaults
Atom name
OPLS-AA charge
O3 O8 C6 H29 C5 O8 H36 C4 H26 C1 C2 H27 C37 H40,41
-0.4 -0.7 0.365 0.1
0.17 0.03 0.145 0.06
O38 H39
-0.683 0.418
-0.7 0.435 0.205 0.06
AMBER (FF03) charge
-0.4314 -0.4097 0.3065 0.0762 NA 0.1346 -0.4097 0.4149 0.1075 0.0651 NA 0.1014 0.0655 0.0779 0.1429 0.0470, 0.0732 -0.5997 0.4142
3.2.1 Analysis of simulations The co-ordinates, velocities, forces are recorded in the “xtc” file created by GROMACS during the MD run. The “edr” file has data from all calculations. These include Pressures, Densities, Temperatures, Energies recorded at regular time intervals. All this data is in binary format and XMGRACE [78] was used to generate the plots. The Hydrogen bond and Radial distribution function calculations were done using GROMACS analysis tools. 31
Texas Tech University, Amol Bhusari, May 2007
Fig.3.2 Geometrical Hydrogen bond criterion (D : Donor ; A: Acceptor) The geometrical criterion used for Hydrogen bonds was : 1. r ≤ 0.35 nm 2. α ≤ 30 ° For calculating Radial distribution function, particles, and not center of mass was considered.
g AB (r ) =
ρ B (r ) 1 1 = ρ B local ρ B local N A
δ (rij − r ) 4π r 2 i∈A i∈B NA NB
∑∑
(3.6)
where, g is the radial distribution function. The numerator represents particle density of B at a distance ‘r’ around A. The denominator represents particle density of B averaged over all spheres around particle A with radius rmax . The value of rmax is half the box length. In this work, a bin width of 0.002nm was used for calculation of the radial distribution function.
32
Texas Tech University, Amol Bhusari, May 2007
3.3 HA decamer-water simulation Most of the molecular dynamics studies on HA have been carried out using HA monomers or trimers in the system. In this work, a MD simulation of a HA decamer in water was carried out to look at the HA-water interactions. Hydrogen bond formation would be an important aspect to look at and could be compared to another system where protein is present in addition to HA and water. This system consisted of one HA decamer solvated with 7891 SPC [51A] (Simple Point Charge) model water molecules in a cubic box of length 6.10629 nm. (The SPC water model has three centers of concentrated charge). The initial system of one HA decamer was solvated with water molecules and then a combination of energy minimization using the steepest descent method and manual box scaling was used to approach the desired density of about 1g/cc. The conjugate gradient method was used for energy minimization. The energy minimized system had a potential energy of -1.62 x 10⁵ kJ/mol. Following this, a 2 ns NPT MD run was done on the system using GROMACS. The time step used was 1 fs. Berendsen [51B] temperature coupling was used to maintain a temperature of 298K and Parrinello-Rahman [51 C,D,E] pressure coupling was used to couple the system to a pressure of 1 bar. The 2 ns MD run was followed by a longer 5.7 ns run with same parameters. Here, co-ordinates, velocities, forces and energies were recorded every 100000 steps. The system equilibrated after about 1 ns. The analysis was done starting from this step to the end of the simulation (5.7 ns)
33
Texas Tech University, Amol Bhusari, May 2007
3.3.1 Analysis of HA decamer-water simulation Analysis was performed using data recorded during the simulation. The plots are shown below.
Fig.3.3 Plot of Density Vs time for the 5.7 ns HA decamer-water NPT mdrun at 1 bar and 298 K. Average Density = 1041.28 kg/m3 ; RMSD = 3.05 From Fig3.3 it can be seen that the density stabilized at about 1 ns and very little fluctuations were recorded after that time step. 34
Texas Tech University, Amol Bhusari, May 2007
Fig.3.4 Plot of Pressure Vs time for the 5.7 ns HA decamer-water NPT mdrun at 1 bar and 298 K. Average Pressure = 1.05 bar ; RMSD = 541.08 Initially Berendsen [51B] pressure coupling was employed. However, it was found to give very high fluctuations in pressure. The Parrinello Rahman [51 C,D,E] pressure coupling with a coupling constant ( τ P )of 1gave better results. The fluctuations reduced and an average pressure close to the set pressure of 1 bar was achieved. 35
Texas Tech University, Amol Bhusari, May 2007
Fig.3.5 Plot of Temperature Vs time for the 5.7 ns HA decamer-water NPT mdrun at 1 bar and 298 K. Average Temperature = 298.01K ; RMSD = 1.06 The Berendsen [51B] temperature coupling was used with a coupling constant ( τ T )of 0.1. The temperature settled after about 1 ns and there were very little fluctuations after this time step.
36
Texas Tech University, Amol Bhusari, May 2007
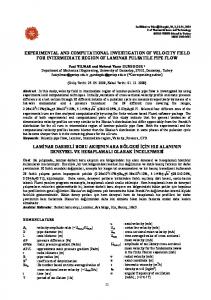
Fig.3.6 Plot of Total Energy Vs time for the 5.7 ns HA decamer-water NPT mdrun at 1 bar and 298 K. Average total energy = -238520 kJ/mol ; RMSD = 612.46
The total energy of the system which is addition of the kinetic and the potential energies, equilibrated at about 1ns and not very high fluctuations were recorded after that time step.
37
Texas Tech University, Amol Bhusari, May 2007
Fig.3.7 Number of Hydrogen bonds between HA decamer and water for the 5.7 ns HA decamer-water NPT mdrun at 1 bar and 298 K. Average number of bonds per time frame was 102.23 The number of Oxygen atoms in a HA monomer available for formation of Hydrogen bonds is 10. Hence, for a decamer of HA, 102.23 hydrogen bonds per time frame is a comparable number.
38
Texas Tech University, Amol Bhusari, May 2007
Fig.3.8 Plot of radial distribution function ( HA decamer-water) for the 5.7 ns HA decamer-water NPT mdrun at 1 bar and 298 K.
39
Texas Tech University, Amol Bhusari, May 2007
Fig.3.9.1 Plot of radial distribution function ( O7 of first monomer and O7 of last monomer during 1-2 ns) for the 5.7 ns HA decamer-water NPT mdrun at 1 bar and 298 K
40
Texas Tech University, Amol Bhusari, May 2007
Fig.3.9.2 Plot of radial distribution function ( O7 of first monomer and O7 of last monomer during 5-5.7ns) for the 5.7 ns HA decamer-water NPT mdrun at 1 bar and 298 K
41
Texas Tech University, Amol Bhusari, May 2007
Fig.3.9.3 Plot of radial distribution function (C6 of first monomer and C6 of last monomer during 1-2 ns) for the 5.7 ns HA decamer-water NPT mdrun at 1 bar and 298 K
42
Texas Tech University, Amol Bhusari, May 2007
Fig.3.9.4 Plot of radial distribution function (C6 of first monomer and C6 of last monomer during 5-5.7 ns) for the 5.7 ns HA decamer-water NPT mdrun at 1 bar and 298 K
The radial distribution functions shown above indicate that the HA atoms are closer to each other than to water atoms, and might be forming a cluster. Visualizations shown further in this work (Fig.3.20,21) show that the HA decamer actually coils after 5.7 ns of MD run.
43
Texas Tech University, Amol Bhusari, May 2007
3.4 HA-protein-water simulation .
To study the interaction between HA and protein, a MD simulation of a system of
HA, serum albumin and water was carried out. The objective was to look at Hydrogen bond formation between HA-protein and HA-water and look at the interactions, if any, between HA and proteins. The system consisted of 10 HA monomers solvated with 1000 SPC [51A] model water molecules and a Human Serum Albumin (HSA) molecule in a cubic box of length 4.85 nm. The HSA molecule was obtained from RCSB protein data bank (pdb code 1a06) and was modified to remove one duplicate chain. The system was energy minimized using steepest descent method. The energy minimized system had a potential energy of -1.05 x 10⁶ kJ/mol. Initially a 2 ns NPT MD run was done on the system using GROMACS. The time step used was 1 fs. Berendsen [51B] temperature and pressure couplings were used. The system was coupled to a temperature of 298K and a pressure of 1 bar. This was followed by a longer 20 ns MD run with the same parameters. Here, co-ordinates, velocities, forces and energies were recorded every 100000 steps. The system equilibrated after about 2 ns. Analysis was performed starting from this step to 20 ns.
44
Texas Tech University, Amol Bhusari, May 2007
3.4.1 Analysis of HA-protein-water simulation Analysis was performed using the data recorded during the simulation. The different plots obtained are shown below.
Fig.3.10 Plot of density Vs time for the 20 ns HA monomers-protein-water NPT mdrun at 1 bar and 298 K. Average Density = 1291.15 kg/m3 ; RMSD = 2.34 From Fig.3.10 it can be seen that the density stabilized at about 2 ns and very little fluctuations were recorded after that time step. The high value of density can be attributed to the presence of proteins in the system, in addition to HA and water. 45
Texas Tech University, Amol Bhusari, May 2007
Fig.3.11 Plot of pressure Vs time for the 20 ns HA monomers-protein-water NPT mdrun at 1 bar and 298 K. Average pressure = 1.003 bar ; RMSD = 473.33 Berendsen [51B] pressure coupling with a coupling constant ( τ P ) of 1 gave little fluctuations in the pressure.
46
Texas Tech University, Amol Bhusari, May 2007
Fig.3.12 Plot of temperature Vs time for the 20 ns HA monomers-protein-water NPT mdrun at 1 bar and 298 K. Average temperature = 1.00 bar ; RMSD = 473.33 Berendsen [51B] temperature coupling with a coupling constant ( τ T ) of 1 was used. The temperature settled after initial few hundred ps and very little fluctuations were recorded.
47
Texas Tech University, Amol Bhusari, May 2007
Fig.3.13 Plot of Total Energy Vs time for the 20 ns HA monomers-protein-water NPT mdrun at 1 bar and 298 K. Average total energy = 298.02 K ; RMSD = 1.78 Total Energy, which is a sum of the kinetic and potential energy, equilibrated at about 2 ns and very little fluctuations were recorded.
48
Texas Tech University, Amol Bhusari, May 2007
Fig.3.14 Number of Hydrogen bonds between all HA monomers-water Vs time for the 20 ns HA monomers-protein-water NPT mdrun at 1 bar and 298 K. Average number of bonds per frame is 76.36
49
Texas Tech University, Amol Bhusari, May 2007
Fig.3.15 Number of Hydrogen bonds between all HA monomers-protein Vs time for the 20 ns HA monomers-protein-water NPT mdrun at 1 bar and 298 K. Average number of bonds per frame is 17.18 The number of Hydrogen bonds per frame was found to decrease in the HA monomersprotein-water system compared to the HA decamer-water system. This could be because of Hydrogen bond formation between HA and protein.
50
Texas Tech University, Amol Bhusari, May 2007
Fig.3.16 Radial distribution function (HA monomer-water) for the 20 ns HA monomersprotein-water NPT mdrun at 1 bar and 298 K Radial distribution function for HA monomer-water (Fig.3.16) when compared to that of HA monomer-protein (Fig.3.17) shows that HA monomer atoms are closer to protein atoms than water molecules.
51
Texas Tech University, Amol Bhusari, May 2007
Fig.3.17 Radial distribution function (HA monomer-protein) for the 20 ns HA monomers-protein-water NPT mdrun at 1 bar and 298 K
3.4.2 HA monomer-protein interactions A code was written in FORTRAN77 to find the closest distance between any HA atom and protein, as well as the pairs of HA and protein atoms within a distance of 3 A. This code used co-ordinates from the output “gro” (structure) file of the mdrun. The closest distance between any HA and protein atom was found to be 1.6143 A. The atoms close to each other were found to be an Oxygen attached to a Carbon of a HA monomer a Hydrogen from the water. 25 pairs of atoms of HA and protein were found to be within a distance of 3A close to each other. Close atom pairs were found to have one Oxygen and 52
Texas Tech University, Amol Bhusari, May 2007 hence, this proximity could be attributed to Hydrogen bonds formed between HA-water and HA-protein. Knowledge of HA binding sites on the protein can help in further exploring the HA-protein interaction.
3.5 HA trimers-water MD run To study the interaction of HA trimers with water, a 5 ns NPT MD run was carried out. The system consisted of 12 HA trimers solvated in 6517 SPC [51A] water molecules in a cubic box of 6 nm. HA trimers were created using PRODRG [26]. The density of the system was close to 1000 kg/m3. The system was energy minimized using steepest descent method to a potential energy of -3.23 x 10⁵ kJ/mol. For the 5 ns MD run, Berendsen [51B] temperature and pressure couplings were used to couple the system to a temperature of 300K and a pressure of 1 bar. The time step used for the simulation was 2 fs. Co-ordinates, velocities, forces and energies were written out every 1000 steps out of the total 2500000. The system equilibrated after about 1 ns and analysis was performed starting the 1 ns time step.
53
Texas Tech University, Amol Bhusari, May 2007
3.5.1 Analysis of HA trimers-water run
Fig.3.17.1 Plot of density Vs time for the 5 ns HA trimers-water NPT mdrun at 1 bar and 300 K. Average Density = 1002.62 kg/m3 ; RMSD = 2.03
54
Texas Tech University, Amol Bhusari, May 2007
Fig.3.17.2 Plot of pressure Vs time for the 5 ns HA trimers-water NPT mdrun at 1 bar and 300 K. Average pressure = 0.965 bar ; RMSD = 144.39 Berendsen [51B] pressure coupling with a coupling constant ( τ P ) of 0.5 gave little fluctuations in the pressure.
55
Texas Tech University, Amol Bhusari, May 2007
Fig.3.17.3 Plot of temperature Vs time for the 5 ns HA trimers-water NPT mdrun at 1 bar and 300 K. Average temperature = 297.94 K ; RMSD = 1.62 Berendsen [51B] temperature coupling with a coupling constant ( τ T ) of 0.5 was used.
56
Texas Tech University, Amol Bhusari, May 2007
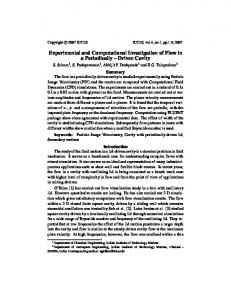
Fig.3.17.4 Plot of Total Energy Vs time for the 5 ns HA trimers-water NPT mdrun at 1 bar and 300 K. Average total energy = -219763 kJ/mol ; RMSD = 323.99 Total Energy, which is a sum of the kinetic and potential energy, equilibrated at about 1 ns and very little fluctuations were recorded.
57
Texas Tech University, Amol Bhusari, May 2007
Fig.3.17.5 Radial distribution function (O6 of first trimer and O6 of second trimer) during 1-2 ns for the 5 ns HA trimers-water NPT mdrun at 1 bar and 300 K
58
Texas Tech University, Amol Bhusari, May 2007
Fig.3.17.6 Radial distribution function (O6 of first trimer and O6 of second trimer) during 4-5 ns for the 5 ns HA trimers-water NPT mdrun at 1 bar and 300 K
59
Texas Tech University, Amol Bhusari, May 2007
Fig.3.17.7 Radial distribution function (C6 of first trimer and C6 of second trimer) during 1-2 ns for the 5 ns HA trimers-water NPT mdrun at 1 bar and 300 K
60
Texas Tech University, Amol Bhusari, May 2007
Fig.3.17.8 Radial distribution function (C6 of first trimer and C6 of second trimer) during 4-5 ns for the 5 ns HA trimers-water NPT mdrun at 1 bar and 300 K
Radial distribution functions plotted above show that the O6 and C6 atomos of the first and second trimer come closer to each other after 5 ns of MD run as compared to their initial positions. Fig.3.22 which follows, shows that HA trimers aggregate after 5 ns of MD run.
61
Texas Tech University, Amol Bhusari, May 2007
3.6 Vizualizations All visualizations were generated in VMD [27A] from the output “gro” (structure) files of the simulation
Fig.3.18 HA monomers in proximity with Protein atoms (20 ns HA-protein-water MD run ; water molecules deleted for better visualization) Red, Blue: Protein atoms Cyan, Red: HA atoms
62
Texas Tech University, Amol Bhusari, May 2007
Fig.3.19 HA – protein and water after a 20 ns MD run Red: HA monomers Cyan: Protein Red dots: water atoms
63
Texas Tech University, Amol Bhusari, May 2007
Fig.3.20 HA decamer generated in XLEAP.
64
Texas Tech University, Amol Bhusari, May 2007
Fig.3.21 HA decamer coiled around itself after 5.7 ns of MD run (water molecules deleted for better visualization)
65
Texas Tech University, Amol Bhusari, May 2007
Fig.3.22 HA trimers aggregated after 5 ns of HA trimers-water run (water molecules deleted for better visualization)
66
Texas Tech University, Amol Bhusari, May 2007
CHAPTER 4 RHEOLOGICAL MEASUREMENTS
4.1 Rheometry Rheometers are used to study the deformation and flow of matter. In a rotational rheometer (Fig.4.1) the sample is sheared between two plates or in a cone and plate geometry. Viscosity is calculated as a ratio of the applied stress and the applied deformation rate.
Fig.4.1 Schematic of a rotational rheometer [79]
Rheometers can be of the controlled stress type or the controlled rate type. In a controlled stress instrument, stress can be varied as desired, which allows the user to measure the viscoelastic response of the material directly. Real life situations can be simulated more accurately using the controlled stress procedure.
67
Texas Tech University, Amol Bhusari, May 2007 The TA instruments’ AR2000 rheometer is a controlled stress/controlled rate rheometer. It is an air bearing rheometer. The use of air as lubricating medium allows application of torque with very less friction. The auto zero gap setting on the instrument sets a reproducible zero gap before actual measurement. Once the sample is loaded on the plate, the gap is closed automatically using this zero gap as the reference. The ‘smart swap’ technology allows the instrument to change calibration parameters by sensing the type of temperature control device attached. The Peltier effect [80] is used in temperature control. This allows fast and precise control. The Peltier effect is a reversible thermoelectric effect where magnitude and direction of current applied to Peltier elements can result in desired heating or cooling. The AR 2000 rheometer uses four Peltier elements which are surrounded by a heat exchanger through which water or cooling fluid can be circulated for removal of heat from Peltier plates. The measuring systems used on the rheometer include the following geometries: 1. Cone and plate 2. parallel plate 3. concentric cylinder 4. double gap concentric cylinder The materials of construction used in the geometries are aluminium or stainless steel. Cone and plate geometry is used for homogeneous single phase substances. The parallel plate allows measurement of samples with particulate matter. A larger diameter geometry is suitable for measurement of low viscosity samples due to its sensitivity to stress changes.
68
Texas Tech University, Amol Bhusari, May 2007
4.2 Viscoelasticity and dynamic shear Water is an example of a viscous material. Some materials show partly viscous and partly elastic behavior. These are called ‘viscoelastic’ materials. When the material is subjected to sinusoidal stress or strain and the response is measured, it is called oscillatory shear measurement. Materials are generally tested in the ‘linear viscoelastic region’. Here, the material’s response to sinusoidal input is sinusoidal with the same frequency. The phase shift between the input and output and their amplitude determines the behavior of the material. There is a phase shift ‘δ’ between the strain and stress. For an elastic material, phase shift would be zero. For a viscoelastic material, stress and strain are out of phase and hence phase shift for the strain is between 0 ° and 90 °. For an equally viscous and elastic material, phase shift would be 45 °. Elastic or storage modulus is defined as the ratio of the in-phase stress to strain. The storage modulus (G′) represents energy stored in elastic structure of the sample. If it is higher than the loss modulus (G″), the material can be regarded as solid like. Loss modulus (G″) represents viscous part or amount of energy dissipated in the sample. If G″ is greater than G′, the material is more liquid like. For an oscillatory shear flow, the shear stress (τyx) oscillates with a frequency ω and is •
out of phase with the applied shear rate ( γ yx ) . The data from the oscillatory shear measurement can be represented in terms of real and imaginary parts of the complex viscosity η* , where
η* = η’ - i η”
(4.1) 69
Texas Tech University, Amol Bhusari, May 2007 The real part η’ is the dynamic viscosity, which is the viscous contribution and accounts for the energy dissipation. The imaginary part η” is the elastic contribution which accounts for the energy storage. In similar fashion, Complex modulus (G*) is defined as
G * = G ′ + iG ′′ = iωη
(4.2)
Here G ′ = ωη " is called the storage modulus and
G ′′ = ωη ' is called the loss modulus
δ = G" / G ' is called as the loss tangent The sinusoidally varying shear stress can be written as:
τ yx = Re{τ yx0 e iωt }
(4.3)
0 where τ yx is complex, and Re represents real part of the complex quantity
If a material is subjected to sinusoidal shear strain,
γ = γ 0 sin(ω t )
(4.4)
where,
γ 0 is shear strain amplitude,
ω is the frequency of oscillation then, the response of the material, expressed as shear stress τ can be written as:
τ = G ' (ω )γ 0 sin(ω t ) + G" (ω )γ 0 cos(ω t )
(4.5)
G′ represents the elasticity or energy stored in the material during deformation, and G″ is representative of the viscous nature of the material or energy dissipated. With a change in frequency of oscillation, material changes its behavior from liquid like (G″ > G′) to solid like (G′ > G″). Crossover frequency marks this change in behavior of the material
70
Texas Tech University, Amol Bhusari, May 2007 and hence it is an important parameter in characterizing the viscoelastic behavior of a material. At the crossover frequency, the values of storage and loss modulus are equal to each other.
4.3 Sample preparation Sodium Hyaluronate (NaHA, molecular weight 1.4 MDa ) was procured from Genzyme Pharmaceuticals (lot # 05NP299A/B). All solutions were prepared in Phosphate Buffered Saline whose pH was adjusted to 7.4. PBS, Bovine Serum Albumin (BSA) and Bovine γ-Globulin were obtained from Sigma Aldrich. Distilled water was used for preparing the PBS solution. NaHA received in powdered form was stored at -25 °C and all prepared solutions were stored at 4 °C. The different solutions prepared were: 1. 10 mg/mL NaHA in PBS (pH 7.4) 2. 10 mg/mL NaHA + 12 mg/mL BSA in PBS (pH 7.4) 3. 10 mg/mL NaHA + 0.24 mg/mL γ-Globulin in PBS (pH 7.4) 4. 10 mg/mL NaHA + 12 mg/mL BSA + 0.24 mg/mL γ-Globulin in PBS (pH 7.4) The physiological concentration of Hyaluronic acid in synovial fluid is about 3 mg/mL [18]. However, rheological measurements on solutions with a concentration of 3 mg/mL NaHA cannot record the crossover point because of limitations on the rheometer. Hence a concentration of 10 mg/mL was chosen, where crossover points for various solutions could be clearly obtained and compared. This concentration of 10 mg/mL was also used by Gatej et al [30] for studying the viscoelastic properties of HA solutions at 71
Texas Tech University, Amol Bhusari, May 2007 different pH values. The physiological concentrations of serum albumin and γ-globulin in human synovial fluid are 12 mg/mL and 0.24 mg/mL respectively as shown in Table 1.1. Hence the same concentrations were used in preparation of solutions of NaHA with proteins. All samples were kept stirring at 4 °C for about 12 hours to allow complete mixing of the NaHA powder in the PBS solution. Magnetic stirrers were used for this purpose. For the BSA and γ-Globulin samples, vigorous stirring was avoided to control froth formation. In case of a blob being found in the solution after 12 hours of mixing, the sample was further kept for stirring at 4 °C for 2 hours. Clear samples which were free from bubbles and blobs were used for all measurements.
4.4 Experimental procedure Oscillatory shear experiments were performed on the AR2000 rheometer from TA instruments. The geometry used for all samples containing 10 mg/mL NaHA was the double gap concentric cylinder. The gap was zeroed at required temperature before every measurement. The sample requirement for this geometry was 6.48 mL per measurement. The sample at 4 °C was allowed to come to room temperature (5 to 10 min) before loading. Fig. 4.2 shows the cone and plate geometry used in all rheometric measurements. The cone material was Stainless Steel and the Peltier plate used had a heat exchanger below it which was used for circulating water to aid cooling.
72
Texas Tech University, Amol Bhusari, May 2007
Fig.4.2 [81] Cone and plate geometry representation showing correct volume of sample loaded between the cone and plate. ‘R’ is radius of the cone and α is its angle Figure on the right shows the gap on account of truncation of cone. For the oscillatory shear procedure, equilibration period of 2 min was used after the instrument ensured that test temperature was achieved. This conditioning step was followed by a frequency sweep step in which the angular frequency was increased from 1 to 150 rad/sec in a logarithmic mode with 10 points per decade. The controlled variable was oscillatory stress with a value of 0.02976 Pa. G′ (Pa) and G″ (Pa) were plotted as a function of angular frequency (rad/s)
73
Texas Tech University, Amol Bhusari, May 2007
4.5 Results of oscillatory shear measurements 4.5.1 Oscillatory shear measurement results for samples with NaHA concentration 10 mg/mL Plots of G′ and G″ (Pa) against angular frequency (rad/s) are given below.
avg G',avg G" (Pa)
1000
100
avg G' avg G" 10
1 1
10
100
1000
angular frequency (rad/s)
Fig.4.4* Sample plot of mean G′ and mean G″ Vs angular frequency with error bars showing standard deviation from mean values. * G′ and G″ were averaged over 3 sets of data for sample with same concentration. The above result was obtained from data recorded for samples containing NaHA (10 mg/mL) and γ-globulin (2.4 mg/mL).
74
Texas Tech University, Amol Bhusari, May 2007
G',G" (Pa)
100
G'
10
G"
1 1
10
100
1000
angular frequency (rad/s) CROSSOVER : 14.08 rad/s ; 27.4 Pa
Fig.4.5* Storage and Loss moduli from oscillatory shear measurement at 20 °C using cone & plate geometry on a sample containing 10 mg/mL NaHA in PBS (pH 7.4) * Data points obtained for angular frequency value close to 150 rad/s exceed the measurement range on the instrument, and are hence, not plotted in following graphs.
75
Texas Tech University, Amol Bhusari, May 2007
G',G" (Pa)
100
G'
10
G"
1 1
10
100
angular frequency (rad/s) CROSSOVER : 16.67 rad/s ; 27.91 Pa
Fig.4.6* Storage and loss moduli from oscillatory shear measurement at 25 °C using cone & plate geometry on a sample containing 10 mg/mL NaHA in PBS (pH 7.4)
76
Texas Tech University, Amol Bhusari, May 2007
100
G',G" (Pa)
10 G' G" 1
0.1 1
10
100
angular frequency (rad/s) CROSSOVER : 22.12 rad/s ; 30.05 Pa
Fig.4.7* Storage and loss moduli from oscillatory shear measurement at 37°C using cone & plate geometry on a sample containing 10 mg/mL NaHA in PBS (pH 7.4)
From oscillatory shear measurements for pure Sodium hyaluronate solution (10 mg/mL), it is evident that as angular frequency increases, both storage modulus (G′) and loss modulus (G″) increase. At lower angular frequencies, loss modulus is greater than storage modulus (G″ > G′), and hence the fluid shows liquid like behavior. With increase in the angular frequency, crossover occurs, beyond which, storage modulus is greater than loss modulus (G′ > G″). In this region, the material shows solid like behavior. Characteristic relaxation time of the fluid is calculated from the crossover frequency. This is presented in Table 4.1
77
Texas Tech University, Amol Bhusari, May 2007
G',G" (Pa)
100
G'
10
G"
1 1
10
100
angular frequency (rad/s) CROSSOVER : 11.5 rad/s ; 33.01 Pa
Fig.4.8* Storage and loss moduli from oscillatory shear measurement at 20 °C using cone & plate geometry on a sample containing 10 mg/mL NaHA, 12 mg/mL BSA in PBS (pH 7.4)
78
Texas Tech University, Amol Bhusari, May 2007
G',G" (Pa)
100
G'
10
G"
1 1
10
100
angular frequency (rad/s) CROSSOVER : 13.08 rad/s ; 32.98 Pa
Fig.4.9* Storage and loss moduli from oscillatory shear measurement at 25 °C using cone & plate geometry on a sample containing 10 mg/mL NaHA, 12 mg/mL BSA in PBS (pH 7.4)
79
Texas Tech University, Amol Bhusari, May 2007
G',G" (Pa)
100
G'
10
G"
1 1
10
100
angular frequency (rad/s) CROSSOVER : 17.27 rad/s ; 35.48 Pa
Fig.4.10* Storage and loss moduli from oscillatory shear measurement at 37 °C using cone & plate geometry on a sample containing 10 mg/mL NaHA, 12 mg/mL BSA in PBS (pH 7.4)
From oscillatory shear measurements for samples containing Sodium hyaluronate (10 mg/mL) with Bovine Serum Albumin (12 mg/mL), it is evident that as angular frequency increases, both storage modulus (G′) and loss modulus (G″) increase. At lower angular frequencies, loss modulus is greater than storage modulus (G″ > G′), and hence the fluid shows liquid like behavior. With increase in the angular frequency, crossover occurs, beyond which, storage modulus is greater than loss modulus (G′ > G″). In this region, the material shows solid like behavior. Characteristic relaxation time is calculated from the crossover frequency. This is presented in Table 4.1 80
Texas Tech University, Amol Bhusari, May 2007
1000
G',G" (Pa)
100 G' G" 10
1 1
10
100
angular frequency (rad/s) CROSSOVER : 10.85 rad/s ; 33.54 Pa
Fig.4.11* Storage and loss moduli from oscillatory shear measurement at 20 °C using cone & plate geometry on a sample containing 10 mg/mL NaHA, 2.4 mg/mL γ-globulin in PBS (pH 7.4)
81
Texas Tech University, Amol Bhusari, May 2007
G',G" (Pa)
100
G'
10
G"
1 1
10
100
angular frequency (rad/s) CROSSOVER : 12.62 rad/s ; 34.2 Pa
Fig.4.12* Storage and loss moduli from oscillatory shear measurement at 25 °C using cone & plate geometry on a sample containing 10 mg/mL NaHA, 2.4 mg/mL γ-globulin in PBS (pH 7.4)
82
Texas Tech University, Amol Bhusari, May 2007
G',G" (Pa)
100
G'
10
G"
1 1
10
100
angular frequency (rad/s) CROSSOVER : 15.31 rad/s ; 36.88 Pa
Fig.4.13* Storage and loss moduli from oscillatory shear measurement at 37 °C using cone & plate geometry on a sample containing 10 mg/mL NaHA, 2.4 mg/mL γ-globulin in PBS (pH 7.4)
From oscillatory shear measurements for samples containing Sodium hyaluronate (10 mg/mL) with γ-globulin (2.4 mg/mL), it is evident that as angular frequency increases, both storage modulus (G′) and loss modulus (G″) increase. At lower angular frequencies, loss modulus is greater than storage modulus (G″ > G′), and hence the fluid shows liquid like behavior. With increase in the angular frequency, crossover occurs, beyond which, storage modulus is greater than loss modulus (G′ > G″). In this region, the material shows solid like behavior. Characteristic relaxation time is calculated from the crossover frequency. This is presented in Table 4.1
83
Texas Tech University, Amol Bhusari, May 2007
1000
G',G" (Pa)
100 G' G" 10
1 1
10
100
1000
angular frequency (rad/s) CROSSOVER : 10.33 rad/s ; 34.06 Pa
Fig.4.14* Storage and loss moduli from oscillatory shear measurement at 20 °C using cone & plate geometry on a sample containing 10 mg/mL NaHA, 2.4 mg/mL γ-globulin, 12 mg/mL BSA in PBS (pH 7.4)
84
Texas Tech University, Amol Bhusari, May 2007
G',G" (Pa)
100
G'
10
G"
1 1
10
100
1000
angular frequency (rad/s)
Fig.4.15* Storage and loss moduli from oscillatory shear measurement at 25 °C using cone & plate geometry on a sample containing 10 mg/mL NaHA, 2.4 mg/mL γ-globulin, 12 mg/mL BSA in PBS (pH 7.4)
85
Texas Tech University, Amol Bhusari, May 2007
G',G" (Pa)
100
G'
10
G"
1 1
10
100
1000
angular frequency (rad/s) CROSSOVER : 16.23 rad/s ; 36.49 Pa
Fig.4.16* Storage and loss moduli from oscillatory shear measurement at 37 °C using cone & plate geometry on a sample containing 10 mg/mL NaHA, 2.4 mg/mL γ-globulin, 12 mg/mL BSA in PBS (pH 7.4)
From oscillatory shear measurements for samples containing Sodium hyaluronate (10 mg/mL) with γ-globulin (2.4 mg/mL) and Bovine Serum Albumin (12 mg/mL), it is evident that as angular frequency increases, both storage modulus (G′) and loss modulus (G″) increase. At lower angular frequencies, loss modulus is greater than storage modulus (G″ > G′), and hence the fluid shows liquid like behavior. With increase in the angular frequency, crossover occurs, beyond which, storage modulus is greater than loss modulus (G′ > G″). In this region, the material shows solid like behavior. Characteristic relaxation is calculated from the crossover frequency. This is presented in Table 4.1 86
Texas Tech University, Amol Bhusari, May 2007
4.5.2 Results from steady flow meaurements for 10 mg/mL NaHA In addition to oscillatory shear experiments, steady shear experiments were also carried out to determine the viscosity of the solutions.
viscosity (Pa.s) ; shear stress (Pa)
100
10 Viscosity shear stress 1
0.1 0.01
0.1
1
10
100
shear rate (per sec) Zero shear viscosity : 10.75 Pa.s (Cross) ; 10.32 Pa.s (Carreau)
Fig.4.17* Viscosity and shear stress profile from a steady flow measurement at 20 °C using cone & plate geometry on a sample containing 10 mg/mL NaHA in PBS (pH 7.4). Viscosity is plotted with error bars showing standard deviation from average values * Results were averaged over 2 sets of data for a sample containing NaHA (10mg/mL). The standard deviation from data points was calculated by the same procedure mentioned above for oscillatory shear data.
87
Texas Tech University, Amol Bhusari, May 2007
viscosity
viscosity (Pa.s) ; shear stress (Pa)
10
viscosity
1 0.01
0.1
1
10
100
shear rate (per sec) Zero shear viscosity : 9.209 Pa.s (Cross) ; 9.105 Pa.s (Carreau)
Fig.4.18* Viscosity from steady flow measurement at 25 °C using cone & plate geometry on a sample containing 10 mg/mL NaHA in PBS (pH 7.4)
88
Texas Tech University, Amol Bhusari, May 2007
viscosity
viscosity (Pa.s) ; shear stress (Pa)
10
viscosity
1 0.1
1
10
100
shear rate (per sec) Zero shear viscosity : 6.338 Pa.s (Cross) ; 6.161 Pa.s (Carreau)
Fig.4.19* Viscosity from steady flow measurement at 37 °C using cone & plate geometry on a sample containing 10 mg/mL NaHA in PBS (pH 7.4)
Results plotted above for the sample containing Sodium Hyaluronate (10 mg/mL) show a Newtonian plateau at low shear rates and a shear thinning behavior for high shear rates. With increase in shear rate, viscosity is found to decrease. Material time is calculated from the shear rate at which shear thinning behavior sets in. The steady flow data is fitted to two rheological models: the Cross [40] and Carreau [41] fits. The Cross fit is defined by the equation: 89
Texas Tech University, Amol Bhusari, May 2007
η −η∞ = η0 −η∞
1
(4.6)
• m
(1 + (k × γ ) )
The Carreau fit is defined by the equation:
η −η∞ = η0 −η∞
1
(4.7)
• 2 n/2
(1 + (k × γ ) )
Here, k = consistency, which is equivalent to material time in sec
η ,η 0 andη ∞ are viscosity, zero shear viscosity and infinite shear viscosity respectively. The shear rate ( sec-1) is then calculated from inverse of material time.
viscosity (Pa.s) ; shear stress (Pa)
100
10
1 0.01
viscosity
0.1
1
10
100
shear rate (per sec) Zero shear viscosity : 10.33 Pa.s (Cross) ; 10.13 Pa.s (Carreau)
Fig.4.20* Viscosity from steady flow measurement at 20 °C using cone & plate geometry on a sample containing 10 mg/mL NaHA, 12 mg/mL BSA in PBS (pH 7.4)
90
Texas Tech University, Amol Bhusari, May 2007
viscosity (Pa.s) ; shear stress (Pa)
10
viscosity
1 0.01
0.1
1
10
100
shear rate (per sec) Zero shear viscosity : 9.321 Pa.s (Cross) ; 8.994 (Carreau)
Fig.4.21* Viscosity from steady flow measurement at 25 °C using cone & plate geometry on a sample containing 10 mg/mL NaHA, 12 mg/mL BSA in PBS (pH 7.4)
91
Texas Tech University, Amol Bhusari, May 2007
viscosity (Pa.s) ; shear stress (Pa)
10
viscosity
1 0.01
0.1
1
10
100
shear rate (per sec) Zero shear viscosity : 7.492 Pa.s (Cross) ; 7.486 (Carreau)
Fig.4.22* Viscosity from steady flow measurement at 37 °C using cone & plate geometry on a sample containing 10 mg/mL NaHA, 12 mg/mL BSA in PBS (pH 7.4)
92
Texas Tech University, Amol Bhusari, May 2007
viscosity
viscosity (Pa.s) ;l shear stress (Pa)
100
viscosity
10
1 0.01
0.1
1
10
100
shear rate (per sec) Zero shear viscosity : 11.17 Pa.s (Cross) ; 10.73 Pa.s (Carreau)
Fig.4.23* Viscosity from steady flow measurement at 20 °C using cone & plate geometry on a sample containing 10 mg/mL NaHA, 2.4 mg/mL γ-globulin in PBS (pH 7.4)
93
Texas Tech University, Amol Bhusari, May 2007
viscosity
viscosity (Pa.s) ; shear stress (Pa)
10
viscosity
1 0.01
0.1
1
10
100
shear rate (per sec) Zero shear viscosity : 9.741 Pa.s (Cross) ; 9.645 Pa.s (Carreau)
Fig.4.24* Viscosity from steady flow measurement at 25 °C using cone & plate geometry on a sample containing 10 mg/mL NaHA, 2.4 mg/mL γ-globulin in PBS (pH 7.4)
94
Texas Tech University, Amol Bhusari, May 2007
viscosity
viscosity (Pa.s) ; shear stress (Pa)
10
viscosity
1 0.01
0.1
1
10
100
shear rate (per sec) Zero shear viscosity : 4.913 Pa.s (Cross) ; 4.901 Pa.s (Carreau)
Fig.4.25* Viscosity from steady flow measurement at 37 °C using cone & plate geometry on a sample containing 10 mg/mL NaHA, 2.4 mg/mL γ-globulin in PBS (pH 7.4)
95
Texas Tech University, Amol Bhusari, May 2007
viscosity
viscosity (Pa.s) ; shear stress (Pa)
100
viscosity
10
1 0.01
0.1
1
10
100
shear rate (per sec) Zero shear viscosity : 11.92 Pa.s (Cross) ; 11.46 Pa.s (Carreau)
Fig.4.26* Viscosity from steady flow measurement at 20 °C using cone & plate geometry on a sample containing 10 mg/mL NaHA, 2.4 mg/mL γ-globulin, 12 mg/mL BSA in PBS (pH 7.4)
96
Texas Tech University, Amol Bhusari, May 2007
viscosity
viscosity (Pa.s) ; shear stress (Pa)
100
viscosity
10
1 0.01
0.1
1
10
100
shear rate (per sec) Zero shear viscosity : 10.35 Pa.s (Cross) ; 10.06 Pa.s (Carreau)
Fig.4.27* Viscosity from steady flow measurement at 25 °C using cone & plate geometry on a sample containing 10 mg/mL NaHA, 2.4 mg/mL γ-globulin, 12 mg/mL BSA in PBS (pH 7.4)
97
Texas Tech University, Amol Bhusari, May 2007
viscosity
viscosity (Pa.s) ; shear stress (Pa)
10
viscosity
1 0.01
0.1
1
10
100
shear rate (per sec) Zero shear viscosity : 8.209 Pa.s (Cross) ; 8.213 Pa.s (Carreau)
Fig.4.28* Viscosity from steady flow measurement at 37 °C using cone & plate geometry on a sample containing 10 mg/mL NaHA, 2.4 mg/mL γ-globulin, 12 mg/mL BSA in PBS (pH 7.4)
98
Texas Tech University, Amol Bhusari, May 2007
4.5.3 Data from steady flow and oscillatory shear measurements The oscillatory shear results were analyzed by plotting the storage modulus (G′) and loss modulus (G″) versus angular frequency (rad/s). The software supplied by TA instruments was used to determine the crossover frequency and the value of the moduli at the crossover frequency. The results of oscillatory shear measurements show certain changes with variation in different parameters like temperature, concentration, time. The changes observed are shift in the crossover frequency and the storage and loss moduli.
Table 4.1*Effect of addition of proteins on viscoelastic properties of NaHA
SOLUTION
CROSSOVER FREQUENCY (rad/s) 20°C 25°C 37°C
CHARACTERISTIC RELAXATION TIME (sec) 20°C 25°C 37°C
G' and G″ AT CROSSOVER (Pa) 20°C 25°C 37°C
NaHA10
14.08
16.67
22.12
0.446
0.377
0.284
27.40
27.91
30.05
NaHA10+BSA12
11.50
13.08
17.27
0.546
0.480
0.364
33.01
32.98
35.48
NaHA10+GG2.4
10.85
12.62
15.31
0.579
0.498
0.410
33.54
34.20
36.88
NaHA+BSA12+GG2.4
10.33
11.71
16.23
0.608
0.537
0.387
34.06
36.31
36.49
NaHA+BSA12+GG2.4-2**
18.45
* NOTES 1. NaHA10=Sodium hyaluronate, 10 mg/mL in PBS with pH 7.4 2. BSA12=Bovine Serum Albumin, 12 mg/mL in PBS with pH 7.4 3. GG2.4=Bovine γ-globulin, 2.4 mg/mL in PBS with pH 7.4 4. G' = Storage modulus ; G″ = Loss modulus ** Solution kept for 24 hours in a water bath at 37 °C before measurements
99
39.98
Texas Tech University, Amol Bhusari, May 2007
Table 4.2*Effect of BSA concentration on viscoelastic properties of HA solution
SOLUTION
CROSSOVER FREQUENCY (rad/s) 20°C 25°C 37°C
CHARACTERISTIC RELAXATION TIME (sec) 20°C 25°C 37°C
G' and G″ AT CROSSOVER (Pa) 20°C 25°C 37°C
NaHA10+BSA6
10.65
12.38
16.53
0.59
0.5
0.38
34.82
34.57
34.64
NaHA10+BSA12
13.24
15.2
20.98
0.47
0.41
0.3
28.86
29.26
30.1
NaHA+BSA12+BSA24
11.29
13.2
18.03
0.55
0.47
0.34
32.45
33.13
34.04
* NOTES 1. NaHA10=Sodium hyaluronate, 10 mg/mL in PBS with pH 7.4 2. BSA12=Bovine Serum Albumin, 12 mg/mL in PBS with pH 7.4 3. GG2.4=Bovine γ-globulin, 2.4 mg/mL in PBS with pH 7.4 4. G' = Storage modulus ; G″ = Loss modulus
Table 4.3*Effect of γ-globulin concentration on viscoelastic properties of HA solution
SOLUTION
CROSSOVER FREQUENCY (rad/s) 20°C 25°C 37°C
CHARACTERISTIC RELAXATION TIME (sec) 20°C 25°C 37°C
G' and G″ AT CROSSOVER (Pa) 20°C 25°C 37°C
NaHA10+GG1.2
11.41
13.37
16.15
0.55
0.47
0.39
32.11
33.24
39.26
NaHA10+GG2.4
10.74
12.3
14.88
0.58
0.51
0.42
33.78
33.57
40.71
NaHA+GG7
12.51
13.59
18.63
0.5
0.46
0.33
29.31
30.65
30.38
* NOTES 1. NaHA10=Sodium hyaluronate, 10 mg/mL in PBS with pH 7.4 2. BSA12=Bovine Serum Albumin, 12 mg/mL in PBS with pH 7.4 3. GG2.4=Bovine γ-globulin, 2.4 mg/mL in PBS with pH 7.4 4. G' = Storage modulus ; G″ = Loss modulus
100
Texas Tech University, Amol Bhusari, May 2007
Table 4.4*Effect of proteins on zero shear viscosity of NaHA SOLUTION
ZERO SHEAR VISCOSITY (Pa.s) 20°C 25°C CROSS CARREAU CROSS CARREAU
37°C CROSS
CARREAU
NaHA10
10.75
10.32
9.21
9.11
6.34
6.16
NaHA10+BSA12
10.33
10.13
9.32
8.99
7.49
7.49
NaHA10+GG2.4
11.17
10.73
9.74
9.65
4.91
4.90
NaHA+BSA12+GG2.4
11.92
11.46
10.35
10.06
8.21
8.21
* NOTES 1. NaHA10=Sodium hyaluronate, 10 mg/mL in PBS with pH 7.4 2. BSA12=Bovine Serum Albumin, 12 mg/mL in PBS with pH 7.4 3. GG2.4=Bovine γ-globulin, 2.4 mg/mL in PBS with pH 7.4
Table 4.5*Effect of proteins on the viscosity of NaHA
20°C CROSS
SHEAR RATE AT WHICH SHEAR THINNING BEHAVIOR SETS IN (1/sec) 25°C 37°C CARREAU CROSS CARREAU CROSS CARREAU
NaHA10
5.26
1.75
4.17
1.45
8.33
3.03
NaHA10+BSA12
4
1.25
6.25
2.04
4.35
2.04
NaHA10+GG2.4
5
1.75
4
1.47
11.11
5
NaHA+BSA12+GG2.4
5
1.59
5.56
1.89
4.17
2.22
SOLUTION
* NOTES 1. NaHA10=Sodium hyaluronate, 10 mg/mL in PBS with pH 7.4 2. BSA12=Bovine Serum Albumin, 12 mg/mL in PBS with pH 7.4 3. GG2.4=Bovine γ-globulin, 2.4 mg/mL in PBS with pH 7.4
101
Texas Tech University, Amol Bhusari, May 2007
Table 4.6*Effect of proteins on the relaxation time of NaHA (calculated from steady shear experiments) SOLUTION
CHARACTERISTIC RELAXATION TIME (sec) 20°C 25°C 37°C CROSS CARREAU CROSS CARREAU CROSS
CARREAU
NaHA10
0.19
0.57
0.24
0.69
0.12
0.33
NaHA10+BSA12
0.25
0.8
0.16
0.49
0.23
0.49
NaHA10+GG2.4
0.2
0.57
0.25
0.68
0.09
0.2
NaHA+BSA12+GG2.4
0.2
0.63
0.18
0.53
0.24
0.45
* NOTES 1. NaHA10=Sodium hyaluronate, 10 mg/mL in PBS with pH 7.4 2. BSA12=Bovine Serum Albumin, 12 mg/mL in PBS with pH 7.4 3. GG2.4=Bovine γ-globulin, 2.4 mg/mL in PBS with pH 7.4
4.5.4 Temperature dependence of viscosity The temperature variation was applied using the Peltier temperature control on the TA instruments’ rheometer. The temperatures applied were 20, 25 and 37 °C. These temperatures were chosen to represent reference, room and physiological environment. The system was made to wait till equilibrium was attained, before starting measurements. This ensured that the cone, peltier plate and sample-all were at the desired temperature. The effect of temperature is seen on the crossover frequency. The crossover frequency is found to increase with increase in temperature for all samples.
102
Texas Tech University, Amol Bhusari, May 2007
4.5.5 Effect of proteins Oscillatory shear measurements show that The crossover frequency for all samples containing proteins is low when compared to just NaHA. The effect of γglobulin is more pronounced, although it is present at a concentration lower than BSA. The effect of BSA and γ-globulin together results in a decrease in the crossover frequency of NaHA. This effect is, however, not additive when compared to the individual effect of BSA and γ-globulin. Decrease in crossover frequency on addition of proteins implies that the characteristic relaxation time increases. Thus proteins, in addition to HA, are found to contribute to the mechanism of lubrication. The loss and storage modulus values at crossover are found to increase for all samples containing proteins in comparison to the NaHA (10 mg/mL) sample. The data from steady flow measurements was fitted to Cross and Carreau models to calculate zero shear viscosities for all samples. Perfect fits were not obtained for all measurements, but the data shows increase in zero shear viscosity of NaHA on addition of proteins for most of the samples. For steady flow measurements, the frequency at which transition from Newtonian behavior to shear thinning behavior occurs is comparable to crossover frequency obtained in oscillatory shear measurements. As perfect fits could not be obtained for all steady flow measurements, the comparison of this frequency value at which shear thinning behavior sets in with the crossover frequency from oscillatory shear data could not be done. Also, characteristic relaxation time found from steady flow measurements could not be compared to that from oscillatory shear measurements. 103
Texas Tech University, Amol Bhusari, May 2007
4.5.6 Effect of different BSA concentrations The crossover frequency was found to increase for 12 mg/mL and 24 mg/mL BSA in comparison with 6 mg/mL BSA. However, the increase was more for 12 mg/mL concentration than 24 mg/mL concentration. Oscillatory shear measurements should be carried out at lower concentrations of NaHA (3 mg/mL) for observing the effect of BSA concentration.
4.5.7 Effect of different γ-globulin concentrations The crossover frequency was found to increase for 7 mg/mL γ-globulin in comparison with 1.2 mg/mL BSA. However, there was a decrease for 2.4 mg/mL concentration than 1.2 mg/mL concentration. Oscillatory shear measurements should be carried out at lower concentrations of NaHA (3 mg/mL) for observing the effect of γ-globulin concentration.
104
Texas Tech University, Amol Bhusari, May 2007
CHAPTER 5 SUMMARY & CONCLUSIONS Rheology of synovial fluid plays a key role in understanding the mechanism of joint lubrication. Such knowledge will play an important role in developing better treatment methods for osteoarthritis (OA). Hyaluronic acid plays a key role in the rheological properties of synovial fluid. Intraarticular injections of Hyaluronic acid are administered to patients suffering from degenerative joint diseases. This treatment method has been shown to temporarily increase viscosity of synovial fluid in patients. The role of proteins in in the rheology of synovial fluid due to their possible interaction with HA has been explored in this work. Steady flow and oscillatory shear measurements have been performed on solutions of HA and the effect of addition of proteins has been studied. The addition of proteins is found to affect both the steady flow and dynamic mechanical properties of HA solutions. Specifically, the addition of proteins is found to increase the zero shear viscosity of HA. The oscillatory shear measurements show that both G′ and G″ values increase with angular frequency for addition of proteins to HA. The relaxation time determined from the crossover of G′ and G″ also increases for addition of proteins. The changes in viscoelastic properties have been found to be significant due to the addition of γ-globulin than BSA, although γglobulin is at a lower concentration ( 2.4 mg/mL) than BSA (12 mg/mL). The effect of BSA and γ-globulin together on the viscoelasticity of HA is more pronounced than that resulting from the addition of the individual proteins, but it is not completely additive. Molecular dynamics simulations carried out in this work on a system containing HA, proteins and water shows that HA is in more spatial proximity to proteins, than 105
Texas Tech University, Amol Bhusari, May 2007 water. Another MD simulation of a HA decamer and water shows that HA does not associate with water. Another MD simulation ( 5 ns HA trimers-water ; Fig.3.22)of HA trimers and water has shown that HA trimers form aggregates among themselves rather than binding with water. The Hydrogen bond calculations for systems of HA-water and HA-protein-water show that the hydrogen bond formation between HA and water molecules is disrupted due to addition of the protein (BSA). The decrease in the number of Hydrogen bonds between HA-water due to addition of BSA confirms that interaction exists between HA and BSA. Thus addition of proteins is seen to affect both the structure and the rheology of HA solutions. The increase in zero shear viscosity of HA for steady shear measurements and increase in relaxation time for oscillatory shear measurements on addition of proteins would support the lubrication function of synovial fluid. Rheological studies on synovial fluid samples from patients of OA and RA need to be examined for effect of proteins (serum albumin and γ-globulin). The concentration of HA is found to change with onset of arthritis. The change in individual concentrations of serum albumin and γ-globulin due to arthritic conditions should be looked at. Solutions containing lower concentration of HA (3 mg/mL) could help in looking at the effect of proteins on rheology of HA in a better way. At low HA concentration, the effect of proteins on steady flow and dynamic shear properties could be recorded in a better way. Rheological studies on samples of synovial fluids with different protein concentrations from patients of OA and RA would throw more light on the effect of HA-protein interactions.
106
Texas Tech University, Amol Bhusari, May 2007 Molecular dynamics simulations on systems of HA and protein could help to look at these interactions in a better way if the HA binding sites on proteins like serum albumin are identified. There has been a lot of research work across different disciplines in pursuit of understanding the mechanism of joint lubrication. This work on HA-protein interaction has shown that it is not just HA, but other components of the synovial fluid also, which are responsible for the rheological properties of synovial fluid. Further work in the area of HA-protein interactions would help in elucidating the joint lubrication mechanism, and pave way for a better treatment for joint diseases.
107
Texas Tech University, Amol Bhusari, May 2007
BIBLIOGRAPHY [1] Casentini, G.; Di Paola, L.; Marrelli, L.; Palma F.; “Rheological characterization of an artificial synovial fluid”, The International Journal of Artifical Organs, 28(7), 711-717 (2005) [2] Xu, H.; Ito, T.; Tawada, A.; Maeda, H.; Yamanokuchi; Isahara, K.; Yoshida K.; Uchiyama, Y.; Asari, A.; “Effect of hyaluronan ologosaccharides on the expression of heat shock protein 72”, J.Biol.Chem., 277, 17308-17314 (2002) [3] Kogan, G.; Soltes, L.; Stern, R.; Gemeiner, P.; “Hyaluronic acid: A natural biopolymer with a broad range of biomedical and industrial applications, Biotechnology Letters, 29, 17-25 (2007) [4] Meyer, K.; Palmer, J.; “The polysaccharide of the vitreous humor”, J. Biol. Chem., 107 629-634 (1934) [5] Levick, J.; “Synovial fluid and trans-synovial flow in stationary and moving joints” in : Helminem, H.; Kaviranta, I.; Tammi, M.; Saamaren, A.; Paukonnen, K.; Jurvelin, J.; Joint Loading : Biology and Health of Articular Surfaces, Bristol:Wright & Sons; 149186 (1999) [6] Laurent, T.; The Chemistry, Biology and Medical Applications of Hyaluronan and its Derivatives, Portland press: London, 1998 [7] E. Morris, D. Rees, E. Welsh, “Conformation and dynamic interactions in hyaluronate solutions”, J. Mol. Biol. 138 383-400 (1980) [8] Terbojevich, M.; Cosani, A.; Palumbo, M.; “Structural properties of hyaluronic acid in moderately concentrated solutions”, Carbohydr. Res., 149, 363-377 (1986) [9] Gomez, J.; Thurston, G.; “Comparisons of the oscillatory shear viscoelasticity and composition of pathological synovial fluids”, Biorheology, 30, 409-427 (1993) [10] Myers, R.; Negami, S.; White, R.; “Dynamic mechanical properties of synovial fluid”, Biorheology, 3, 197-209 (1966) [11] Tirtaatmadja,V.; Boger, D.; Fraser, J.; “The dynamic and shear properties of synovial fluid and the components making up synovial fluid”, Rheol. Acta 23, 311-321 (1984) [12] Balazs, E.; “The physical properties of synovial fluid and the specific role of hyaluronic acid”. In Disorders of the knee. Helfet A.J., Philadelphia: T.B.Lipincott Company, 63-75 (1974)
108
Texas Tech University, Amol Bhusari, May 2007 [13] Schurz, J.; “Rheology of synovial fluids and substitute polymers”, J.M.S.-Pure Appl. Chem,. A33(9) , 1249-1262 (1996) [14] Soltes, L.; Mendichi, R.; Kogan, G.; Schiller, J.; Stankovska, M.; Arnhold, J.; “Degradative action of reactive oxygen species on hyaluronan”, Biomacromolecules, 7, 659-668 (2006) [15] Balazs, E.; Denlinger, J.; “ Clinical uses of Hyaluronan”, Ciba Foundation Symposium, 143 265-280 (1989) [16] Tate, D.; Oliver, P. Miceli, M.; Stern, R.; Shuster, S.; Newsome, D.; “Age dependent change in the hyaluronic acid content of the human chorioretinal complex”, Arch. Ophthalmol. 111 963-967 (1993) [17] Yerushalmi, N.; Arad, A.; Margalit, R.; “Molecular and cellular studies of hyaluronic-acid modified liposomes as bioadhesive carriers of growth factors, for topical delivery in wound healinG″, Arch. Biochem. Biophys. 313 267-273 (1994) [18] Holmes, M.; Bayliss, M.; Muir, H.; “Hyaluronic acid in human articular cartilage. Age-related changes in content and size”, Biochem. J., 250, 435-441 (1988) [19] Everead, D.; Whelan, J.; The Biology of Hyaluronan (Ciba Foundation Symposium 143 ), New York, 1989 [20] Schurz, J.; Ribitsch,V.; “Rheology of synovial fluid”, Biorheology, 24, 385-399 (1987) [21] Atkins, E.D.T.; Meader, D.; Scott, J.; “Model for hyaluronic acid incorporating four intramolecular hydrogen bonds”, Intl. J. Biol. Macromol. ,2, 318-319 (1980) [22] Muller, F.; Pita, J.; Manicourt, D.; Malinin, T.; Schoonbeck, J.; Mow, V.; “Centrifugal characterization of proteoglycans from various depth layers and weightbearing areas of normal and abnormal human articular cartilage”, J.Orthop. Res., 7, 326334 (1989) [23] Li, M.; Rosenfield, L.; Vilar, R.; Cowman, M.; “Degradation of Hyaluronan by Peroxynitrite”, Arch. Biochem. Biophys. 341 245-250 (1997) [24] Scott, J.; Cummings, C; Brass, A.; Chen, Y.; “Secondary and tertiary structures of hyaluronan in aqueous solution, investigated by rotary shadowing-electron microscopy and computer simulation”, Biochem J., 274, 699-705 (1991) [25] Cleland, R.; “Viscometry and sedimentation equilibrium of partially hydrolyzed hyaluronate: comparison with theoretical models of wormlike chains”, Biopolymers, 23 647-666 (1984)
109
Texas Tech University, Amol Bhusari, May 2007 [26] Schuettelkopf, A.; van Aalten, D.M.F.; “PRODRG - a tool for high-throughput crystallography of protein-ligand complexes”, Acta Crystallographica, D60, 1355-1363 (2004) [27] D.A. Case, T.A. Darden, T.E. Cheatham, III, C.L. Simmerling, J. Wang, R.E. Duke, R. Luo, K.M. Merz, B. Wang, D.A. Pearlman, M. Crowley, S. Brozell, V. Tsui, H. Gohlke, J. Mongan, V. Hornak, G. Cui, P. Beroza, C. Schafmeister, J.W. Caldwell, W.S. Ross, and P.A. Kollman (2004), AMBER 8, University of California, San Francisco [27A] Humphrey, W.; Dalke, A.; Schulten, K.; "VMD - Visual Molecular Dynamics", J. Molec. Graphics, 14, 33-38 (1996) [28] Ambrosio, L.; Borzacchiello, A.; Netti, P. and Nicolais, L.; “Rheological study on hyaluronic acid and its derivative solutions”, J.M.S.(Pure Appl.Chem.), A36(7&8) , 991-1000 (1999) [29] Miyazaki, T.; Yomota,C.; Okada, S.; “Change in molecular weight of hyaluronic acid during measurement with a cone-plate rotational viscometer”, J.Appl.Pol.Sci. 67, 2199-2206 (1998) [30] Gatej, I.; Popa, M.; Rinuado, M.; “Role of the pH on hyaluronan behavior in aqueous solution”, Biomacromolecules, 6, 61-67 (2005) [31] Mazzucco, D.; McKinley, G.; Scott, R.; Spector, M.; “Rheology of joint fluid in total knee arthroplasty patients”, J. Orth. Res. 20, 1157-1163 (2002) [32] Cowman, M.; Matsuoka, S.; “Experimental approaches to Hyaluronan structure”, Carbohydrate Res., 340, 791-809 (2005) [33] Grymonpre,K.; Staggemeier,B.; Dubin, P.; Mattison, K.; “Identification by integrated computer modeling and light scattering studies of an electrostatic serum albumin-hyaluronic acid binding site”, Biomacromolecules, 2, 422-429 (2001) [34] Xu, S.; Yamanaka, J.; Sato, S.; Miyama, I.; Yonese, M., “Characteristics of complexes composed of sodium hyaluronate and bovine serum albumin”, Chem. Pharm. Bull,, 48, 779-783 (2000) [35] Simkin, P.; in Coopman, W.; “Arthritis and allied conditions”, Baltimore, Williams & Wilkins, ch.9, 193-205, 1997 [36] Oates, K.; Krause, W.; Jones, R.; Colby, R.; “Rheopexy of synovial fluid and protein aggregation”, Journal of the Royal Society Interface, 3, 167-174 (2006) [37] Krause, W.; Bellomo, E.; Colby, R.; “Rheology of sodium hyaluronate under physiological conditions”, Biomacromolecules, 2, 65-69 (2001) 110
Texas Tech University, Amol Bhusari, May 2007
[38] Ogston, A.; Stainer, J.; “Further observations on the preparation and composition of the hyaluronic acid complex of ox synovial fluid”, Biochem. J., 52, 149-156 (1952) [39] Renaud, M.; Belgacem, M.; Rinuado, M.; “Rheological behavior of polysaccharide aqueous solutions”, Polymer, 46, 12348-12358 (2005) [40] Cross, M.; Rheology of non-Newtonian fluids: a new flow equation for pseudoplastic systems”, J. Colloid Sci., 20, 417-437 (1965) [41] Bird, R.; Carreau, P.; “A nonlinear viscoelastic model for polymer solutions and melts”, Chem. Eng. Sci., 23, 427-434 (1968) [42] Pisarcik, M.; Bakos, D.; Ceppan, M.; “Non-Newtonian properties of hyaluronic acid aqueous solution”, Colloids and Surfaces A, 97, 197-202 (1995) [43] Mo, Y.; Takaya, T.; Nishinari, K.; Kubota, K.; Okamoto, A.; “Effects of Sodium Chloride, Guanidine Hydrochloride, and Sucrose on the Viscoelastic Properties of Sodium Hyaluronate Solutions”, Biopolymers, 50, 23-34 (1999) [44] Mo,Y.; Nishinari, K.; “Rheology of hyaluronan solutions under extensional flow”, Biorheology, 38, 379-387 (2001) [45] Falcone, S.; Palmeri, D.; Berg, R.; “Rheological and cohesive properties of hyaluronic acid”, J.Biomed.Mater.Res., 76A(4), 721-728 (2005) [46] Fuji, K.; Kawata, M.; Kobayashi, Y.; Okamoto, A.; “Effects of the Addition of Hyaluronate Segments with Different Chain Lengths on the Viscoelasticity of Hyaluronic Acid solutions”, Biopolymers, 38, 583-591 (1996) [47] Nishimura, M.; Kawata, M.; Yan, W.; Okamato, A.; Nishimura, H.; Ozaki, Y.; Hamada, T.; and Kato, Y.; “Quantotative analysis of the effects of hyaluronan and aggrecan concentration and hyaluronan size on the elasticity of hyaluronan-aggrecan solutions”, Biorheology, 41, 629-639 (2004) [48] Tadmor, R.; Chen, N.; Israelachvili, J.; “Thin film rheology and lubricity of hyaluronic acid solutions at a normal physiological concentration”, J.Biomed.Mater.Res., 61(4), 514-523 (2002) [49] Zhu, Y.; Granick, S.; “Biolubrication: hyaluronic acid and the effect on its interfacial viscosity of an anti-inflammatory druG″, Macromolecules, 36, 973-976 (2003) [50] Kaufmann, J.; Mohle, K.;Hofmann, H.; Arnold, K.; “Molecular dynamics study of hyaluronic acid in water”, J.Mol.Struc.(Theochem), 422, 109-121 (1998)
111
Texas Tech University, Amol Bhusari, May 2007 [51] Spoel, D.; Lindahl,E.; Hess, B.; Groenhof, G.; Mark, A.;Berendsen, H.; “GROMACS: fast, flexible and free”, J.Comp.Chem, 26, 1701-1718 (2005) [51A] Berendsen, H.J.C.; Postma, J.P.M.; van Gunsteren W.F.; Hermans, J.; “Interaction model for water in relation to protein hydration”, in Pullman, B.; Intermolecular Forces, D.Riedel Publishing Company, 331-342 (1981) [51B] Berendsen, H.J.C.; Postma, J.P.M.; van Gunsteren, W.F.; DiNola, A.; Haak, J.R.; “Molecular dynamics with coupling to an external bath”, J.Chem.Phys., 81(8), 3684-3690 (1984) [51C] Parrinello, M.; Rahman, A.; “Crystal structure and pair potentials: a molecular dynamics study”, Phys. Rev. Lett., 45, 1196-1199 (1980) [51D] Parrinello, M.; Rahman, A.; “Polymorphic transitions in single crystals: a new molecular dynamics method”, J. appl. Phys., 52, 7182-7190 (1981) [51E] Parrinello, M.; Rahman, A.; “Strain fluctuations and elastic constants”, J. Chem. Phys., 76, 2662-2666 (1982) [52] Scott, J.; “Secondary structure in hyaluronan solutions:chemical and biological implications. In The Biology of Hyaluronan (Ciba Foundation Symposium 143) Wiley: New York, 6-20 (1989) [53] Heatley, F.; Scott, J.; “A water molecule participates in the secondary structure of hyaluronan”, Biochem. J., 254, 489-493 (1988) [54] Scott, J.; Heatley, F.; Hull, W.; “Secondary structure of hyaluronate in solution”, Biochem. J., 220, 197-205 (1984) [55] Almond, A.; Sheehan, J.; Brass, A.; “Molecular dynamics simulations of the two disaccharides of hyaluronan in aqueous solution”, Glycobiology, 7(5), 597-604 (1997) [56] Verli,H.; Guimaraes,J.; “Molecular dynamics simulation of a decasaccharide fragment of heparin in aqueous solution”, Carbohydrate Research, 339, 281-290 (2004) [57] 1 Becker,C.; Guimaraes, J.;Verli,H.; “Molecular dynamics and atomic charge calculations in the study of heparin conformation in aqueous solution”, Carbohydrate Research, 340, 1499-1507 (2005) [58] Haxaire,K.; Braccini,I.; Milas,M.; Rinaudo,M.; Perez,S.; “Conformational behavior of hyaluronan in relation to its physical properties as probed by molecular modelinG″, Glycobiology, 10(6), 587-594 (2000)
112
Texas Tech University, Amol Bhusari, May 2007 [59] Imberty,A.; Perez,S.; “Structure, conformation, and dynamics of bioactive oligosaccharides: theoretical approaches and experimental validations”, Chem.Rev., 100, 4567-4588 (2000) [60] van Gunsteren, W.F.; Daura, X.; and Mark, A.; “GROMOS force field”, En. Comp. Chem, 2, 1211-1216 (1998) [61] Woods, R.; Dwek, R.; Fraser-Reid, B.; “Molecular mechanical and molecular dynamical simulations of glycoproteins and oligosaccharides, 1. GLYCAM-93 parameter development”, J.Phys.Chem., 99, 3832-3846 (1995) [62] Scott, J.; Healey, F.; “Hyaluronan forms specific stable tertiary structures in aqueous solution: a 13C NMR study”, Proc. Natl. Acad. Sci.USA, 96, 4850-4855 (1999) [63] Heatley, F.; Scott, J.; “A water molecule participates in the secondary structure of hyaluronan”, Biochem. J., 254, 489-493 (1988) [64] Scott, J.; Heatley, F.; Hull, W.; “Secondary structure of hyaluronate in solution”, Biochem. J., 220, 197-205 (1984) [65] Grace,H.; La Valley, M.; McAlindon, T.; Felson, D.; “Intra-articular hyaluronic acid in treatment of knee osteoarthritis”, JAMA, 293(23), 3115-3121 (2003) [66] Grecomoro, G.; La Sala, F.; Francavilla, G.; “Rheologic changes in the synovial fluid of patients with gonarthritis induced by intraarticular infiltration of hyaluronic acid”, Int. J. Tissue React., XXII(2) 67-71 (2001) [67] Elsaid, K.; Jay, G.; warman, M.; Rhee, D.; Chichester, C.; “Association of articular cartilage degradation and loss of boundary-lubricating ability of synovial fluid following injury and inflammatory arthritis”, Arth. And Rheum., 52(6), 1746-1755 (2005) [68] Brandt, K.; Smith, G.; Myers, S.; “Hyaluronan injection affects neither osteoarthritis progression nor loading of the OA knee in dogs”, Biorheology, 41, 493-502 (2004) [69] Oates, K.; Krause, W.; Colby, R.; “Using rheology to probe the mechanism of joint lubrication: polyelectrolyte-protein interactions in synovial fluid”, Mat. Res. Soc. Symp. Proc.; 711, FF4.7.1-4.7.6 (2002) [70] Swann, D.; Silver, F.; Slayter, H.; Stafford, W.; Shore, E.; “The molecular structure and lubricating activity of lubricin isolated from bovine and human synovial fluids”, Biochem. J., 225, 195-201 (1985) [71] Gribbon, P.; Heng,B.C.; Hardingham, T.; “The analysis of intermolecular interactions in concentrated hyaluronan solutions suggest no evidence of chain-chain association”, Biochem. J., 350, 329-335 (2000) 113
Texas Tech University, Amol Bhusari, May 2007
[72] Miltner, O.; Scneider, U.; Siebert, C.; Niedhart, C.; Niethard, F.; “Efficacy of intraarticular hyaluronic acid in patients with osteoarthritis-aprospective clinical trial”, Osteo. Cartilage, 10(9), 680-686 (2002) [73] Duan, Y.; Wu, C.; Chowdhury, S.; Lee, M.; Xiong, G.; Zhang, W.; Yang, R.; Cieplak, P.; Luo, R.; Lee, T.; Caldwell, J.; Wang, J.; Kollman, P.; “ A Point-Charge Force Field for Molecular mechanics Simulations of Proteins Based on Condensed-Phase Quantum Mechanical Calculations”, J. Comp. Chem., 24, 1999-2012 (2003) [74] Essmann, U.; Perera, L.; Berkowitz, M.; “A smooth particle mesh Ewald method”, J. Chem Phys.,103(19), 8577-8593 (1995) [75] Damm, W.; Frontera, A.; Rives, J.T.; Jorgensen, W.; “OPLS-all atom force field for carbohydrates”, J. Comp. Chem., 18(16), 1955-1970 (1997) [76] Jakalian, A.; Jack, B.; Bayly, C.; “Fast, efficient generation of high quality atomic charges. AM1 BCC model. II: Parameterization and validation”, J. Comput. Chem., 23, 1623-1641 (2002) [77] Ryjacek, F., Ambconv, a free contributed software for AMBER to GROMACS format conversion [78] Turner, P.; Center for Coastal and Land-Margin Research, Oregon Graduate Institute of Science and Technology Beaverton, Oregon [79] Franck, A.; TA instruments, Germany, TA instruments Application Library, AAN009 [80] Besançon, R.; The Encyclopedia of Physics, Third Edition. Van Nostrand Reinhold Company (1985) [81] TA instruments’ Rheology advantage software documentation
114
Texas Tech University, Amol Bhusari, May 2007
APPENDIX 1.PDB FILE FORMAT TITLE REMARK CRYST1 MODEL ATOM ATOM ATOM ATOM ATOM .
This is part of a pdb file for the protein-HA-water system All co-ordinates in A ; Line below shows box dimensions 48.335 48.335 48.335 90.00 90.00 90.00 P 1 1 1 1 N SER 1 3.620 12.860 6.980 1.00 0.00 2 H1 SER 1 2.950 12.760 7.670 1.00 0.00 3 H2 SER 1 4.570 12.890 7.450 1.00 0.00 4 H3 SER 1 3.550 13.680 6.430 1.00 0.00 5 CA SER 1 3.830 11.710 6.120 1.00 0.00
. . ATOM 9204 TER ENDMDL
HAD DRG
1595
46.380
15.360
31.130
1.00
0.00
2. TOP FILE FORMAT ; Example topology file ; [ defaults ] ; nbfunc comb-rule gen-pairs 1 1 no
fudgeLJ fudgeQQ 1.0 1.0
; Include forcefield parameters #include "ffgmx.itp" #include "ha.top" [ moleculetype ] ; Name nrexcl DRG 3 [ atoms ] ; nr type resnr 1 CH3 1 2 C 1 3 O 1 4 N 1 5 H 1 .... .... [ bonds ] ; ai aj fu c0, c1, 1 2 1 0.153 2 3 1 0.123 2 4 1 0.133 4 5 1 0.100 .... .... [ pairs ] ; ai aj fu c0, c1, 1 5 1 1 6 1 2 7 1 2 18 1 .... ....
resid DRG DRG DRG DRG DRG
atom CAA CAP OAB N2 HAG
... 334720.0 502080.0 418400.0 374468.0
cgnr 1 1 1 1 1
0.153 0.123 0.133 0.100
charge 0.029 0.421 -0.606 0.155 0.001
mass 15.0350 12.0110 15.9994 14.0067 1.0080
334720.0 502080.0 418400.0 374468.0
; ; ; ;
CAA CAP CAP N2
CAP OAB N2 HAG
; ; ; ;
CAA CAA CAP CAP
HAG C2 C1 C3
...
115
Texas Tech University, Amol Bhusari, May 2007
[ angles ] ; ai aj ak 1 2 3 1 2 4 3 2 4 2 4 5
fu 1 1 1 1
[ dihedrals ] ; ai aj ak al 2 1 4 3 4 2 5 6 23 22 25 24 6 4 7 18
c0, c1, ... 121.0 502.1 115.0 502.1 124.0 502.1 123.0 292.9
fu 2 2 2 2
c0, c1, m, ... 0.0 1673.6 0.0 1673.6 0.0 1673.6 35.3 836.8
121.0 115.0 124.0 123.0
502.1 502.1 502.1 292.9
0.0 1673.6 0.0 1673.6 0.0 1673.6 35.3 836.8
[ system ] ; Name Protein and HA monomers in water [ molecules ] ; Compound Protein SOL DRG
#mols 1 1007 10
3. MDP FILE FORMAT title = protein-HA-water mdrun cpp = /usr/bin/cpp constraints = none integrator = md ; ENERGY MINIMIZATION OPTIONS = ; Force tolerance and initial step-size = ;emtol = 100 ;emstep = 0.01 ; Max number of iterations in relax_shells = ;niter = 20 ; Frequency of steepest descents steps when doing CG = ;nstcgsteep = 1000 dt = 0.002 ; ps ! nsteps = 10000000 ; total 20000 ps. nstcomm = 1 nstxout = 100000 nstvout = 100000 nstfout = 100000 nstxtcout = 100000 nstlog = 100000 nstenergy = 100000 nstlist = 10 ns_type = grid coulombtype = PME rlist = 1.0 rcoulomb = 1.0 rvdw = 1.0 DispCorr = EnerPres ; Berendsen temperature coupling is on in two groups Tcoupl = berendsen tc-grps = DRG SOL Protein tau_t = 0.1 0.1 0.1 ref_t = 298 298 298 ; Energy monitoring energygrps = DRG SOL Protein ; Isotropic pressure coupling is now on Pcoupl = berendsen Pcoupltype = isotropic tau_p = 1.0 1.0 1.0
116
; ; ; ;
; ; ; ;
imp imp imp imp
CAA CAA OAB CAP
CAP CAP CAP N2
CAP N2 CAQ C2
OAB N2 N2 HAG
CAA CAP CAZ N2
N2 HAG OAC C1
OAB C2 OAE C3
Texas Tech University, Amol Bhusari, May 2007 compressibility = 4.5e-5 4.5e-5 4.5e-5 ref_p = 1.0 1.0 1.0 ; Generate velocites is off at 250 K. gen_vel = yes gen_temp = 273 gen_seed = 173529
4. GRO FILE FORMAT (Title goes here) HA-protein-water 9204 1SER N 1 0.362 1.286 0.698 -0.7746 -0.3719 0.2722 1SER H1 2 0.295 1.276 0.767 1.9529 1.0563 -3.5016 1SER H2 3 0.457 1.289 0.745 0.3024 -1.0515 0.6906 1SER H3 4 0.355 1.368 0.643 1.6625 -0.3651 0.7359 .... .... 1595DRG HAD 9204 4.638 1.536 3.113 -0.0536 0.0723 1.1098 4.83354 4.83354 4.83354
117
Texas Tech University, Amol Bhusari, May 2007
PERMISSION TO COPY
In presenting this thesis in partial fulfillment of the requirements for a master’s degree at Texas Tech University, I agree that the Library and my major department shall make it freely available for research purposes. Permission to copy this thesis for scholarly purposes may be granted by the Director of the Library or my major professor. It is understood that any copying or publication of this thesis for financial gain shall not be allowed without my further written permission and that any user may be liable for copyright infringement.
Agree (Permission is granted.)
________________________________________________ Student Signature
________________ Date
Disagree (Permission is not granted.)
AMOL BHUSARI Student Signature
04/25/2007 Date