Sep 2, 2011 - predicting the life and performance of waste form during storage. ... predicting effective thermal conductivity for nuclear waste forms. .... LIST OF FIGURES .... and technological advancements in nuclear materials and design, ...
Computationally Efficient Upscaling Methodology for Predicting Thermal Conductivity of Nuclear Waste Forms
Prepared for U.S. Department of Energy Fuel Cycle R&D Program Dongsheng Li, Xin Sun and Mohammed Khaleel Pacific Northwest National Laboratory, Richland, WA 99352 September 2011 FCRD-MDSM-2011-000380 PNNL-20736
DISCLAIMER This information was prepared as an account of work sponsored by an agency of the U.S. Government. Neither the U.S. Government nor any agency thereof, nor any of their employees, makes any warranty, expressed or implied, or assumes any legal liability or responsibility for the accuracy, completeness, or usefulness, of any information, apparatus, product, or process disclosed, or represents that its use would not infringe privately owned rights. References herein to any specific commercial product, process, or service by trade name, trade mark, manufacturer, or otherwise, does not necessarily constitute or imply its endorsement, recommendation, or favoring by the U.S. Government or any agency thereof. The views and opinions of authors expressed herein do not necessarily state or reflect those of the U.S. Government or any agency thereof.
Computationally Efficient Upscaling Methodology for Nuclear Waste Forms September 2011
iii
Reviewed by:
Acting Director, Fuel Cycle Research and Development Robert Price
Date
Phillip Finck
Date
Paul Lisowski
Date
Concurred by: Director, Advanced Fuel Cycle Initiative Technical Integration Office
Approved by: Deputy Assistant Secretary, Fuel Cycle Management (AFCI Program Manager)
iv
Computationally Efficient Upscaling Methodology for Nuclear Waste Forms September 2011
SUMMARY This study evaluated the computational efficiency and accuracy of different upscaling methods used in predicting thermal conductivity in loaded nuclear waste forms, which are heterogeneous material systems. Thermal conductivity in loaded nuclear waste form is an important property specific to scientific researchers, involved in waste form integrated performance and safety code (IPSC). The effective thermal conductivity, obtained from microstructure information and local thermal conductivity of different components, is critical in predicting the life and performance of waste form during storage. Thermal conductivity is directly related to temperature increase during storage, which determines mechanical deformation behavior, corrosion resistance, and aging performance. Several methods, including the Taylor model, Sachs model, self-consistent model, and statistical upscaling method, were developed and implemented. Due to the absence of experimental data, finite element method (FEM) prediction results were used to determine the accuracy of the different upscaling methods. Micrographs from waste forms with varying waste loadings were used in the prediction of thermal conductivity. Prediction results demonstrated that in term of efficiency, boundary models (e.g., Taylor model and Sachs model) are better than the self-consistent model, statistical upscaling method, and finite element method. However, when balancing computational efficiency and accuracy, statistical upscaling is a useful method in predicting effective thermal conductivity for nuclear waste forms.
Computationally Efficient Upscaling Methodology for Nuclear Waste Forms September 2011
CONTENTS 1.
Introduction ................................................................................................................................ 1
2.
Thermal conductivity prediction using different upscaling methods ......................................... 3 2.1 Thermal conductivity prediction using boundary models .................................................. 3 2.2 Thermal conductivity prediction using self consistent method .......................................... 4 2.3 Thermal conductivity prediction using statistical upscaling method ................................. 5 2.3.1 Representation of Correlation Statistics .................................................................. 5 2.3.2 Statistical Continuum Model for Thermal Conductivity ......................................... 7 2.4 Thermal conductivity prediction using FEM ..................................................................... 9
3.
Results and discussion .............................................................................................................. 10
4.
Conclusions .............................................................................................................................. 16
Acknowledgements ........................................................................................................................... 17 References ......................................................................................................................................... 18
v
vi
Computationally Efficient Upscaling Methodology for Nuclear Waste Forms September 2011
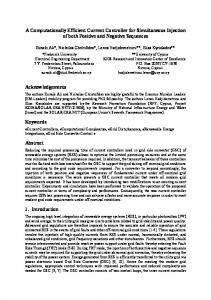
LIST OF FIGURES Figure 1 (a) Assumed microstructure for upper bound model (b) Assume d microstructure lower bound model ............................................................................................................................... 3 Figure 2 Assumed microstructure for self consistent method ............................................................. 4 Figure 3 Meshed microstructure used in finite element method. ........................................................ 8 Figure 4 Micrographs of simulated loaded waste glass form with (a) 5% (b) 10% (c) 15% (d) 25% (e) 35% nulcear waste load. .............................................................................................. 9 Figure 5 (a) Light micrograph of simulated nuclear waste glass form with 15% load. (b) Segmented binary image of loaded glass form. (c) Heat flux image and (d) temperature pattern of waste form when temperature gradient direction is horizontal. (e) Heat flux image of waste form with vertical temperature gradient direction. ..................................................... 11 Figure 6 (a) polar figure and (b) correlation function plot of waste form with 35% load. (c) polar figure and (d) correlation function plot of waste form with 10% load. .................................... 12 Figure 7. Predicted thermal conductivities of nuclear waste forms with different load and along different directions using different models ............................................................................... 13 Figure 8. Relative errors in predicting thermal conductivity using different models. Prediction results from FEM are used as references. ................................................................................. 14 Figure 9. Calculation time using different models in predicting thermal conductivity ................... 15
LIST OF TABLES Table 1. Thermal properties used in FEM simulation for loaded nuclear waste form. .................... 10
Computationally Efficient Upscaling Methodology for Nuclear Waste Forms September 2011
ACRONYMS FEM
finite element method
TPCF
two point correlation function
DOE
U.S. Department of Energy
PNNL
Pacific Northwest National Laboratory
R&D
research and development
NEAMS
Nuclear Energy Advanced Modeling and Simulation
IPSC
Integrated Performance Safety Code
vii
Computationally Efficient Upscaling Methodology for Nuclear Waste Forms September 2011
1
FUEL CYCLE RESEARCH AND DEVELOPMENT PROGRAM Computationally Efficient Upscaling Methodology for Predicting Thermal Conductivity of Nuclear Waste Forms 1. Introduction After several decades of stagnation, nuclear power is experiencing a revival [1-3]. In early 2008, 439 nuclear power reactors accounted for approximately 15% of electricity production worldwide. Currently, 35 new reactors in 13 countries are under construction; most on the continent of Asia. In February 2010, the U.S. Department of Energy (DOE) approved an $8.3 billion loan guarantee to build two new reactors in the state of Georgia [4]. If this project moves forward, these two new reactors would be the first in the United States since the 1970s. Labeling nuclear power as green energy was unimaginable in the 1960s. However, scientific and technological advancements in nuclear materials and design, especially in the areas of waste management and reactor design, have drastically changed public perception [1]. Compared with other energy sources, nuclear power is more dependable and better suited to meet rising electricity needs on a large scale. Another advantage of nuclear power is energy supply security; disruptions of supplies, geopolitical instability, and increasing prices have raised concerns in fuel import countries. Furthermore, nuclear power is crucial to achieving the carbon goal without generating green gas. The revival of nuclear power is still facing two challenges: safety and economics [2]. The disaster in Fukushima demonstrates the importance of safety to nuclear industry [5-6]. On the other side, this tragedy, attributable in part to an outdated design, may distract attention from a more serious safety problem: waste management. Nuclear radioactive waste generated by military and civil applications needs to be managed in a safe, regulated manner that takes the hazard and longevity of the radionuclides into consideration. To prevent release of radionuclides into the environment, nuclear waste is required to be processed or immobilized to confine and retain the radioactivity in the waste. The most popular waste immobilization method is to thermally convert the waste into a vitrified waste form. After immobilization, the waste form will be either freely stored or contained in a waste package. Whether or not a national disposal facility will exist in the future, radioactive waste must be properly immobilized to satisfy the basic requirement for waste conditioning, interim storage, and transportation. Due to the long term storage time expected, the waste form and waste package will experience significant degradation from irradiation and corrosion [7]. It is important to develop the capability to predict the evolution of the effective properties and performance of waste forms
2
Computationally Efficient Upscaling Methodology for Nuclear Waste Forms September 2011
during storage. Although a significant amount of thermal, mechanical, and physical properties measurement and leaching data of waste forms in the short term is available, it is still challenging to model and predict waste forms behavior over the long term. More research and development work is necessary to generate and interpret data on property prediction in waste forms. This prediction capability is necessary to guide the proper handling, planning, and design of a waste storage facility. To overcome the two barriers mentioned above, safety and economics, it is important to develop methodologies based on physical science to predict properties and evaluate performance of waste forms accurately and efficiently based on physical science. This methodology will support risk-informed and simulation-based decisions. Thermal conductivity, one of the properties important to performance of waste forms, is crucial in predicting performance and life [8]. Heat is generated from radioactive decay of radionuclides immobilized in waste forms. If thermal conductivity in the load waste form is low, trapped heat will create localized high temperature and dramatically affect performance. Devitrification, recrystallization, and increased diffusion at high temperatures will decrease the chemical durability of the waste form. In addition, thermally induced stress may initiate and propagate cracks and induce corrosion, leading to structural damage. Predicting thermal conductivity evolution is important in forecasting the life of waste forms. The same is true for cladding and other structural materials used in an irradiation environment [9]. While several sophisticated techniques have been developed to predict the thermal conductivity of waste forms, most current models do not consider the microstructure evolution under irradiation or anisotropy in a microstructure. The influence of molecular structure, lattice parameters, and conductive mechanisms has been investigated thoroughly, and several empirical and theoretical laws have been proposed. The influence of microstructure, however, has not been addressed in the modeling of thermal conductivity because traditional unloaded glass exhibits random microstructure and thus possesses isotropic properties. Such randomness, a hidden assumption in most current models, does not facilitate the prediction of thermal conductivity in waste forms with engineered microstructures, which can be designed with anisotropic properties and may ultimately be preferable. Generally, fabricated pure waste form packages are isotropic. However, loaded and irradiated waste forms usually do not retain the same random microstructure. Taking into consideration the anisotropy introduced during loading and after storage is crucial in property prediction and risk analysis. Balancing efficiency and accuracy is an interesting and universal topic in industry, science, and engineering. This study investigates different thermal conductivity prediction models to develop a strategy for efficient upscaling. The Taylor model, Sachs model, self-consistent model, statistical upscaling method, and finite element method (FEM) are developed, implemented and compared. Efficiency and accuracy in predicting thermal conductivity of loaded nuclear waste form is investigated.
Computationally Efficient Upscaling Methodology for Nuclear Waste Forms September 2011
3
2. Thermal Conductivity Prediction Using Different Upscaling Methods 2.1 Thermal Conductivity Prediction Using Boundary Models Rigorous upper and lower bounds on the thermal conductivity of a heterogeneous material system are based on variational principle and reciprocal variational principle, respectively [10]. For a heterogeneous material system composed by n phases, thermal conductivity in each phase i is assumed constant ki, determined by Eq. (1) and (2). Volume fraction of each phase is i. ∑
(1)
where 1 0
(2)
The upper bound of effective thermal conductivity follows variational principle ∑
(3)
The lower bound follows reciprocal variational principle ∑
(4)
When the upper bound is used, the microstructure of heterogeneous material is assumed as parallel-layered structure (Figure 1a). The direction of the force field, the temperature gradient, is parallel to the layer direction. When the lower bound is used, the microstructure is assumed as a series-layered structure (Figure 1b). Direction of the temperature gradient is perpendicular to the layer direction.
Thermal gradient
(a)
Thermal gradient
(b)
Figure 1. Assumed microstructure for (a) upper bound and (b) lower bound model
Computationally Efficient Upscaling Methodology for Nuclear Waste Forms September 2011
4
2.2 Thermal Conductivity Prediction Using the Self-Consistent Method In the self-consistent method, both phases in the materials system are assumed isotropic and homogeneous [11]. The thermal conductivity tensor in both phases is reduced to scalar values, ki, i=1,2. Each phase is assumed composed of identical inclusions randomly dispersed in statistically homogenous media. Volume fraction of each phase is vi. The assumed microstructure used in the self-consistent method is illustrated in Figure 2. Inclusion K(2) v(2)
Matrix K(1) v(1)
Figure 2. Assumed microstructure for self-consistent method T(X) is the temperature field and is continuous inside both phases and at the interfaces of inclusions and matrix. Temperature gradient Hi and heat flux vector qi are defined as (5) (6) Under the assumption of perfect thermal contacts between matrix and inclusion, continuity of both temperature and flux normal component is assumed at the interfaces. Under this so-called homogeneous boundary condition ·
(7)
·
(8)
where H0 and q0 are constant vectors. The effective thermal conductivity is (9) where the unknown
represents the average intensity.
Computationally Efficient Upscaling Methodology for Nuclear Waste Forms September 2011
5
This equation provides a formula for determining the effective thermal conductivity of a heterogeneous medium with statistical homogeneity. However, a deterministic approach solution requires exact calculation of position, orientation, and mutual interactions for each realization in order to solve Laplace’s equation. To solve this problem, an averaging method, such as Landauer’s scheme, must be applied [12]. This self-consistent method assumes that the actual average heat flux in the whole inclusion can be estimated by the heat flux inside a unique representative inclusion embedded in an infinite and homogeneous effective medium with unknown thermal conductivity. This effective medium is assumed representative of the surrounding of the inclusion inside the actual medium. Working on the previous assumption that the inclusions are identical and further assuming that the shape of the particles is spherical with symmetry along all directions, we have (10) The self-consistent method can be further modified and generalized based on the assumption of the shape of the inclusion [13-15]. For example, the shape of inclusions was expanded to ellipse, coated sphere, or cylinder stick. A universal assumption in these approaches is the random distribution of identical inclusions in a homogeneous medium.
2.3 Thermal Conductivity Prediction Using the Statistical Upscaling Method 2.3.1
Representation of Correlation Statistics
For a random heterogeneous medium, microstructure is characterized by arbitrarily sampling a sufficiently large number of vectors [16-17]. Correlation statistics is the probability function of phases where heads and tails of vectors are located. For example, in a loaded nuclear waste form, P12(r) represents the possibility of sampled vectors with head in phase 1 (nuclear waste) and tail in phase 2 (glass matrix). Due to the internal dependency, the 4 correlation functions, Pij(r) (i,j=1,2), in a loaded waste form may be represented by only one correlation function, P11(r), which may be further simplified to P(r). To reduce the space needed to store the microstructure information, this function of vector length and orientation is represented by weights of layered spherical harmonics expansions [18]. Treated as a function of a vector r with orientation rˆ and magnitude r, the statistical correlation function can be expanded in orientation using spherical harmonics and in magnitude using Fourier expansion. From the composition of the variable vector, the probability
P(r) can be expanded into:
l l P(r ) P(rrˆ) R r k rˆ
0 0
(11)
Computationally Efficient Upscaling Methodology for Nuclear Waste Forms September 2011
6
where k rˆ is the spherical harmonics of orientation rˆ
k rˆ k ,
2l 1 l m! Pm cos eim 4
(l m)!
l
(12) m where Pl is the Legendre function.
In Eq. (11) R r is the coefficient of the expansion as a function of the magnitude r. Further expanding these coefficients by Fourier expansion
T
R r C t mt r
t 1
(13)
where C l are the coefficients of basis function mt (r) . Substituting Eq. (13) back to Eq. (11) l l T Pr Ct mt r k rˆ
0 0 t 1
(14)
This expansion satisfies the requirement of the orthogonal function
m (r )m t
t
( r ) tt
(15)
and
(16)
The set of weights C t v are used to represent the probability function P (r ) and further microstructure, just as the spherical harmonics weights of crystal orientation distribution function are used to represent texture in one-point functions. The last step is to obtain the weight C t v .
Multiplying both sides of Eq. (16) with
, leaves
Computationally Efficient Upscaling Methodology for Nuclear Waste Forms September 2011
7
(17) or (18) Spherical harmonics expansion is a spherical version of the Fourier expansion. Using this kind of representation will give a more precise description of microstructure than other analytical functional representations. The symmetric characteristics in the microstructure may be taken into consideration in the spherical harmonics expansion. The required term number will be decreased dramatically when symmetry is considered, making this representation method more efficient. 2.3.2
Statistical Upscaling Method for Thermal Conductivity
For calculating thermal behavior of the system, we assumed a steady state and no heat generated in the nuclear glass waste form [19-20]. This is a significant simplification relative to the in-service behavior of loaded nuclear waste; thus, this approach is appropriate for determining the effective thermal conductivities of composite materials. To calculate life expectancy and performance of waste forms, heat generation should be considered. A temperature gradient due to heat generation should be expected in the waste form. The effective thermal conductivity of a waste form predicted using this model should be calibrated under different temperatures in the working environment. A heterogeneous medium is assumed to be composed of n constituents with different conductivities, mi, i 1 n and partitions vi. The local heat flux q and local temperature gradient T at any arbitrary point x satisfy a linear relationship such that q x k x T ( x )
where k(x) is the local thermal conductivity. heterogeneous medium, keff, is then defined as
(19)
The effective thermal conductivity in the
q( x) keff T ( x)
(20)
where denotes the ensemble average. To obtain keff, one first defines the relationship between the localized conductivity k(x) and the ensemble average of the thermal conductivity, k0,
~
by introducing the polarized conductivity k ( x) such that
Computationally Efficient Upscaling Methodology for Nuclear Waste Forms September 2011
8
~ k ( x) k 0 k ( x)
(21)
If the polarized field P(x) is defined as
~ P( x) k ( x)T ( x)
(22)
q(x) k0T(x) P(x)
(23)
then
With this simplification, the heat flux is divergence free,
q(x) 0 k0 T (x) P(x)
(24)
k0 T P(x)
(25)
which simplifies to
Equation (25) can be solved using a number of techniques, including Green’s function, which results in a solution T ( x ) T0 ( x ) dx ' g ( x, x ' ) P ( x ' )
g ( x, x' )
1
1 4 0 x x'
(26) (27)
where T0 is the reference temperature. To obtain the temperature gradient field, Eq. (24) is differentiated ~ T ( x ) T0 dxG ( x x ' ) * k ( x ' ) T ( x)
(28)
where T0 is the applied temperature gradient. Here, a numerical routine is described to perform the integration over the Green’s function for an ensemble of aggregates in a heterogeneous medium. Because of the existence of a singular point in the integral at x=x, a spherical region around the singular point must be excluded. Using integration by parts and the divergence theorem, the Green’s function G(x-x) is expressed as G ( x x' ) D ( x x' ) H ( x x' )
(29)
Computationally Efficient Upscaling Methodology for Nuclear Waste Forms September 2011
D where
1 3 0
H
I and
9
3nˆnˆ I 4 0 r 3 1
(30)
where I is the second order identity tensor and nˆ is the unit vector of x-x. Substituting Eq. (22) into Eq. (28) and using a Taylor series expansion by taking into account only the first-order correction results in T ( x ) T0 dxG ( x x ' ) * ~ (T0 , h( x ' ))T0
(31)
The average field for state h can be calculated from the above equation T ( x)
h
~ T0 d x G ( x x ' ) * k ( T0 , h ( x ' ))
The correlation function k~ ( T0 , h ( x ' ))
h
T0
(32)
can be described in terms of the conditional twoh
point probability density function of state h
~ ~ k (T0 , h( x' )) f r ' h(r ' ) r hk (T0 , h( x' ))dh(r ' ) h
where the conditional two-point correlation function f r' h(r' ) r h
(33)
is defined as the
probability of occurrence of r at state h(r) given that r belongs to state h
f r' h j r hi Pij / Vi
(34)
2.4 Thermal Conductivity Prediction Using FEM Microstructure-based FEM can be used to predict effective thermal conductivity. A micrograph with enough features is used as the representative volume element (RVE). After image processing, each pixel in the micrograph is identified with phase assignment. The segmented image is fine-meshed as demonstrated in Figure 3.
Figure 3. Meshed microstructure used in FEM
10
Computationally Efficient Upscaling Methodology for Nuclear Waste Forms September 2011
FEM is then used to compute the heat flux inside the representative structure. The computation of effective thermal conductivity of composites containing inclusions with complex shapes is possible using FEM. The other assumption used in the self-consistent method, such as the identical inclusion, is also removed. The physical properties of the two components, glass and nuclear waste are listed in Table 1 below: Table 1. Thermal properties used in FEM simulation for loaded nuclear waste form. Properties Thermal conductivity W/m°C (20°C) Density (103kg/m3) Specific heat J/g°C
Glass 1.14 2.23 750
Waste 30 7.5 70
3. Results and Discussion Sintering of high-level waste into a glass matrix via powder technology was utilized in the waste immobilization. In principle, waste composition should influence processing conditions and product performance only to a minor extent. Hot pressing of high-level waste glass mixtures does not lead to solid solutions of waste oxide in glass. Figure 4 shows a light micrograph of loaded simulated nuclear glass waste form with different volume fractions of nuclear waste load [21]. Most waste elements demonstrated in the light graphs are encapsulated between glass particles, yet some elements will diffuse into the glass matrix, revealed by Energydispersive X-ray spectroscopy (EDX) mapping. The small white spots reflect mainly waste component particles distributed in gray glass matrix.
Computationally Efficient Upscaling Methodology for Nuclear Waste Forms September 2011
11
Figure 4. Micrographs of simulated loaded waste glass form with (a) 5%, (b) 10%, (c) 15%, (d) 25%, and (e) 35% nuclear waste loads The micrographs were segmented to assign the phases of glass matrix and loaded nuclear waste components. Figure 5a is an observed light micrograph of simulated loaded waste form with 15% volume fraction of waste. After segmentation, the binary image with black glass matrix and white waste is shown in Figure 5b. After meshing the binary image and assigning the property of each phase using Table 1, FEM was performed to predict the thermal properties of the loaded waste form. When the temperature gradient is loaded along the horizontal direction, the temperature pattern and heat flux images are shown in Figures 5c and 5d, respectively. The boundary condition is to keep the left boundary at a constant 50C and the right boundary at 0C. Similarly, Figure 5e and 5f show the temperature pattern and heat flux image when the temperature gradient direction is along the vertical direction. Anisotropy is observed from the temperature pattern and heat flux image. The effective thermal conductivity is calculated from the heat flux image.
(a)
(b)
(c)
(d)
(e)
(f)
12
Computationally Efficient Upscaling Methodology for Nuclear Waste Forms September 2011
Figure 5. (a) Light micrograph of simulated nuclear waste glass form with 15% load. (b) Segmented binary image of loaded glass form. (c) Heat flux image and (d) temperature pattern of waste form when temperature gradient direction is horizontal. (e) Heat flux image and (f) temperature pattern of waste form when temperature gradient direction is vertical. All the micrographs shown in Figure 4 were segmented, meshed, and analyzed using FEM to predict the effective thermal conductivities along vertical and horizontal directions. Because there are no both measured effective thermal conductivity and micrograph data available in the literature for loaded nuclear glass forms, the predicted results from FEM were used as a reference in studying the accuracy of the prediction model. To predict thermal conductivity using statistical upscaling, the microstructure of a loaded waste form is represented by the correlation function. A polar plot is used to present the correlation function for a waste form with 35% load. The polar plot is a useful visualization tool for comparing the two point correlation function (TPCF) in all directions for two-dimensional microstructures. The radius of the polar plots shown is 50 pixels, corresponding to 750 µm. The radial distance is the length of the vector sampled, while the azimuthal angle stands for the orientation of the vector. The color scale in the intensity bar corresponds to the probability in the TPCF. Figure 6a demonstrates that the characterization length in the glass form is approximately 5 pixels, corresponding to 75µm. To clearly demonstrate the anisotropy of the micrograph, Figure 6b demonstrates the probability function p11, with head and tail both in the waste phase, along different directions: horizontal (0), diagonal (45) and vertical (90). When the vector length is zero, the two point correlation function reduces to one point function, volume fraction of waste phase at 0.35. With the increase of vector length, the two point correlation functions regress to the square of volume fraction of the waste form at 0.12. It is clear from Figure 6(b) that the correlation function along the horizontal direction (0) regresses more slowly than that along the diagonal direction (45), and more slowly than that along the vertical direction (90). Figures 6c and 6d demonstrate the correlation function of a waste form with 10% load. It is clear that the waste form with a 10% load is more isotropic than the waste form with a 35% load. The regression speeds of the correlation function along different directions are similar. The difference of anisotropy in these two waste forms is smaller, difficult to observe with the naked eye. However, this subtle difference is caught by the correlation function. Anisotropy observed from the correlation function is reflected in the properties predicted by FEM and statistical upscaling. Figure 7 illustrates the predicted thermal conductivity from different models. Boundary models and the self-consistent model cannot capture the anisotropy, due to the assumption of random microstructure. Self-consistent method assumes symmetry of inclusion. Anisotropy is only captured by FEM and statistical upscaling. Furthermore, the anisotropy of waste form increases with a higher load volume fraction. This increase is reflected in the larger anisotropy of thermal conductivity successfully predicted by both FEM and statistical upscaling.
Computationally Efficient Upscaling Methodology for Nuclear Waste Forms September 2011
13
0.35
0.30
0 45 90
p11
0.25
0.20
0.15
0.10 0
100
200
300
400
500
600
700
800
600
700
r (um)
(a)
(b)
0.10
0.08
0 45 90
p11
0.06
0.04
0.02
0.00 0
100
200
300
400
500
r (um)
(c)
(d)
Figure 6. (a) Polar figure and (b) correlation function plot of waste form with 35% load. (c) Polar figure and (d) correlation function plot of waste form with 10% load.
Computationally Efficient Upscaling Methodology for Nuclear Waste Forms September 2011
14
12.00
Taylor Sachs
thermal conductivity (W/mK)
10.00
self‐consistent FEM x
8.00
statistical x FEM y
6.00
statistical y
4.00 2.00 0.00 5%
10%
15%
20%
25%
30%
35%
volume fraction of nuclear waste load
Figure 7. Predicted thermal conductivities of nuclear waste forms with different loads and along different directions using different models To study the accuracy of different models in predicting thermal conductivity, prediction results from FEM are used as reference. For models with assumption of random microstructure, the mean of the predicted thermal conductivity along different directions from FEM is used as reference. For the statistical upscaling method, error is defined as the relative difference of the predicted thermal conductivity along different directions between FEM and statistical upscaling. The relative errors in predicting thermal conductivity from different models are illustrated in Figure 8. The error from boundary models and the self-consistent model are around 40%, while the error from statistical upscaling is around 5%.
Computationally Efficient Upscaling Methodology for Nuclear Waste Forms September 2011
15
Relative Error in predicting thermal conductivity using different upscaling methods
0.8 0.7
relative error
0.6 0.5 Taylor
0.4
Sachs 0.3
self‐consistent statistical x
0.2
statistical y
0.1 0 5%
10%
15%
20%
25%
30%
35%
Volume fraction of loaded nuclear waste
Figure 8. Relative errors in predicting thermal conductivity using different models. Prediction results from FEM are used as references. It is evident that the accuracy in using statistical upscaling is high. Because no assumption is used to represent the statistical distribution of constituents in the heterogeneous medium, the application of the statistical upscaling method to the prediction of thermal conductivity covers a broad range of materials systems over a broad range of temperatures, assuming that the thermal conductivities of the individual constituents are known. In addition, this method generates prediction results much faster than FEM. The prediction result is more precise than the Taylor model, Sachs model, and the self-consistent method because it is based on statistical information about the microstructure and does not make assumptions in configuration, morphology, or component shape. The expense of high accuracy is computation time. The calculation times of using different models are illustrated in Figure 9. Generally, the boundary model and self-consistent model will take less than 1 second since the solutions are analytical. Prediction using statistical upscaling for a representative 256 256 pixel image takes approximately 1 minute. FEM takes between 1 and 2 hours using a desktop computer with a 2.53 GHz Intel Core 2 Duo central processing unit. FEM is affordable when small images are used (i.e., 256256). However, if the heterogeneity of the material system is high, a large RVE would be needed to include enough features to keep statistical stability. The exponentially increased calculation time in such a scenario would make FEM prohibitive. In that case, statistical upscaling would be the best choice.
16
Computationally Efficient Upscaling Methodology for Nuclear Waste Forms September 2011
Generally, when the microstructure is random and the components are symmetric and distributed uniformly, the boundary models and self-consistent model are a good choice. Only volume fraction and thermal conductivity of each phase are needed to predict effective thermal conductivity. The component shape, distribution, and configuration are simplified to reach an analytical solution. If heterogeneity should be considered and the RVE is small, FEM is a good candidate to predict thermal conductivity. If the heterogeneity is high and RVE is large, statistical upscaling is a computationally efficient method in predicting thermal conductivity with satisfactory accuracy. FEM
4.0 3.5
log(calculation time)
3.0 2.5
statistical upscaling
2.0 1.5 1.0 0.5 0.0
Boundary self consistent
-0.5 -1.0
Figure 9. Calculation time using different models in predicting thermal conductivity
4. Conclusions Different models were used to predict effective thermal conductivity of loaded glass waste forms. Computational efficiency and accuracy were compared. The Taylor model, Sachs model, self-consistent model, statistical upscaling model, and microstructure-based FEM were developed and implemented. Due to the absence of experimental data, prediction results from microstructure-based FEM were referenced to determine the accuracy of different models. Micrographs of simulated waste forms with different loadings of nuclear waste were used to predict thermal conductivity. Prediction results demonstrated that in terms of efficiency, boundary models (Taylor model and Sachs model) and the self-consistent model (less than 1 second) are faster than the statistical upscaling method (around 1 minute) and FEM (around 1 hour). However, the statistical upscaling method (with an error rate around 5%) is more accurate than the boundary models and self-consistent model (with error around 40%). Balancing computational resource consumption and accuracy, statistical upscaling is the most computationally efficient method in predicting effective thermal conductivity for nuclear waste forms.
Computationally Efficient Upscaling Methodology for Nuclear Waste Forms September 2011
17
Acknowledgements This work was funded by DOE’s Nuclear Energy Advanced Modeling and Simulation (NEAMS) program. Pacific Northwest National Laboratory is operated by Battelle for the DOE under contract DE-AC05-76RL01830.
Computationally Efficient Upscaling Methodology for Nuclear Waste Forms September 2011
18
References [1]
Abu-Khader MM. 2009. "Recent Advances in Nuclear Power: A Review." Progress in Nuclear Energy 51:225-235.
[2]
Greenhalgh C and AR Azapagic. 2009. "Review of Drivers and Barriers for Nuclear Power in the UK." Environmental Science & Policy 12:1052-1067.
[3]
Rogers KA. 2009. "Fire in the Hole: A Review of National Spent Nuclear Fuel Disposal Policy." Progress in Nuclear Energy 51:281-289.
[4]
Culley MR, E Ogley-Oliver, AD Carton, and JC Street. 2010. "Media Framing of Proposed Nuclear Reactors: An Analysis of Print Media." Journal of Community & Applied Social Psychology 20:497-512.
[5]
Clery D. 2011. "Current Designs Address Safety Problems in Fukushima Reactors." Science 331:1506.
[6]
Cooper M. 2011. "The implications of Fukushima: The US perspective." Bulletin of the Atomic Scientists 67:8.
[7]
Berlin RE, CC Stanton, and J Wiley. 1991. "Radioactive waste management." J. ENVIRON. QUAL 20.
[8]
Weber, WJ., A Navrotsky, S. Stefanovsky, ER Vance, and E Vernaz. 2009. Materials science of high-level nuclear waste immobilization. MRS Bulletin, 34(1), 46-53.
[9]
Allen T, H Burlet, RK Nanstad, M Samaras, and S Ukai. 2009. "Advanced Structural Materials and Cladding." Mrs Bulletin 34:20.
[10] Van Eekelen H. 1973. "The Random-Spheres Model for Porous Materials." Journal of Catalysis 29:75-82. [11] Hashin Z and S Shtrikman. 1962. "A variational approach to the theory of the effective magnetic permeability of multiphase materials." Journal of Applied Physics, 33:3125-3131. [12] Decarlis A, M Jaeger, and R Martin. 2000. "Determination of the Effective Thermal Conductivity Tensor of Heterogeneous Media Using a Self-Consistent Finite Element Method: Application to the Pseudo-Percolation Thresholds of Mixtures Containing Nonspherical Inclusions." Journal of Heat Transfer 122:171-175. [13] Lee YM, RB Yang, and SS Gau. 2006. "A Generalized Self-Consistent Method for Calculation of Effective Thermal Conductivity of Composites with Interfacial Contact Conductance." International Communications in Heat and Mass Transfer 33:142-150.
Computationally Efficient Upscaling Methodology for Nuclear Waste Forms September 2011
19
[14] Essam J, CM Place, and EH Sondheimer. 1974. "Selfconsistent calculation of the conductivity in a disordered branching network." Journal of Physics C: Solid State Physics 7:L258-L260. [15] Kumar S, N Pimparkar, JY Murthy, and MA Alam. 2011. "Self-consistent electrothermal analysis of nanotube network transistors." Journal of Applied Physics 109:014315. [16] Torquato S and H Haslach, Jr. 2002, "Random Heterogeneous Materials: Microstructure and Macroscopic Properties." in Applied Mechanics Reviews, Vol 55, pp. B62-B63. [17] Donev A, S Torquato, and FH Stillinger. 2005. "Pair Correlation Function Characteristics of Nearly Jammed Disordered and Ordered Hard-Sphere Packings." Physical Review E 71:011105. [18] Li DS, M Khaleel, X Sun, and H Garmestani. 2010. "Representation of correlation statistics functions in heterogeneous materials using layered fast spherical harmonics expansion." Computational Materials Science 48:133. [19] Li D, G Saheli, M Khaleel, and H Garmestani. 2006. "Quantitative prediction of effective conductivity in anisotropic heterogeneous media using two-point correlation functions." Computational Materials Science 38:45. [20] Li D, H Garmestani, and J Schwartz. 2009. "Modeling thermal conductivity in UO2 with BeO additions as a function of microstructure." Journal of Nuclear Materials 392:22. [21] Lutze W and RC Ewing. "Radioactive waste forms for the future." 1988.