header for SPIE use
Holographic Microantenna Array Metrology * E. N. Grossman†, A. Luukanen**, A.J. Miller Quantum Electrical Metrology Division, National Institute of Standards and Technology, Boulder, CO ABSTRACT We describe a holographic or “phaseless” technique for measurement of complex antenna patterns that is particularly suited to planar antennas at very high frequencies – mm-wave thru long-wave infrared – where phase coherent detection is impractical. It has been implemented in a compact automated antenna range, and validated on a previously reported planar slot-ring antenna at 95 GHz. In the IR, the interferometric technique must be refined in order to reduce to acceptable levels the uncertainties due to positioning and alignment errors. This measurement of the complex antenna pattern is the most problematic part of a full accounting for the optical coupling efficiency “budget” in a microantenna-coupled, imaging sensor array. Keywords: Microantenna, millimeter-wave, imaging, array, terahertz
1. INTRODUCTION Considerable effort is presently being invested in development of focal plane arrays (FPA’s) of millimeter-wave (mmw) and THz antenna-coupled detectors[1]. Dual-band mmw and infrared (IR) antenna-coupled FPA’s are also the subject of intense development[2]. The most difficult quantity to measure in such arrays is the pixel-by-pixel aperture efficiency η ij (ap). This is a complex vector overlap integral between the far-field pattern of the antenna and the target field. For a system focused at infinity, the target field is simply a plane wave (whose direction corresponds to the pixel location) truncated by the entrance aperture and propagated to the exit aperture (facing the FPA). For a system focused at a target plane at finite distance, the target field is a spherical wave emitted by a point source (whose position corresponds to the pixel location), again truncated by the entrance aperture and propagated to the exit aperture. In either case, quantitative prediction and optimization of η ij (ap) requires knowledge of the complex antenna pattern – amplitude and phase -- of each FPA element. However, only intensity patterns are typically measured[3, 4]. On the other hand, full complex pattern measurement is well developed for microwave antennas, mostly for optimization of large reflectors, and extension of those techniques to THz frequencies has been recently analyzed from a theoretical and numerical standpoint[5]. This paper addresses the problem of full complex antenna pattern measurement for monolithic mm-wave, THz, and IR FPA’s. The antennas in these FPA’s are feed antennas, generally planar and lithographically defined. They typically have relatively low gain. The detectors are integrated at the antenna feedpoints. It is impractical to bring a coherent mmw signal into or out from the antenna feedpoints on a transmission line to a connector, as would commonly be done at microwave frequency. Over the entire mmw to IR frequency range, there are thus two key requirements on any antenna metrology technique: (1) the antenna under test (AUT) must be measured in reception, not transmission, since the few coherent sources that exist cannot easily be coupled to the feedpoints of the AUT, (b) only power measurement is available, since direct phase measuring instruments are unavailable. Indeed, the power meter must be the detector integrated at the feed of the AUT.
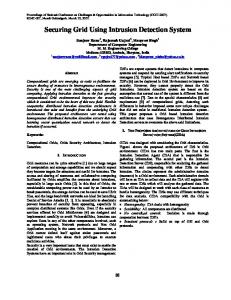
A number of techniques for measurement of amplitude and phase patterns of microwave antennas are illustrated in fig. 1. To date, the measurement of amplitude patterns only (fig. 1A) has been almost universal in development of mm-wave to IR antennas. In this case the response of an antenna-coupled detector to an incident plane wave (either a direct detector, e.g. bolometer, or heterodyne receiver may be used) is measured as the antenna-under-test (AUT) is rotated. On the other hand, the conventional techniques for measurement of phase patterns[6] on microwave antennas are illustrated in figs 1F and 1G. These involve the use of a phase-sensitive receiver to monitor the phase *
Contribution of the U.S. Government. Not subject to copyright.
[email protected]; tel (303) 497-5102 ** on leave from VTT Information Technology, Espoo, Finland †
Fig. 1. Comparison of several antenna measurement techniques. (A) amplitude-only, the method conventionally applied to mmw/THz/IR antenna-coupled detectors. (B) “phaseless” differential technique originally described in ref. 1 and implemented in the present work. (C-F) various other techniques commonly employed at microwave frequencies as described in the text. WPS indicates a Wilkinson power splitter. difference between the illuminating source (radiated through the AUT) and a probe antenna which is rotated about the AUT (1F) , or between the AUT and a fixed probe antenna while both are illuminated with a plane wave and the AUT is rotated (1G). The chief difficulty with extending either technique to higher frequency is the need to pass the high frequency signal through movable cables or a rotary joint without introducing spurious angle-dependent phase delays. Moreover, both require that the high frequency signal be coupled off the FPA into a phase-sensitive receiver, and are therefore unsuitable for the monolithic antenna-coupled detector arrays in question. The first phase pattern measurement on any mmw antenna[7], (a corrugated horn), used the technique illustrated in fig. 1C. In this case the use of heterodyne downconversion enabled a direct measurement of phase difference between two probe antennas’ response to the wave radiated by the AUT. This phase difference provided the derivative of the AUT’s phase pattern, as the AUT was rotated in the plane containing the two probe antennas and the AUT. The technique is “differential” in that sense. This technique avoids the issue of unstable phase delays in rotary joints and cables, and is therefore extensible to mmw and higher frequencies. The AUT is operated in transmission rather than reception, however, so the technique is not suitable for antenna-coupled detector arrays. The same difficulty is associated with the technique in fig. 1E, in which direct phase measurement is replaced by splitting of the two probe antennas’ responses and a measurement of three powers[8]. The phase difference of the original signals is derived from the measured powers by straightforward phasor arithmetic. Finally, in the technique illustrated in fig. 1B, the roles of transmitter and receiver are reversed; the rotatable AUT is operated in reception and two phase-coherent beams are transmitted onto it[9]. By measuring response to each beam alone and then to the coherent sum of the two beams, the phase difference between the signals generated in the AUT can again be derived by simple phasor arithmetic. This phase difference is again a measurement of the
derivative of the AUT’s phase pattern in the plane defined by the two probe antennas and the AUT. Techniques 1B and 1E are holographic in the sense that only intensity measurements are performed (see [7] for a good discussion of the distinction between holography and phase-and-amplitude measurements in the context of antenna metrology.) In summary, only technique 1B is suitable for measurement of phase patterns on microantenna-coupled detector arrays, because of the twin requirements that the AUT be operated in reception and that only power (not phase) be measured. The technique is perfectly applicable to IR or optical antenna measurements, and is in fact nothing but a mmw version of the classic Young’s experiment in optics. This view of the measurement is useful when considering the effects of various positioning errors, since the AUT’s rotation must leave it confined within the area of a single fringe of the pattern generated by the two sources. The antenna’s phase pattern manifests itself in the overall coupling efficiency between the detector and the target. How important an effect does it have ? This can only be answered quantitatively by specializing to a particular case, so Fig. 2 illustrates the calculated aperture efficiency for such a representative hypothetical case. An antenna is hypothesized, whose beam has a Gaussian amplitude dependence on polar angle θ , with half-width to the 1/e point of θ 0 , and a quadratic dependence of phase on θ , reaching a value of 180o at θ π . It is assumed to be illuminated by a perfect spherical wavefront, truncated at the exit aperture at half-angle θ t . The normalized overlap integral of the two waves is then the aperture efficiency, assuming perfectly aberration-free optics (or alternatively, it is the aperture efficiency referred to the exit aperture). Negligible variation in the phase pattern of the antenna, the situation that is implicitly assumed when an intensity-only pattern is measured, is represented by the
θ0 = 0 limit. θπ
In this limit, optimum aperture efficiency is achieved when θ t ≈ θ 0 , a situation referred to as (amplitude) patternmatching. As one would intuitively expect, the aperture efficiency rolls off rapidly when the strength of the phase dependence approaches that of the amplitude, i.e.
θ0 ~ 1. θπ
Ripples in the efficiency rolloff reflect integer or half-
integer numbers of “phase-wraps” of the phase pattern within the main (amplitude) beam. The crossing of the various traces represents an interesting and potentially useful effect, namely that for antennas with significant phase variation in their patterns (i.e.
θ0 ~1 θπ
or greater), the efficiency may be improved by reducing θ t , i.e. by stopping
down the exit aperture. The authors have observed just this effect in practical situations of coupling IR and mmw antennas to single-mode sources, but since aberrations in the optical system produce the same effect, it is impossible in practical systems to assign it to the antenna or to the optics, without independent knowledge of the antenna’s phase pattern.
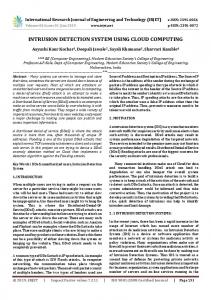
2. MM-WAVE/THZ/INFRARED MICROANTENNA RANGE This technique has been implemented in a compact (tabletop), dual-band (mmw and IR) antenna range illustrated in fig.3, which is drawn to scale. A set of Gunn oscillators optimized for broad tuning range[10] provides the source power. The four focusing elements (polyethylene lenses AB, BC, and DG, and elliptical mirror E) are designed using classical Gaussian beam techniques[11], so as to produce two Gaussian beams with equally sized waists located at positions C and D, both directed at the AUT but with axes separated by 5o. They are configured as a pair of Gaussian beam telescopes in order to produce matched waistsizes over a broad bandwidth of 75-230 GHz. The polarizing beamsplitter at C is a grid fabricated on 25 µm thick kapton with 100 µm wide Cu lines and spaces. With the source polarization vertical, the PBS is oriented at +45o and the polarizations of the reflected beam (“path C”) and transmitted beam (“path D”) are parallel and 45o from vertical when incident on grids J and K. The latter are oriented to transmit the component that is co-polarized with the AUT. The mirrors at L and M provide a crosspolarized channel, but are ordinarily not used, since the antenna-coupled detectors tested to date are very highly linearly polarized. The AUT is mounted on an elevation-over-azimuth gimbal stage. The irradiance at the AUT plane is approx. 1 µW/mm2.
The measurement protocol simply consists of measuring the detector signal as a function of azimuth when the AUT is illuminated with each beam individually, and then with both. The phase difference is derived simply from
P − PC − PD cosψ = H 2 PC PD
(1)
PH is the power measured in the hologram, and PC , D are the powers measured from each individual beam. It is not necessary that the powers in the two beams be precisely balanced, though in our present setup they are typically equal to within ~20%.
Fig. 2 Rolloff in the aperture efficiency, as the antenna’s phase variation with angle becomes stronger, for various sizes of exit aperture, for the representative case described in the text. a. Infrared channel If the AUT translates at the same time it rotates, then a spurious variation in the measured phase difference will be introduced as the AUT moves through the fixed fringe pattern. Such a translation arises from imperfect alignment of the AUT and the center of rotation . The fringe period is simply d = λ cot α , where λ is the wavelength and α the angular separation of the two beams, as shown in fig. 2. The (worst-case) tolerance on the alignment, in order to keep the variation in PH below say 10%, is then
(10%)d 2π
~ 0.2λ . At mmw frequencies this can be readily
achieved with careful mechanical design, and verified by optically monitoring the precise location of the AUT during its rotation. At IR wavelengths however, this is impractical, and an alternate measurement protocol must be employed. Since the fringe pattern is known to be fixed in space, it can itself be used to determine the precise location of the AUT at each angle. At each azimuth value, the entire gimbal-mounted AUT is translated horizontally and the signal measured, producing a fringe pattern. At different azimuth values, the fringe pattern will appear to be shifted horizontally due to the varying phase response of the antenna with azimuth. The positioning of the AUT (in angle and horizontal position) then only needs to be reproducible, not absolutely settable, to within the above tolerance.
b. 2-dimension pattern The antenna’s phase pattern is in general a function of both angular variables, but the differential technique used here only measures the pattern’s gradient in the plane given by the separation of the two beams (i.e. in azimuth for our setup.) A full 2D scan in elevation and azimuth therefore does not recover all the information. In order to recover it, the polarization of the incident fields and the AUT must be rotated 90o, and the same measurement protocol repeated.
Fig. 3. Optical layout of holographic microantenna range (to scale). PBS indicates a polrizing beamsplitter.
3. VALIDATION MEASUREMENTS Figure 4 shows data taken on a slotring-coupled bolometer at 95 GHz. This antenna-coupled bolometer has been extensively developed by us[12] and employed in a 2-dimensional, 120-element staring array[13]; the results have appeared elsewhere. The particular unit tested is part of an 8-element linear array and uses a micromachined airbridge to provide thermal isolation for the bolometer. The bolometer is DC biased, while the source is electrically chopped at 1 kHz, through its bias. The amplitude patterns are offset from one another, as expected, by the angular separation of the two paths, C-H and D-H (see fig. 3). The phase difference at broadside is adjusted to be 90o by translating mirror G. As mentioned in [9], this is the optimum operating point, since at 90o, the variation in intensity (of the hologram) with phase difference is maximized. The most important bug in the system at present is stray reflections, which are manifested in very sharp features that appear in the response as function of angle or position (several are visible in fig.4.) The random variations in the data are presently dominated by source power stability, which we expect to be much improved with a waveguide-mounted PIN modulator, and are some three orders of magnitude higher than any limit due to detector sensitivity. Use of bolometric, as opposed to heterodyne, detection for antenna metrology, has sometimes been criticized on the grounds of dynamic range, but the present measurements show that dynamic range >50 dB is certainly achievable with the sensitive detectors of greatest interest in current development efforts. o Fits to the intensity response shown in Fig.4 indicate a value of θ 0 ≈ 22 ; a fit to the phase dependence indicates
θ π ≈ 35 o .
Although the applicability of the calculated results shown in Fig. 2 is limited, since the Gaussian and
quadratic dependences assumed in deriving them are only first-order approximations to the real antenna pattern, it is still useful to examine these results for their implications regarding aperture efficiency. The value of
θ 0 θ π ≈ 0.6 derived from the fits to experiment, implies (by reference to Fig. 2) that the maximum achievable aperture efficiency is ~84%, versus the ~89% that would be achievable in the absence of phase variation in the antenna pattern. (This is achieved at a significantly stopped-down aperture however, θ t θ 0 ~ 0.75 , rather than the pattern-matched value of
θ t θ 0 ~ 1 .)
Thus, for this particular antenna, the effect on coupling efficiency is
relatively minor.
4.
CONCLUSION
We have implemented a holographic technique for measurement of antenna phase patterns, originally introduced and applied in ref. 9 to a scalar feedhorn, and applied it to an antenna-coupled mmw bolometer array. The technique is the only one, to our knowledge, that is applicable to antenna-coupled detectors from mmw to IR frequencies, where phase-sensitive detection off chip is impossible, and the AUT must be tested in reception with intensity measurements only. These measurements provide the basis for quantitative comparison of measured and predicted aperture efficiencies on mmw to IR, antenna-coupled, detector arrays, which are currently under development by several laboratories. This work was supported by the MIATA program of DARPA. The authors are grateful to several of the other MIATA participants, particularly David Wikner of the Army Research Lab, for helpful discussions.
Fig. 4. Phase pattern measured on a slotring-coupled bolometer at 95 GHz, along with amplitude patterns (on log scale) from the responses to individual beams.
5. REFERENCES 1. 2. 3. 4.
Stickley, C.M., Filipkowski, M., Microantenna Arrays: Technology and Applications; MIATA an Overview. Proc. 1st Eurpoean Symposium on Optics and Photonics in Security and Defence, 2004. Gonzales, S.J., Porter, J.L., Boreman, G.D., Antenna-coupled Infrared Detectors. Proc. SPIE, 2004. 5406: p. 863-871. Rebeiz, G.M., Millimeter-Wave and Terahertz Integrated-Circuit Antennas. Proc. of the IEEE, 1992. 80(11): p. 1748-1760. Rutledge, D.B., Neikirk, D. P., and Kasilingham, D. P., Integrated Circuit Antennas, K.J. Button, Editor. 1983, Academic Press: New York. p. 1-90.
5.
Junkin, G., T. Huang, and J.C. Bennett, Holographic Testing of Terahertz Antennas. IEEE Trans. Ant. and Prop., 2000. 48(3): p. 409-417. 6. ANSI/IEEE, IEEE Standard Test Procedures for Antennas, IEEE Std 149-1979. 1979, IEEE: New York. 7. Tuovinen, J., Lehto, A., Raisanen, A., Phase Measurements of Millimetre Wave Antenna at 105-190 GHz with a Novel Differential Phase Method. IEE Proceedings, 1991. 138(2): p. 114-120. 8. Lehto, A., Tuovinen, J., Boric, O., Raisanen, A., Accurate Millimeter Wave Antenna Phase Pattern Measurements using the Differential Phase Method with 3 Power Meters. IEEE Trans. Ant. and Prop., 1992. 40(7): p. 851-853. 9. Mallat, J., Lehto, A., Tuovinen, J., Antenna Phase Pattern Measurements at Millimeter Frequencies using the Differential Phase Method with only One Power Meter. Intl. J of Infrared and Millimeter Waves, 1994. 15(9): p. 1497-1506. 10. Carlstrom, J.E., Plambeck, R.L., Thornton, D.D., A Continuously Tunable 65-115 GHz Gunn Oscillator. IEEE Trans. Microwave Theory and Techniques, 1985. MTT-33(7): p. 610-619. 11. Goldsmith, P.F., Quaisoptical Systems. 1998, New York: IEEE Press. 412. 12. Miller, A.J., Luukanen, A., Grossman, E.N., Micromachined antenna-coupled uncooled microbolometers for terahertz imaging arrays. Proc. SPIE, 2004. 5401. 13. Luukanen, A., Miller, A.J., Grossman, E.N., Active millimeter-wave video rate imaging with a staring 120-element microbolometer array. Proc. SPIE, 2004. 5401.