Monitoring the health of power transformer is important for the reliability of
electrical ... frequency response as a diagnostic tool to detect winding
deformation and.
International Journal of Electrical Engineering. ISSN 0974-2158 Volume 4, Number 2 (2011), pp. 199-207 © International Research Publication House http://www.irphouse.com
Condition Assessment of Power Transformers by Swift Frequency Response Analysis Abdul Azeem, Amit Kumar Yadav and Hasmat Malik Research Scholars Department of Electrical Engineering N.I.T., Hamirpur, H.P., India
Abstract Monitoring the health of power transformer is important for the reliability of electrical power supply. Conventional tests carried out on power transformers can only detect damage of permanent nature. Frequency Response Analysis (FRA) is found to be a useful tool for reliable detection of incipient mechanical fault in a transformer. There are various methods of evaluating the frequency spectrum to confirm the presence of an incipient fault. This paper aims to present the signature of single phase autotransformer 33MVA based on FRA data using signal processing techniques, taking into consideration the recommended frequency range specified by Doble Engineering Company. Thus, it is found that the proposed technique is very efficient and effective in analyzing and detecting accurately the type of mechanical fault existing in a power transformer. This paper presents technical details regarding Sweep Frequency Response Analysis (SFRA) and the role it plays in transformer test and maintenance. SFRA is an electrical test that provides information relating to transformer mechanical integrity. This paper details the use of sweep frequency response as a diagnostic tool to detect winding deformation and core displacement in power transformers. Practical case studies are presented that demonstrates the effectiveness of this technique. Index Terms: Power Transformer, Case Study, Frequency Response Analysis (FRA).
Introduction The loss of mechanical integrity in the form of winding deformation and core displacement in power transformers can be attributed to the large electromechanical
200
Abdul Azeem et al
forces due to fault currents, winding shrinkage causing the release of the clamping pressure and during transformer transportation and relocation. These winding deformation and core displacement if not detected early will typically manifest into a dielectric or thermal fault[1]. This type of fault is irreversible with the only remedy been rewinding of the phase or a complete replacement of the transformer. It is therefore imperative to check the mechanical integrity of aging transformers periodically and particularly after a short circuit event to provide early warning of impending failure. Hence an early warning detection technique of such a phenomena is essential. Frequency response analysis is recognized, as been the most sensitive diagnostic tool to detect even minor winding movement and core displacement [2]. Sweep Frequency Response Analysis (SFRA) is a tool that can give an indication of core or winding movement in transformers. This is done by performing a measurement, albeit a simple one, looking at how well a transformer winding transmits a low voltage signal that varies in frequency. Just how well a transformer does this is related to its impedance, the capacitive and inductive elements of which are intimately related to the physical construction of the transformer. Changes in frequency response as measured by SFRA techniques may indicate a physical change inside the transformer, the cause of which then needs to be identified and investigated.
Power Transformers and Mechanical Integrity Power transformers are specified to withstand the mechanical forces arising from both shipping and subsequent in-service events, such as faults and lightning. Transportation damage can occur if the clamping and restraints are inadequate; such damage may lead to core and winding movement. The most severe in-service forces arise from system faults, and may be either axial or radial in nature. If the forces are excessive, radial buckling or axial deformation can occur. With a core form design the principal forces are radially directed, whereas in a shell form unit they are axially directed, and this difference is likely to influence the types of damage found. Once a transformer has been damaged, even if only slightly, the ability to withstand further incidents or short circuits is reduced. There is clearly a need to effectively identify such damage. A visual inspection is costly and does not always produce the desired results or conclusion. During a field inspection, the oil has to be drained and confined space entry rules apply. Since so little of the winding is visible, often little damage is seen other than displaced support blocks. Often, a complete tear down is required to identify the problem. An alternative method is to implement fielddiagnostic techniques that are capable of detecting damage, such as SFRA [3]. There is a direct relationship between the geometric configuration of the winding and core within a transformer and the distributed network of resistances, inductances, and capacitances that make it up [5]. This RLC network can be identified by its frequency dependent transfer function. Changes in the geometric configuration alter the impedance network, and in turn alter the transfer function. Changes in the transfer function will reveal a wide range of failure modes. SFRA allows detection of changes in the transfer function of individual windings within transformers and consequently indicate movement or distortion in core and windings of the transformer [7].
Condition Assessment of Power Transformers
201
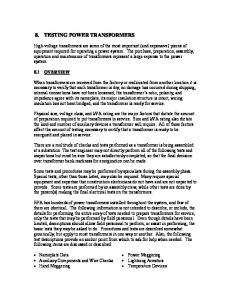
Measurement Procedure SFRA is a very easy measurement to perform. The transformer should be prepared as it would for a standard Doble power factor and capacitance test. The SFRA test requires a 3-lead approach, with the leads providing signal, reference and test. This approach means that the signal put into the test winding is measured to provide a reference which is then compared with the signal which emerges at the far end of the winding and is measured by the test lead. The three lead approaches reduce the effect of the test set on the test results – making the measurement robust, repeatable and reliable. To make the test leads easy to apply in the M5100, the signal and reference leads meet at a single connector clip; the test lead is connected by a similar clip. The clips are color coded to make application simple – red for signal and reference, black for test. Each test lead comes with a cable shield ground that needs to be connected to the transformer at the base of test bushings.
Figure 1.1: Typical Test Connections.
Measurements on Different Winding Types Most people immediately think of winding measurements as being only associated with the high-voltage and the low-voltage windings. When considering SFRA measurements, winding measurements realistically consist of five categories and not just two. The winding categories are high-voltage, low-voltage, inter, series, and common. Short circuit measurements made on one winding while short circuiting another winding are a variation on interwinding measurements. It should be noted that inter-winding measurement is not a true winding measurement, but rather the transfer impedance between two windings. The series and common winding measurements describe the SFRA application as it is applied to auto transformers. Regardless, certain expectations can be made for each. These measurement types produce some predictable characteristics and properties. Understanding these properties will minimize testing error and may help identify problems. The following expectations exist for each of the following categories. High-Voltage Winding High-voltage winding measurements have greatest attenuation as compared to low
202
Abdul Azeem et al
voltage and tertiary windings. Most traces start between –30 dB and –50 dB and are initially inductive. High-voltage windings are much larger in overall size, which contributes to greater complexity in its distributive network. High-voltage winding measurements generally produce steeper resonances and more of them as compared to its low-voltage counterpart. Low-Voltage Winding Low-voltage winding measurements have least attenuation as compared to the other categories. Most traces start between –5 dB and –15 dB and are also initially inductive. This characteristic is due to the low impedance property of the high current side of the transformer. The first peak after the core resonance generally approaches – 5 dB to 0 dB and is concave and smooth. As compared to the high-voltage winding response, the low voltage winding fewer fluctuations and is slight smoother. Inter-Winding Inter-winding measurements always start with high attenuation, between –60 dB and –90 dB, and are capacitive. If electrostatic interference is present, it will show up at 60 Hz and at the associated harmonics of 60 Hz during this measurement. Series and Common Winding The series and common winding measurements are grouped together because of their similarities. These measurements are associated with auto transformer. The naturally low turns ratio of an auto transformer cause the series and common measurements to be similar. However, if an LTC is present on either winding, the similarities will be somewhat affected by the tap windings.
Test Issues and Precautions As with any electrical test, issues, such as cables, grounding, noise, and interference must be given serious considerations. We are testing in harsh mechanical and electrical environments and the test instrument is designed to be extremely sensitive. Unlike power factor testing, SFRA test methods cannot cancel noise or interference from the measurement, as they are an inherent part of the measurement being made. Being able to coexist with such issues will help increase the quality and interpretation of the measured results. The Doble M5100 is designed to do just that. Test Lead Effects 50 Ohm impedance matched test leads are used. Either a RG58 or RG238/U RF coaxial cable with the shields grounded to the instrument chassis can be used. The RG58 is a much smaller cable; it is less durable, but easier to handle. The RG238/U is much harder to handle, especially in cold weather. It should be appreciated that the SFRA measurement requires a matched impedance signal cable, and performs a single-ended measurement, i.e., the signal with respect to the instrument ground.
Condition Assessment of Power Transformers
203
Thus, the shield of the signal cable must be connected to the chassis via RF BCN connectors. Practical field experience indicates the leads may be 60 ft. in length, with shield grounds being at least 8 ft. long. This length has been selected as being the shortest to test the largest transformers from a location on the ground adjacent to the unit. Nevertheless, it is the lead length that determines the maximum effective frequency. At lengths of 60 ft., the cable approximates the wavelengths of the higher measurement frequencies, and there is probably little to be gained from the 2-10 MHz scan. As long as the cable is less than ¼ of a wavelength in length, then the short cable approximation can be used. At lengths greater than ¼ of a wavelength, phasing effects start to occur. It turns out that at 60 ft., the frequency cutoff with respect to wavelength is approximately 2 MHz Grounding Earlier experience has shown that grounding the lead ends to the bushings is not always effective. If this technique is used, it is required that the bushing flange be solidly grounded to the transformer tank. Often, a small impedance is present. Also, the ground clamp must solidly bite into the bushing flange. Any paint or contamination on this surface can affect the measurement. Good test procedures offset this possible problem. Noise and Interference Due to the sensitive nature of a SFRA instrument, interference cannot be avoided. The test set is immune to interference, but the test object – a transformer winding, will pick up any interference present with a broadband less than 10 MHz. Interference, such as mechanical vibration, power line pick-up (50 Hz and 60 Hz), and RF (AM/FM broadcasts), are usually present during testing. They are most noticeable when the measured output signal is attenuated. By using a sweep approach, noise contamination is limited to just those frequencies where it is present. An impulse approach allows the noise to contaminate the whole frequency range, compromising the measurement.
Trace Comparisons Trace comparison is the primary method for the analysis of SFRA results. Comparisons can be made against the baselines and previous data, sister unit results, and phases. Assuming the test equipment provides repeatable results, the initial expectation is that any data comparison should result in near prefect overlays. Our database indicates that various levels of expected comparison exist. The level of expected comparison may be categorized by the following: Baseline Data Baseline or pervious data should be repeatable. If internal movement or change does not occur within test specimen, the matched traces should overlay well. Match traces
204
Abdul Azeem et al
are defined as SFRA results obtained from the same point of contact. An example would be two scans collected from the same winding, such as H1-H3, on different test dates. Data is collected before and after transformer relocation is expected to overlay well. Any variance is such comparisons indicate a problem. One exception is caused by the magnetic circuit and the state of the remnant magnetism occurs at low frequencies and should be overlooked. Sister Units Sister unit results are also expected to compare well. Our database of sister units shows very little difference between matched scans. All tests on sister units were conducted with the LTC and DETC in the same position. If the results are magnified small offsets can be noticed, but for the most part they are similar.
Case Study SFRA Results:-single-phase step-up Autotransformer 26.67/33 MVA having current in HV winding 262.4Aand current in LV winding 437.39A and frequency 50 HZ. The Guaranteed Load Losses 67 KW and Guaranteed No Load Losses 13.5 KW.
Figure 1: Signature Spectrum of Autotransformer when measurement is taken between high voltage winding and low voltage winding.
Condition Assessment of Power Transformers
205
Figure 2: Signature Spectrum of Autotransformer when measurement is taken between neutral and low voltage winding with neutral short circuited.
Figure 3: Signature Spectrum of Autotransformer when measurement is taken between high voltage winding and neutral with tertiary short circuited.
Figure 4: Signature Spectrum of Autotransformer when measurement is taken between low voltage winding and neutral with tertiary short circuited.
206
Abdul Azeem et al
Figure 5: Signature Spectrum of Autotransformer when measurement is taken between low voltage winding and neutral.
Figure 6: Signature Spectrum of Autotransformer when measurement is taken between tertiary windings.
Conclusion Every transformer winding has a unique signature that is sensitive to changes in the parameters of the winding, namely resistance, inductance, and capacitance. Frequency spectrum of a transformer is very sensitive to any deformation or displacement of the winding. Frequency response analysis is a very effective tool for diagnosing transformer condition. It is particularly useful in detecting any fault that is due to mechanical damage to the winding. The technique is also very reliable for detecting any short circuit to the winding. Results from a measurement can be analyzed through several techniques via graphical presentation. However, reference is needed for better interpretation. The reference can either be from historical data of the same transformer or from sister transformers. In many cases, historical data for transformers already in operation is difficult to get owing to shutdown requirement. Sister transformers are used in those
Condition Assessment of Power Transformers
207
cases as the reference measurement. The interpretation of the results is meanwhile a great help in determining further action to be taken especially for suspected transformers. FRA can be a very effective tool for condition monitoring. It can avoid catastrophic failure in transformers and also help maintenance engineer to estimate time and cost for repairing the transformer after the fault before undertaking maintenance.
References [1] Norris E. T.: “Mechanical Strength of Power Transformers in Service”, Proc. of IEE, Vol. 104, Part A, pp. 289-306, 1952. [2] Dick E. P.: “Transformer diagnostic testing by frequency response analysis”, IEEE Trans. on PAS, Vol. PAS 97, 1978. [3] Lech W.: ”Detecting transformer winding damage”, Electrical Review, Vol 179, pp. 768, 1966. [4] AI-Khayat N.: “Transformer Simulation Models”, PhD Thesis, Nottingham Trent University, Nottingham, U.K.,1994. [5] Abetti P. A. and Magimiss F. J.: ”Natural frequencies of coils and windings determined by equivalent circuit”, Trans. of AIEE, Vol. 72, pp 495-504, 1953. [6] Abetti P. A.: “Correlation of forced and fiee oscillations of coil and windings”, Trans. of AEE, pp~ 986-96, 1959. [7] Degeneff R. C.: “A general method for determining resonances in transformer windings”, IEE Trans. on PAS, Vol. PAS-96, No. 2, pp. 423, 1977. [8] Popovic Lj. M.: “General equations of the line represented by discrete parameters, Part I - steady state”, IEEE Trans. on Power Delivery, Vol. 6, No. 1, pp. 295, 1991. [9] Wilcox D. J. and Hurely W. G.: “Transient analysis of three phase transformer windings”, UPEC, Belfast University, 1989.