Constrained nonlinear predictive control for maximizing production in polymerization processes ?
Mazen Alamir a , Nida Sheibat-Othman b , Sami Othman b , a
Laboratoire d’Automatique de Grenoble (LAG). CNRS-UMR5528. BP 46, Domaine Universitaire, 38400 Saint Martin d’H`eres. France
b
Laboratoire d’Automatique et de G´enie des Proc´ed´es (LAGEP) Bˆ at. 308G 43, Bd du 11 Nov. 1918 69622 Villeurbanne Cedex, France.
Abstract In this paper, a new constrained nonlinear predictive control scheme is proposed for maximizing the production in polymerization processes. The key features of the proposed feedback strategy are its ability to rigorously handle the process constraints (input saturation, maximum allowed heat production, maximal temperature values and rate of change) as well as its real time implementability due to the low dimensional control parametrization being used. Simulations are proposed to show the efficiency of the proposed feedback as well as its robustness to model uncertainties.The controller performance is also validated experimentally on a laboratory scale reactor to control the emulsion polymerization of styrene. Key words: Emulsion polymerization; Nonlinear predictive control; Constrained control; maximal production.
1
? This paper was not presented at any IFAC meeting. Corresponding author Nida Sheibat-Othman, Bˆ at. 308G 43, Bd du
Introduction
Optimizing the process productivity is of great interest in emulsion polymerizations. Being rapid, exothermic
11 Nov. 1918 69622 Villeurbanne Cedex T´el. : 04.72.43.18.50 Fax: 04.72.43.16.99 e-mail:
[email protected] Email addresses:
[email protected] (Mazen
and sensitive to impurities, these processes may cause a runaway reaction and require therefore to be online
Alamir),
[email protected] (Nida
monitored and controlled in order to ensure the process
Sheibat-Othman),
[email protected] (Sami Othman).
security and minimize the process time.
17 March 2006
In emulsion polymerization, the reaction rate is related
sition rate of the initiator and the propagation rate of
to the reaction temperature and to the concentrations
monomer. Araujo and Giudici [1] used an iterative dy-
of monomer and radicals in the polymer particles . The
namic programming technique to minimize the reaction
concentration of monomer in the polymer particles is
time and control the polymer composition by manip-
proportional to the reaction rate. Controlling this pa-
ulating both the jacket temperature and the monomer
rameter can be done by manipulating the feed rate of
flow rate.
monomer. On the contrary, the relation between the concentration of radicals in the polymer particles and the
Sheibat-Othman et al. [12] used input/output linearizing
initiator feed is not always evident. Therefore, the ini-
control to maximize the heat produced by the reaction
tiator feed rate cannot be used to control the reaction
in emulsion polymerization by manipulating both the
rate. In contrast, the reaction temperature has a direct
jacket temperature and the monomer flow rate. However,
influence on the reaction rate. Gentric et al. [6] and [7]
the process constraints were not taken into account in
used the input/output linearization and optimization of
the controller. In this work, the nonlinear receding hori-
the reactor temperature in order to minimize the process
zon control, which is known to be efficient for controlling
time and to control the polymer molecular weight.
multivariables constrained nonlinear systems (Mayne et al. [9], Astorga Zaragoza [14]), is used to maximize the
Controlling the production rate was studied in several process productivity. The monomer flow rate and the papers (Arzamendi and Asua [2], Gloor and Warner [8], jacket temperature are manipulated in order to do that. Buruaga et al. [3], Sayer et al. [11], Zeaiter et al. [15] The process constraints, due to physical limitations such and Vicente et al. [13], Sheibat-Othman et al. [10]). In as the maximum admissible heat or the maximum possome of these works, the polymer properties, such as sible flow rate are explicitly taken into account in the polymer molecular weight distribution and/or composicontrol scheme. tion were controlled simultaneously by manipulating the feed rates of monomer(s) and chain transfer agent. In all Since the reaction is exothermic, the calorimetry is used these cases, the reaction temperature was maintained at to estimate the heat produced by the reaction. This gives a fixed value. an estimate of the reaction rate. The number of moles For a better control of the process productivity, the reac-
of free monomer in the reactor and the concentration of
tion temperature profile should be optimized as well as
radicals in the polymer particles can therefore be esti-
the concentration of monomer in the polymer particles.
mated [10]. Based on this information, the controller is
Actually, the reaction temperature affects the decompo-
applied to control the heat produced by the reaction.
2
The paper is organized as follows. First, the system
Where N T (mole) is the total number of moles of
model is described and the control problem is formulated
monomer introduced to the reactor. N (mole) is
in section 2. The principle of receding horizon control is
the number of residual monomer. F (mole/s) is the
briefly recalled in section 3 together with the particular
monomer input flow rate. Rp (mole/s) is the rate of
formulation adopted in the present paper. In particu-
transformation of monomer into polymer. T (o ) is the
lar, the control parameterization and the definition of a
reactor temperature. Tj (o) is the jacket temperature.
modified cost function that takes into account the state
V (cm3 ) is the total volume of the reaction.
constraints handling are described. Then, some validat-
The reaction rate Rp (N T , N, T, V ) is a state function
ing simulations are proposed in order to assess the im-
that is given by
plementability, the efficiency and the robustness properRp = µ · V · kp0 e−EA/(RT ) · M (N T , N )
ties of the proposed feedback law. Finally, the strategy
(5)
is validated experimentally in a 3 litres reactor during
where µ is the concentration of radicals in the monomer
the polymerization of styrene .
particles, M is the concentration of monomer in the polymer particles. This latter concentration is given by :
2
Problem formulation M (N, N T ) =
In order to properly state the problem under consideration, the system dynamic model is first described, then the control objective and the associated operational con-
Γ(N T , N ) := The system model
Γ(N T , N ) ≥ 0
if
(6) ³ M Wm
´
N N T −N ρp
otherwise
+ ρN m
i 1 − φpp h M Wm T M Wm N− (N − N ) ≥ 0 p ρm φp ρm
where the following notations have been used
A simplified model of emulsion polymerization process
M Wm molecular weight of monomer
is given by the following four dimensional ODE’s N˙ T = F
(1−φp p )ρm M Wm
where
straints are detailed.
2.1
ρm , ρp monomer and polymer densities EA the activation energy of monomer
(1)
R universal gas constant
N˙ = F − Rp (N T , N, T, V ) (2) h i 1 T˙ = (−∆H)Rp + U A(Tj − T ) + Qf eed (3) ρm C p V M Wm F V˙ = (4) ρm
kp0 pre-exponential factor ∆H reaction enthalpy U heat transfer coefficient
3
A heat transfer area between the jacket and the reactor
T (see for example [5]). This enables Rp (·) to be known
Cp heat capacity of the reaction medium
and hence used to estimate N by integrating equation
Qf eed heat exchanged with the entering components
(2)[10]. This scheme leads to measurements that can be
(W)
acquired once each 10 s. It should be mentioned how-
φpp volume fraction of polymer in the polymer particles
ever that the calorimetry presents some difficulties such as the estimation of the variable heat transfer coefficient
Note that the first two equations (1)-(2) express the
between the reactor and the jacket. For this reason, the
mass balances of N T and N . Equation (3) is the heat
measurement of the process state can be noisy or de-
transfer balance between the reactor and the jacket
layed. This consists one of the difficulties of applying
while the last equation (4) represents the evolution of
the controller. Adjustment of the unknown parameters
the reaction volume due to the flow input.
(heat transfer coefficient, heat loss) might be necessary online.
Note that equations (1)-(4) give the nonlinear state space model of the polymerization reactor with the state
µ is also a variable parameter but is not considered as
(x) and the control vector (u) being defined as follows:
a state of the system and is not therefore taken into ac-
à x :=
!
count in x. This is due to the fact that µ is not modelled
NT N T V ∈ R Ã ! u :=
F Tj
4
here since it is sensitive to impurities and its model includes several other nonmeasurable states. µ is not mea-
∈ R2
sured but can be estimated online from the other measurements [10]. This consists another difficulty for the
2.2
State measurement
controller and should be kept in mind while interpreting the results.
In the remainder of this paper, the state represented above is assumed to be completely known. This is effec-
2.3
The operational constraints
tively possible according to the following scheme: The volume V and the state variable N T are computed by in-
Assume that the reaction duration is tf . In order to
tegrating (4) and (1) given the input profile F (·) that can
properly express the control objective, the operational
be measured using a balance or a flowmeter. The heat
constraints have to be clearly stated. A part of these
produced at some instant t, namely QR (t) = (−∆H) ·
constraints is concerned by the capacities of the pump
Rp (t) is computed by calorimetry using the heat bal-
and of the thermostated bath and another part is con-
ance and the measurement of the reaction temperature
cerned by the operating conditions ensuring an optimal
4
reaction. These are the following :
3
(1) The maximal admissible flow rate :
The proposed control scheme
Since a receding horizon control scheme is adopted in the present paper, let us first of all recall the basic features
F (τ ) ∈ [0, Fmax ] ;
∀τ ∈ [0, tf ]
underlying this principle.
(2) The admissible range for the jacket temperature : 3.1 Tj (τ ) ∈
[Tjmin , Tjmax ]
;
Summary of receding horizon control
∀τ ∈ [0, tf ] Receding horizon control scheme, also called predictive
(3) The maximal rate of variation of the control input
control, is now a widely established solution to control
Tj (due to thermal inertia)
problems where optimal choices have to be made and where constraints are to be seriously handled. It is also
|T˙j | ≤ T˙jmax
a natural choice as soon as coupled multi-variable com(4) The maximal allowed heat production : QR (τ ) := (−∆H) · Rp (τ ) ≤ Qmax R
2.4
;
plex nonlinear systems are considered. ∀τ ∈ [0, tf ]
For a complete survey of this area, reader may consult the excellent paper [9] and the references therein. Here,
The control objective
only the very basic principle of receding horizon control The control objective is to maximize the quantity of
is recalled in order to properly introduce the proposed
polymer produced during the reaction interval [0, tf ]
solution to the problem at hand.
while respecting the operational constraints (1)-(5) deConsider a nonlinear system given by
fined in section 2.3. This is the same as minimizing the process time for a constant quantity of monomer to con-
x˙ = f (x, u)
sume and also the same as maximizing the monomer conversion which is usually considered in industrial ap-
where x is the state and u is the vector of control inputs.
plications. This can be formally written as follows:
max
F (·),Tj (·)
(7)
Assume that the control objective is expressed in terms
h i N T (tf ) − N (tf ) under (1)-(4) of section 2.3
of an optimization problem P (x0 , Tp ), namely
P (x0 , Tp )
This objective has to be satisfied by a feedback design
:
min J(x0 , u(·), Tp ) under
in order to be robust against model uncertainties.
u(·)∈U
5
σ(x0 , u(·), Tp ) ≤ 0
where Tp > 0 is the prediction horizon, U is some subset
optimization problem that may be difficult to solve in a
of admissible control profiles and σ(·) ≤ 0 is a compact
reasonable time.
expression of the operational constraints. In the following section, the particular parametrizaThe receding horizon control strategy amounts to solve
tion used to define the control profiles F (·) and Tj (·) is
at each decision instant t the optimal control problem
presented.
P (x(t), Tp (t)) yielding the following optimal solutions 3.2
The control parametrization
u ˆ(·, x(t)) The control parametrization used in the present paper where u ˆ(·, x(t)) is the optimal control profile defined on
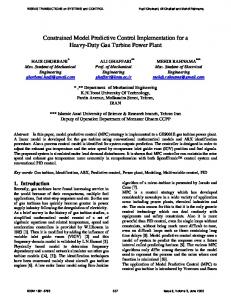
for the control inputs Tj and F are depicted on Fig. 1
the time interval [t, t + Tp (t)] and to apply the first por-
and Fig. 2 respectively. More precisely, the admissible
tion of the optimal profile over [t, t + dt]. At the next
profiles for Tj over some time interval [0, tf ] are given
decision instant t + dt, the new optimal control problem
by the following three dimensional parametrization with
P (x(t + dt), Tp (t + dt)) is solved yielding the optimal
the parameter vector given by (w1 , w2 , t1 ) :
solutions Tj (t) =
u ˆ(·, x(t + dt))
T max SatTjmin j
w1
and the first portion of u ˆ(·, x(t + dt)) is applied over w(t) :=
[t + dt, t + 2dt]. The procedure is then repeated indefinitely for classical systems or until the end of the batch
w2
Z
³
´
t
Tj (0) +
w(τ )dτ
(8)
0
if
t < t1
t1 ∈ [0, tf ] (9)
if
t ∈ [t1 , tf ]
where w1 and w2 are restricted to [−T˙jmax , T˙jmax ] in
operation for batch reactors.
order to meet the constraint (3) of section 2.3 while the Now P (x(t), Tp (t)) is rigorously an infinite dimensional
constraint (2) is structurally imposed by the use of the
optimization problem since u(·) needs an infinite num-
saturation function in equation (8).
ber of degrees of freedom to be completely defined. That is the reason why a finite dimensional parametriza-
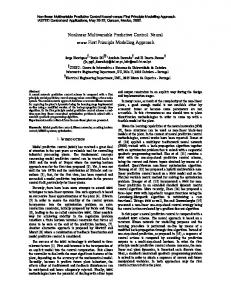
The parametrization of the input flow rate F over a
tion of the open loop profiles used in the definition of
time interval [0, tf ] is given by (see Fig. 2) :
P (x, Tp ) is needed. The family of piece wise constant
F (t) = F (0) + (F f − F (0))[1 − e−λt ]
control profiles given some sampling period τs > 0 is a
(10)
conceptually easy way to achieve this objective, how-
this is a scalar parametrization with the only parameter
ever, this choice may lead to a rather high dimensional
F f ∈ [0, Fmax ] enabling the constraint (1) of section 2.3
6
dimensional parameter vector
w1 /T˙jmax w2 /T˙jmax ∈ P := [−1, 1]2 × [0, 1]2 p := t1 /tf f F /Fmax
Fig. 1. Parametrization of the control input Tj (·) over a time
(11)
interval [0, tf ]. This parametrization is used in the definition of the receding horizon control formulation. Tj (·) is defined
This control parametrization structurally leads to the
by three parameters: the two slopes w1 and w2 that have
satisfaction of the operational constraints (1)-(3) of sec-
to belong to the admissible range [−T˙jmax , T˙jmax ] and the
tion 2.3. The satisfaction of the remaining constraint (4)
switching time t1 ∈ [0, tf ].
of section 2.3 is guaranteed by a suitable modification of the cost function. This is explained in the following section.
to be structurally satisfied.
In the remainder of this paper, the control profile Tj (·) and F (·) associated to a particular choices of tf and p ∈ P are denoted as follows
Tj (·, p, tf ) ;
3.3
F (·, p, tf )
The modified cost function
Fig. 2. Parametrization of the control input F (·) over a time interval [0, tf ]. This parametrization is used in the definition
Assume that the reaction takes place during Tbatch units
of the receding horizon control formulation. F (·) is defined
of time. Assume some instant t ∈ [0, Tbatch ]. The predic-
by one parameter, namely its asymptotic value F f .
tion horizon at that instant is then given by :
Tp (t) = Tbatch − t
(12)
To summarize, the control input parametrization is de-
Each choice of the control parametrization p ∈ P re-
fined over a time interval [0, tf ] by the following four
sults in the following two open-loop control profiles over
7
[t, Tbatch ], This comes from the fact that if p1 is an admissible Tj (·, p, Tp (t)) ;
F (·, p, Tp (t))
(13)
parametrization that meets the constraint, then one has
The modified cost function at instant t is given by : " J(p, t) = 1 − "
´ ³ 1 QR (τ, p) − Qmax R max 0, sup ε Qmax τ ∈[t,Tbatch ] R #
× N (Tbatch , p) − N T (Tbatch , p)
J(p1 , t) = N (Tbatch , p1 ) − N T (Tbatch , p1 ) < 0
#
(16)
(such p1 exists by assumption). This is because for such p1 , one has
(14)
QR (τ, p1 ) − Qmax R ≤0 Qmax τ ∈[t,Tbatch ] R sup
where QR (·, p), N (·, p) and N T (·, p) are the predicted values given the initial state x(t) and the control profiles
and therefore
(13) that would be used on [t, Tbatch ]. ε > 0 is a small
³ max 0,
parameter.
´ QR (τ, p1 ) − Qmax R =0 Qmax τ ∈[t,Tbatch ] R sup
Now let p∗ be a solution that violates the constraint by The relevance of the cost function (14) is shown by the
more than ε%, this means that
following result :
QR (τ, p∗ ) − Qmax R >ε Qmax τ ∈[t,Tbatch ] R sup
Proposition 1 Provided that there exist admissible and hence
control profiles over [t, Tbatch ] that lead to the satisfaction of constraint QR (τ ) ≤ Qmax over [t, Tbatch ], a parameter R
1−
³ ´ 1 QR (τ, p∗ ) − Qmax R max 0, sup ≤0 max ε QR τ ∈[t,Tbatch ]
(17)
vector pˆ(x(t), Tp (t)) that minimizes J(p, t) leads to state and since N (Tbatch , p∗ ) − N T (Tbatch , p∗ ) < 0, equation
trajectories satisfying
(17) implies that QR (τ ) ≤ (1 + ε)Qmax R
(15)
J(p∗ , t) ≥ 0 > J(p1 , t)
for all τ ∈ [t, Tbatch ]
which indicates that p∗ is not an optimal solution as soon
In other words, proposition 1 states that whenever there
as it violates the constraint by more than ε%. This ends
are solutions that respect the constraint (4) of section
the proof.
2.3, the modified cost function (14) leads to trajectories
3.4
♦
The receding horizon feedback
that do not violate this constraint by more than ε%. Let τs > 0 be some sampling period for control. The Proof
instants (kτs )k≥0 becomes the decision instants where
8
the optimization problems P (x(kτs ), Tp (kτs )) are solved Parameter
Value
Unit
Cp
1714
(J/Kg/K)
UA
6
(J/K/s)
Tf eed
25
(K)
ρm
0.904
(kg/cm3 )
φpp
0.4
–
kp0
1.05 × 10¹⁰
(cm3 /mol/s)
EA
2.9544 × 10⁴
(J/mol)
(−∆H)
71060
(J/mol)
CP f eed
1714
(J/Kg/K)
M Wm
104.15
(g/mol)
ρp
1.04
(kg/cm3 )
Np
1017
–
n ¯
0.5
–
F max
10−3
(mol/s)
in order to update the control inputs to apply to the system on [kτs , (k + 1)τs ]. More precisely, let pˆ(kτs ) be given by : pˆ(kτs ) := Arg
min J(p, kτs )
(18)
p∈P
the receding horizon control scheme amounts to apply the following control over the sampling period [kτs , (k + 1)τs ] : Tj (kτs + τ ) := Tj (τ, pˆ(kτs ), Tp (kτs ))
∀τ ∈ [0, τs ] (19)
F (kτs + τ ) := F (τ, pˆ(kτs ), Tp (kτs ))
∀τ ∈ [0, τs ]
(20)
where Tp (t) is given by (12).
4
Simulation results
In this section, simulation of the closed loop system’s performance under the proposed constrained receding horizon control are proposed to assess the efficiency and the robustness of the proposed feedback controller. Two sets of simulations are proposed illustrating the behavior under nominal conditions and under realistic system’s
Table 1
uncertainties. The execution times necessary to solve the
Parameter values of the polymerization reactor
associated optimization problem are reported proving the numerical library imsl. The maximum number of the real time implementability of the proposed scheme. function evaluation has been taken equal to 100. The parameters of the polymerization of styrene are used in the simulations. These are given on table 1. A sampling period τs = 60 s has been used. In the defiThe computations are done using fortran source code
nition of the admissible profile for F [see equation (10)],
on a 1.3 GHz Pentium-III PC. The optimization has
the value λ =
been done using the optimization subroutine bcpol of
pling period of 10s can be implemented experimentally.
9
3 10
s−1 has been used. Note that a sam-
4.1
Nominal case
handling, Fig. 4 shows the behavior of the closed loop
N T (·) (–) / N (·) (-.)
4 3
system when the the maximal flow rate Fmax is de-
T (·)
56
creased to 0.0008 rather than 0.001. Note how in this
54
2
0 1.5
case, contrary to the preceding scenario where the tem-
52
1 0 −3 x 10
20
40
F (·)
50
60
0
20
90
40
Tj (·)
perature approaches its minimal value (50o ), the con-
60
troller in Fig. 4 uses the temperature jacket to realize
80 1
the control objective (Remaining close to the maximal
70 60
0.5
= 60). This leads to the two control inputs value Qmax R
50 0
0
20
40
40
60
QR (·)
0
20
40
60
being saturated by their maximal values.
80 60 40
Note also that it is rigorously impossible to stay exactly
20 0
0
10
20
30
40
50
Time (min)
60
at the maximal level Qmax = 60 because of the saturaR
70
tion on the control inputs. The controller stabilizes QR
Fig. 3. Behavior of the closed loop system under the reced-
to the maximal possible value.
ing horizon feedback. Qmax = 60, Tjmax = 80o , Tjmin = 50o , R
Fig. 5 shows the evolution of the control parametriza-
Fm ax = 0.001 mol/s. λ = 1/10s−1 . Sampling period
tion p (see section 3.2) during the reaction depicted in
τs = 1 min. ε = 0.05. Initial conditions N (0) = N T (0) = 1,
Fig. 4. Recall that the first three parameters concern
T = 50o , V (0) = 2
the definition of the open loop profiles for the jacket Fig. 3 shows the behavior of the closed loop system
temperature Tj while the last one defines the open loop
under the proposed receding horizon feedback with the
profile of F .
upper bound Qmax taken equal to 60. R
Note how the controller steers the heat production QR
4.2
Robustness against model uncertainties
to its maximum admissible value and maintain it at that level in order to maximize the production rate (recall
Very often, model uncertainties are due to the presence
that QR = (−∆H) · Rp and that Rp is nothing but the
of complex phenomenon that are difficult to model by
production rate).
explicit mathematical framework. This is the case for instance when the evolution of the concentration of rad-
In order to assess the multivariable character of the
icals µ is considered. Recall that µ appears in the very
proposed feedback and the quality of the constraint
definition (5) of the reaction rate Rp . This parameter is
10
N T (·) (–) / N (·) (-.)
4
T (·)
60
change with time as a function of temperature or con-
3 2
centration of monomer. It should be necessary therefore
55
to test the robustness of the controller against high vari-
1 0 1.5
0 −3 x 10
20
40
FF (·)
50
60
0
20
0
20
90
40
60
40
60
Tj (·)
ation of µ with time.
80 1
70 60
0.5
50 0
0
20
40
40
60
QR (·)
In order to do so, the following model is used for µ(t) during the reaction (note that this model is not known
80 60
by the controller that only measures the value of µ at
40
each sampling instant) :
20 0
0
10
20
30
40
50
60
Time (min)
70
Fig. 4. Behavior of the closed loop system under the same
h ψf · t i µ(t) = 1 + · µnom Tbatch
conditions as Fig. 3 with a lower maximal allowable flow rate
;
µnom :=
n ¯ · Np NA
(21)
Fmax = 0.0008. Note how the controller saturates the two control inputs in order to meet the achieve the control objective (remain close to the maximal allowable heat production Qmax R
= 60.
1
p1 = w1 /T˙jmax
More clearly, if ψf = 0 then no variation of µ with time is considered (µ is constant); for ψf 6= 0, the value of
p2 = w2 /T˙jmax
0.5
µ linearly increases during the reaction from µnom to
0.5 0
(1 + ψf ) · µnom . In both cases, the evolution of µ is not
0 −0.5
known by the controller. In the first case, with no vari-
−0.5
−1
0
20
40
60
−1
0
40
60
ation of µ with time, the controller acts well, as shown
f
p3 = t1 /Tp (kτs )
1
20
p4 = F /Fmax
in the first simulation (Fig. 3.
1
0.8
0.8 0.6 0.6 0.4 0.4 0.2 0
Fig. 6 shows the behavior of the closed loop system
0.2 0
20
40
60
Time (min)
0
0
20
40
for ψf = 2. Note that the controller avoids constraint
60
Time (min)
violation (by more than 5%) despite the fact that µ
Fig. 5. Evolution of the optimal parameter vector pˆ(kτs ) ∈ P ∈ [−1, 1]2 × [0, 1]2 during the batch depicted on
is multiplied by 3 (ψf = 2) during the reaction dura-
Fig. 4.
tion. During a sampling time, the controller switches off
not modelled here and therefore the controller assumes
temporarily the flow rate in order to avoid constraint
it is constant in the prediction scheme. However,µ might
violation on the allowed heat production QR .
11
N T (·) (–) / N (·) (-.)
4
T (·)
90
Execution times (in s) needed to solve P (x(kτs ), Tp (kτs )) 0.45
3
80
2
70
0.4
1
60
0.35
0
50
1.5
0 −3 x 10
20
40
F (·)
60
0
20
90
40
Tj (·)
60
0.3
0.25
80 1
0.2
70 60
0.5
0.15
50 0
0
20
40
40
60
QR (·)
0.1
0
20
40
60
80
0.05
60
0
0
10
20
30
40
50
60
70
80
40 20 0
Fig. 7. The computation times needed to solve the four di0
10
20
30
40
50
Time (min)
60
70
mensional optimization problem at each sampling instant of the scenario depicted in Fig. 6. The upper bound of the ex-
Fig. 6. Behavior of the closed loop system under the same
ecution times (say 0.5 s) is to be compared to the sampling
conditions as Fig. 3 with the model uncertainty on the con-
period τs = 60 s
centration of radicals given by (21). Case where ψf = 2,
suring the solid contents during the reaction at discrete
namely, the value of µ in (5) increases linearly from µnom to 3 · µnom during the reaction time interval [0, Tbatch ]. The
intervals. In this work, the heat transfer coefficient and
dynamics of µ is unknown to the controller but current val-
the heat loss were found to be constant during the reac-
ues are accessible to measurement according to section 2.2.
tion. Therefore, these coefficients were identified before
Note how the controller switches off temporarily the input
the reaction and the obtained values were introduced in
flow rate in order to avoid constraint violation on the heat
the heat balance to estimate the heat produced by the
production QR .
5
reaction. The monomer conversion was then estimated
Experimental results
from the heat balance. This allows the estimation of the number of moles of monomer and the concentration of
5.1
Process monitoring
radicals in the reactor using for example a Kalman filter (Fan and Alpay [4]) or a high gain observer (Sheibat-
The polymerization reactions are known to be exother-
Othman et al. [10]).
mic and are therefore usually monitored by calorimetry. The reactor and jacket temperatures are measured on-
5.2
Experimental set-up
line. The unknown terms in the heat balance (Qloss and U) can be estimated by correlation to the solid contents
The controller was validated experimentally on a 3 litres
(Fevotte et al. [5], Buruaga et al. [3]) which requires mea-
jacketed reactor. The reactor is equipped with a stirrer
12
with a stirring rate of 200 rpm which ensures the homo-
the controller has been taken equal to 150 in this ex-
geneity of the reactor temperature. The cover of the reac-
periment. Fig. 8 shows the evolution of QR during this
tor is equipped with a condenser to cool the evaporating
experiment. No attempt was done to accelerate the con-
components. Temperatures are measured in the reactor,
vergence time to the set-point by increasing the reaction
at the inlet and at the outlet of the jacket using PT100
temperature during the first 15 minutes in order to an-
probes. These data are acquired every 10s. A controlled
ticipate the important heat generated by the nucleation
pump allows the introduction of monomer. The exact
taking place at the beginning of the reaction. The jacket
amount introduced into the reactor is measured using a
temperature was therefore fixed at 60C during this time
balance where the masse is registered every 10s. A local
(Fig. 9). By the same way, the monomer flow rate (Fig.
PID controller is therefore implemented to control the
10) was fixed at 0 when Γ(N T , N ) = 0 which means that
pump. This controller takes its set-point from the non-
the polymer particles are saturated with monomer (Fig.
linear predictive controller. The jacket temperature is
11). This corresponds to the first 20 minutes of the reac-
controlled using a cryothermostat batch were the maxi-
tion. Fig. 11 shows both the desired monomer flow rate
mum heating or cooling rates are identical (1.5C/min).
calculated by the controller and the real one obtained experimentally while coupled with the local controller.
5.3
Experimental validation
The local controller generates small oscillations since it uses the flow rate generated by deriving the mass ob-
Styrene was used for the experimental validation of the
tained from the balance. However, the desired flow rate
controller. The used recipe is given in table 2.
calculated by the receding horizon controller does not
Initial charge (g)
Feed
Styrene
145
1000
Dodecyl sulfate, sodium salt
4
8
Potassium persulfate
4
−
oscillate which means that the nonlinear controller is well tuned. These oscillations affect the heat produced by the reaction as shown on Fig. 8. Fig. 8 shows that QR presents also some important oscillations that are not due to the fluctuations in the flow rate of monomer but to an important unpredicted change in the reaction
H2O
1000
500
rate. Fig. 12 shows the profile of µ that is proportional
Table 2
to the reaction rate. It is important to remind here that
Recipe used for the experimental validation of the controller
the dynamic of µ is not predicted by the controller as The desired heat produced by the reaction was set to
it is estimated online. A constant value of µ is used in
60W. The maximum number of function evaluation in
the controller during the prediction. For example at 130
13
minutes a very important variation of µ was observed.
not very important which allows to realize the optimiza-
This occurs if a gel effect takes place in the polymer par-
tion online. For longer reaction times such as continuous
ticles which decreases the termination rate of radicals
reactions, it would be interesting to consider a receding
and causes an important increase in µ. Nucleation of
horizon on one to two hours for example.
new particles also causes an increase in the reaction rate. It should be mentioned however that input-output lin-
However, the concentration of monomer in the polymer
earizing control can be calculated quasi instantaneously
particles was very low and therefore we exclude the pos-
while the receding horizon control depends on the num-
sibility of new nucleation. It can be seen however that
ber of iterations fixed in order to find the optimal solu-
even with very important variation in the process dy-
tion.
namic, the controller could decreases QR rapidly. This
Heat produced by the reaction
phenomena can perhaps be improved by including an
120
estimate of µ in the prediction scheme.
100 80
This experiment shows that even if the process model W
max
seems simple its dynamic can change rapidly in an unpredicted way.
60 40 Real
20
Compared to the input/output linearizing control used
0
by Sheibat-Othman et al. [12], the predictive controller
0
shows some advantages. First of all, the process constraints are included in the control scheme in this work.
20
40
60 80 Time (min)
100
120
140
160
Fig. 8. Experimental validation of the controller. The heat
Second, the controller was also found to stabilize rapidly
produced by the reaction with a maximal constraint at 60 W
the system. No filters on the desired trajectories were necessary to stabilize the controller as was found in [10].
6
Conclusion and future work
Third, the predictive controller gives an optimal trajectory of the inputs on the optimization horizon while the
In this paper, a multi-variable constrained receding hori-
input/output linearizing control gives the inputs to im-
zon control scheme has been proposed to maximize the
ply at that time. The prediction horizon was taken to
production during polymerization reactions. Two con-
be the whole reaction time in the studied simulations
trol inputs are used: the inlet flow rate and the jacket
and experimentally. Therefore a fixed horizon was im-
temperature. A key feature of the proposed scheme is
plemented. This was possible since the reaction time was
the very simple control parametrization enabling a real
14
Reactor and jacket temperatures
M (mol/cm3)
70
6.E-3
T Tj
65
5.E-3 saturation
4.E-3
60 °C
real
3.E-3
55 2.E-3
50
1.E-3
45
0.E+0
0
20
40
60
80 100 Time (min)
120
140
0
160
20
40 60 Time (min)
80
100
Fig. 9. Experimental validation of the controller. Reactor
Fig. 11. Experimental validation of the controller. Concen-
and jacket temperatures
tration of monomer in the polymer particles Number of moles of radicals in the polymer particles
Monomer input flow rate 3.0E-3
5.E-6 desired real
2.5E-3
4.E-6
2.0E-3
3.E-6
1.5E-3
3.E-6
mol
mol/s
4.E-6
1.0E-3
2.E-6 2.E-6 1.E-6
5.0E-4
5.E-7 0.0E+0 0
20
40
60
80
0.E+0
100 120 140 160
0
Time (min)
20
40
60
80 100 Time (min)
120
140
160
Fig. 10. Experimental validation of the controller. Controlled
Fig. 12. Experimental validation of the controller. Number
monomer flow rate and the reaction rate
of moles of radicals in the polymer particles ( µ)
time implementability of the proposed scheme despite
against unmodeled dynamics like the one affecting the
the relatively low sampling time (60 s). Another inter-
concentration of radicals in the polymer particles that
esting feature is the explicit handling of all operational
generally increases during the reaction due to the gel ef-
constraints that would be difficult to be rigorously han-
fect following very complex and unpredictable laws.
dled by more classical schemes. Note finally that the computation times needed to solve Investigations also showed nice robustness properties
the optimization problem are even compatible with a
15
higher measurement acquisition frequency (say 0.1 Hz)
[6] C. Gentric, F. Pla, and J.P. Corriou. Experimental study
that is practically feasible. This leads to more reactive
of the nonlinear geometric control of a batch emulsion polymerization reactor.
controller that would certainly make the results even
Computer Chemical Engineering,
21:S1043–S1048, 1997.
better than it appears from the simulations proposed in
[7] C. Gentric, F. Pla, M.A. Latifi, and J.P. Corriou.
this paper.
Optimization and non-linear control of a batch emulsion polymerization reactor.
The controller also gave good results while implemented
Chemical Engineering Journal,
75:31–46, 1999.
experimentally. It could be seen that even with a highly
[8] P. E. Gloor and R.J. Warner.
varying non modelled state, the controller could bring
to
back the system to the set-point without hight oscilla-
maximize
productivity
in
Developing feed policies polymerization
process.
Thermochimica Acat, 289(2):243–265, 1996.
tions. [9] D. Q. Mayne, J. B. Rawlings, C. V. Rao, and P. O. Scokaert. Constrained model predictive control: Stability and
References
optimality. Automatica, 36:789–814, 2000. of
[10] N. Sheibat Othman, G. Fevotte, and T. F. McKenna.
semicontinuous emulsion polymerization reactions by idp
Biobjective control of emulsion polymerizations: control of
procedure with variable time intervals.
the polymer composition and the concentration of monomer
[1] P.H.H.
Araujo
and
R.
Giudici.
Optimization
Computers and
in the polymer particles.
Chemical Engineering, 27:1345–1360, 2003.
Chemical Engineering Journal,
98:69–79, 2004.
[2] G. Arzamendi and J. Asua. Copolymer composition control of emulsion copolymer in reactors with limited capacity for
[11] C. Sayer, G. Arzamendi, J.M. Asua, E.L. Lima, and J.C.
heat removal. Industrial Engineering Chemistry, 30:1342–
Pinto. Dynamic optimization of semicontinuous emulsion
1350, 1991.
copolymerization reactions: composition and molecular weight distribution. Computers and Chemical Engineering,
[3] I. S. Buruaga, Ph. D. Armitage, J. R. Leiza, and J. M. Asua.
25:839–849, 2001.
Nonlinear control for maximum production rate latexes of
[12] N. Sheibat-Othman and S. Othman. Control of and emulsion
well-defined polymer composition. Ind. Eng. Chem. Res.,
polymerization reactor. Ind. Eng. Chem. Res., 45:206–211,
36:4243–4254, 1997.
2006.
[4] Sh. Fan and Estat Alpay. Calorimetric estimation for a batch-
[13] M. Vicente, J.R. Leiza, and J.M. Asua.
loop emulsion polymerization reactor. Chemical Engineering
Maximizing
production and polymer quality (MWD and composition)
Science, 59:2811–2815, 2004. [5] G. Fevotte, I. Barudio, and J. Guillot. An adaptive inferential
in emulsion polymerization reactors with limited capacity
measurement strategy for online monitoring of conversion
of heat removal. Chemical Engineering Science, 58:215–222,
in polymerization processes. Thermochimica Acta, 289:223–
2003.
242, 1996.
[14] C.M. Astorga Zaragoza, S. Othman, and H. Hammouri.
16
Moving horizon control of a dentrification reactor. WSES/ International Conferences AMTA 2000- MCBC 2000-MCBE 2000 JAMAICA, pages 931–936, 2000. [15] J. Zeaiter, J. A. Romagnoli, G. W. Barton, V. G. Gomes, B. S. Hawkett, and R. G. Gilbert. Operation of semi-batch emulsion polymerization reactors: Modeling, validation and effect of operating conditions. Chemical Engineering Science, 57:2955–2969, 2002.
17