622 The Journal of Experimental Biology 209, 622-632 Published by The Company of Biologists 2006 doi:10.1242/jeb.02010
Constrained optimization in human running Anne K. Gutmann1, Brian Jacobi2, Michael T. Butcher3 and John E. A. Bertram4,* 1
Department of Theoretical and Applied Mechanics, Cornell University, Ithaca, NY 12853, USA, 2Department of Biological Sciences, Florida State University, Tallahassee, FL 32306, USA, 3Department of Biological Sciences, University of Calgary and 4Department of Cell Biology and Anatomy, Faculty of Medicine, University of Calgary, Calgary, AB T2N 4N1, Canada *Author for correspondence (e-mail:
[email protected])
Accepted 21 November 2005
Summary preferred speed and frequency reduced inter-subject Walking humans spontaneously select different speed, variability and made group behavioral trends more frequency and step length combinations, depending on visible. Although actual behavior did not coincide exactly which of these three parameters is specified. This behavior with running cost optimization, self-selected gait and can be explained by constrained optimization of cost of predictions from the general human cost surface did agree transport (metabolic cost/distance) where cost of transport to within the 95% confidence interval and the region of is seen as the main component of an underlying objective minimal cost+0.005·ml·O2·kg–1·m–1. This was similar to the function that is minimized within the limitations of specified constraints. It is then of interest to ask whether level of agreement between actual and predicted behavior or not such results are specific to walking only, or indicate observed in walking. Thus, there seems to be substantial a more general feature of locomotion control. The current evidence to suggest that (i) selection of gait parameters in study examines running gait selection within the running can largely be predicted using constrained framework of constrained optimization by comparing selfoptimization, and (ii) general cost surfaces can be selected running gaits to the gaits predicted by constructed using metabolic data from one group that will constrained optimization of a cost surface constructed largely predict the behavior of other groups. from cost data available in the literature. Normalizing speed and frequency values in the behavioral data by Key words: gait, locomotion, cost, control, human.
Introduction It has been shown that humans and animals choose to move in a way that minimizes the cost of locomotion (Alexander, 2000; Alexander, 2001; Hoyt and Taylor, 1981; Saibene, 1990). Until recently, it was generally assumed that the least metabolically costly gait for any given forward speed (v), step frequency (f), or step length (d) could be described by a single functional relationship between these parameters. Thus, one should be able to generate a single behavioral relationship representing the least costly gait in speed–frequency–step length (v–f–d) space by controlling any one gait parameter, measuring the self-selected value of either one of the two other parameters, and calculating the value of the third using some form of the relationship v=fd. However, Bertram and Ruina (2001) suggested in a walking study that not one but three different ‘least costly’ relationships are generally obtained by following such a procedure. The behavioral relationship obtained depends on which parameter is specified. Thus, one ‘least costly’ behavioral relationship was obtained by specifying v, another by specifying f, and yet another by specifying d. It is apparent from these results that
optimal gait is not rigidly predetermined by internal factors, but rather depends on the conditions presented to the individual and emerges from interaction between factors, both internal and external to the individual. But how can three different curves all represent the least costly gait? To explain this apparent paradox Bertram and Ruina formulated the constrained optimization hypothesis (Bertram and Ruina, 2001). According to this hypothesis, gait parameters are selected to optimize (minimize) some objective function within the limitations of imposed constraints. In keeping with the original observation that animals and humans move in a way that minimizes cost, Bertram and Ruina (2001) proposed that cost of transport (metabolic cost/distance) serves as the objective function and that the controlled gait parameters serve as constraints. Bertram (2005) compared self-selected behavioral relationships to behavioral predictions obtained by applying constrained optimization to a metabolic cost surface and found that these were strikingly similar for walking. This suggests that metabolic cost does indeed strongly influence choice of gait parameters, and validates constrained optimization as a model for predicting gait selection.
THE JOURNAL OF EXPERIMENTAL BIOLOGY
Constrained optimization in human running Is this result specific to walking, or does it apply to other aspects of human movement control? There are many features of the mechanics of walking that differ substantially from running. Identifying a similar control strategy in both running and walking would indicate a general feature of movement control effective at levels beyond the mechanics of each specific gait. The objective of the present study was to test the applicability of the constrained optimization hypothesis to running. We did this by comparing self-selected running behavioral data collected under v-constrained, f-constrained and d-constrained conditions to predictions obtained by performing constrained optimization on metabolic data available in the literature. This allowed us to see whether or not constrained optimization of metabolic cost can reliably predict gait selection in other modes of terrestrial locomotion besides walking, and whether or not constrained optimization of metabolic cost data from one group of subjects can predict the gait selected by another group. Materials and methods Subjects Five healthy subjects (one female and four males) participated in the study. Anthropometric data for each subject are given in Table·1. We obtained informed consent from all subjects prior to experimentation. All testing was done according to the guidelines set by the Florida State University Human Subjects Committee Review Board. Self-selected running behavior We employed methods similar to those detailed in Bertram and Ruina (2001) and Bertram (2005) for human walking, but used constraint values appropriate for running. Since steady state locomotion can be defined by the simple relationship v=fd, we evaluated running behavior under three different constraint conditions: v-constrained, f-constrained and dconstrained. In each case one variable was controlled (either v, f or d), one variable was directly measured, and the third variable was calculated using the relationship v=fd. We briefly outline the specific procedures below. For constrained v, subjects ran on a treadmill (Desmo Pro, Woodway, Wakeshaw, WI, USA) at constant belt speed. Eleven different belt speeds were used, ranging from 0.49 to 4.32·m·s–1. We presented the belt speeds at random to reduce Table·1. Physical characteristics of subjects Subject 1 2 3 4 5
Sex
Mass (kg)
Height (m)
Leg length (m)
M M M M F
90.8 58.5 69.3 103.7 53.9
1.85 1.73 1.78 1.84 1.60
0.930 0.910 0.950 0.906 0.845
M, male; F, female.
623
the potential for systematic bias and cross-trial interference. Between trials the subjects walked at a comfortable speed until they had fully recovered. At each v, f was measured by timing the duration of two sets of 20 steps using an electronic stopwatch. The two trial results were averaged to obtain a reliable measure of f for that speed and individual. We calculated step length using d=v/f. Measurements were made after at least 1·min of running at each v. For constrained f, subjects ran in time to the beat of an electronic metronome (KDM-1, Korg Inc., Tokyo, Japan) at ten different frequencies ranging from 2 to 3.33·steps·s–1. Again, step frequencies were randomly presented and subjects were allowed to fully recover between trials. We measured v by timing how long it took subjects to travel a 10·m segment of a 30·m level runway (using a portion of an outdoor athletic track). Accurate measurements of speed were facilitated by use of two portable cameras (TK-S241U, JVC, Victor Co., Yokohama, Japan), mounted perpendicular to the path of the runner on tripods placed at the starting and ending points of the 10·m distance along the straight portion of the track. We combined the signals from both cameras into a single viewing channel via a signal inserter (SCS splitter/inserter, American Video Equipment, Houston, TX, USA) and fed the signal into a video monitor (Panasonic, Matsushita Electric Industrial Co., Ltd., Kadoma, Japan). This allowed the timer a perpendicular view of the starting and ending points. We timed each 10·m run using an electronic stopwatch. We calculated step length using d=v/f. Finally, for constrained d, subjects ran by stepping on evenly spaced markers (2·inch roofing nails with colored plastic washers inserted into a grass athletic field) over level ground at ten predetermined step lengths, ranging from 0.3·m to 2·m. Some subjects were unable to reliably maintain 2·m step lengths, so only nine step lengths were used for these individuals. Step lengths were randomly presented and subjects were allowed to fully recover between trials. We also gave the subjects one or more practice trials at each step length and did not take measurements until the subject felt fully comfortable with the step length requirements of the trial. This was especially necessary for step lengths approaching 2·m. We measured f at each speed by timing the duration of 2 sets of 20 steps within 30 markers for each given step length. We then averaged the two measured frequencies to obtain f. We calculated speed using v=fd. Data analysis Self-selected running behavior All self-selected running behavioral data were pooled to evaluate general gait selection trends. Before pooling the data, we normalized v data by apparent preferred v (vp), f data by apparent preferred f (fp), and d data by dp=vp/fp for each subject. We considered normalizing the data by speed and frequency of variants of the Froude number, but rejected this normalization since it did not improve the fit of the linear regressions. We determined vp and fp by estimating the location of the point of intersection of the v-constrained, f-constrained, and d-constrained v–f relationships (Fig.·1). The point of intersection should indicate the absolute minimum cost of
THE JOURNAL OF EXPERIMENTAL BIOLOGY
624
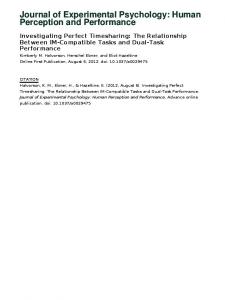
A. K. Gutmann and others 5 (fp, vp)
4.5 4 Speed (m s–1)
3.5 3 2.5 2 1.5 1 0.5 0 1.5
2
2.5 3 Frequency (steps s–1)
3.5
4
Fig.·1. A plot of speed–frequency relations for a single subject running under the three constraint conditions imposed in this study. Red circles show frequencies selected when speed is constrained in treadmill running, blue circles show speeds selected when frequency is constrained in over-ground running to a metronome beat, and green circles indicate the speed–frequency combinations selected when step length is constrained by stepping in registry with ground markers. Each relation was fit with a least-squares linear regression with the constrained parameter as the independent variable, then the relationship determined was converted to speed–frequency for comparison (see text for details). The point of intersection of the vconstrained, f-constrained and d-constrained relationships gives apparent preferred speed and frequency (vp and fp).
transport for each individual and, therefore, should also correspond to the freely chosen v and f selected by an individual during unconstrained running, as it does for walking (Bertram and Ruina, 2001; Bertram, 2005). The pooled self-selected running behavioral data were fit with least-squares linear regressions (SigmaStat, SPSS, Chicago, IL, USA). Since the constrained variable (independent variable) was different for each constraint condition, regression analyses were performed with the data plotted on different axes for each constraint. Frequency-constrained data were plotted with f on the x-axis and v on the y-axis; v-constrained data with v on the x-axis and f on the y-axis; and d constrained data with d on the x-axis and f on the y-axis. However, for the sake of consistency and ease of comparison, each linear regression equation was converted into v(f) form and replotted in v-f space (Fig.·2), as per Bertram (2005). The slope of the v–f relationship for each of the three constraint conditions was obtained from the linear regressions and the standard error for each slope was computed. A oneway analysis of variance (ANOVA) was used to determine whether or not the three slopes were significantly different from one another. Once statistical significance was determined, a Tukey post hoc comparison (also in SigmaStat) was used to identify where the significant differences lay. We defined statistical significance as P⭐0.05.
Speed (v/vp)
Cost surface We compiled and evaluated cost data from several sources available in the literature (Cavanagh, 1982; Knuttgen, 1961; Liefeldt, 1992) as well as from an undergraduate 2 student honors project done in our laboratory at Speed Florida State University (Rouviere, 2002). See 1.8 constrained Appendix for an outline of the methods used in Step length constrained this thesis. Information on these data is displayed 1.6 in Table·2. We used data from the single-subject studies directly and average values from 1.4 multiple-subject data. 1.2 Although the above data represented a reasonable assemblage of running metabolic Frequency 1 cost data, all data sets did not agree well. Two constrained sets of data, v-constrained data from Knuttgen 0.8 (1961) and from Liefeldt (1992), differed substantially from the other data available. The 0.6 cost values reported by Liefeldt (1992) were 0.4 unusually low (0.1611–0.1769·ml·O2·kg–1·m–1). Overall P