2009 16th Working Conference on Reverse Engineering
Constructing a Resource Usage View of a Large and Complex Software-Intensive System Trosky B. Callo Arias, Paris Avgeriou
Pierre America
Department of Mathematics and Computing Science University of Groningen The Netherlands
[email protected],
[email protected]
Philips Research and Embedded Systems Institute The Netherlands
[email protected]
Abstract—A resource usage view consists of models that are important assets to analyze and control usage of hardware resources such as processors and memory elements. In this paper, we present the application of a top-down approach to construct a resource usage view using actual system runtime information. The models in this view help to address the concerns of a resource usage viewpoint providing information in terms of system-specific architecture and design execution elements such as execution scenarios, tasks, software components, processes, and threads. As part of our validation, constructing a resource usage view of an MRI system, a representative large software-intensive system, we observed that the constructed models for this view provide useful overviews and insights for practitioners to describe part of the system execution architecture and especially to analyze and evaluate the use of hardware resources in a top-down fashion.
at hand. For instance, this is the case when the system is deployed across several computers with a particular resource configuration (e.g., multicore processors and large memory sets) and with a runtime structure composed of multiple processes and multiple threads. On the other hand, we also observed that measurement-based descriptions of resource usage are often used in practice (e.g., for corrective maintenance and crash detection) and supported by various tools [2-4]. Although measurement-based descriptions provide actual information about resource usage, this information does not directly match the high-level design and architecture abstractions that practitioners use when developing and maintaining large and complex software-intensive systems following architecture-driven approaches. Our focus is to support practitioners in constructing resource usage models that describe the actual resource usage in terms of design and architecture abstractions. Our motivation is that these descriptions enable practitioners to manage system complexity, create overviews to get insights into the system execution architecture, i.e. what a software system does at runtime and how it does it [7], and improve predictions with respect to system resource usage. The term runtime refers to the actual time that the software system is functioning (during testing or in the field). In this paper, we present the extension of our previous work [8], a top-down approach that uses actual runtime information, in order to construct resource usage models that describe the usage of processor and memory elements. This extension has two particular characteristics: it helps to construct models of a resource usage view that address the concerns of an identified resource usage architectural viewpoint and it provides information in terms of system-specific runtime elements (e.g., scenarios, tasks, software components, processes and threads). The validation of this extension of our approach consisted in constructing a resource usage view of an MRI system (a representative large software-intensive system developed by Philips Healthcare [5]). The practitioners involved in this validation report that the constructed models for this view provide useful overviews and insights to analyze and evaluate adequate use of processor and memory resources in a top-down fashion.
Keywords-view construction; resource usage view; execution view; dynamic anlysis
I.
INTRODUCTION
The typical hardware resources that are considered when developing and maintaining a software system are processors, memory, disk, and network bandwidth. Often, an inappropriate or unpredicted usage of these resources can compromise non-functional properties such as performance and reliability, triggering the execution of expensive corrective maintenance and even redesign activities. In the literature, various methods and approaches use resource usage information to predict and analyze performance and reliability issues related to resource usage. Some of these methods use as an input resource usage information from design models and specifications [6, 11] while others use actual measurements from an existing system [9, 17]. As part of our research on the evolvability of large software-intensive systems [15], we examined the adoption of each type. On the one hand, we observed that the adoption of prediction methods using resource usage information from design models is not a common practice. This is especially true when resource usage information is inaccurate or hard to collect due to the size and complexity of the software system 1095-1350/09 $26.00 $25.00 © 2009 IEEE DOI 10.1109/WCRE.2009.37
247
Authorized licensed use limited to: University of Groningen. Downloaded on December 10, 2009 at 12:26 from IEEE Xplore. Restrictions apply.
The organization of the rest of this paper is as follows. In Section II, we briefly describe the top-down approach and summarize its customized characteristics to construct resource usage models. In Section III, we describe the process to identify the required input and process it to construct models of a resource usage view. Section IV presents the type of models that compose a resource usage view constructed with our approach. In Section V, we describe our observations and findings from constructing resource usage models in practice. In Section VI we discuss related work and finally in Section VII, we provide some conclusions and future work. II.
A.
Resource usage viewpoint By definition, an architectural viewpoint addresses particular concerns of the system stakeholders and consists of the conventions for the construction, interpretation, and use of an architectural view [10]. In [7], we describe how to identify a set of viewpoints for a particular large softwareintensive system interacting with key practitioners of a software development organization. As an elaboration of our approach, we are putting the definitions of the viewpoints identified in [7] into practice using them as an input of our approach. The inclusion of viewpoints to our approach is especially important because viewpoints include organization- and system-specific concerns and guidelines that help us to focus and ease the identification of requirements to construct execution views, specifically a resource usage view, of a particular system. In this case, to construct a resource usage view, we put into practice the definition of a resource usage viewpoint (see A in Fig. 1). The elements that define this viewpoint are summarized in Table 1. In general, the concern of this viewpoint is to ensure an adequate use of hardware resources, e.g., processors and memory elements at runtime. Within our approach, the definition of the resource usage viewpoint serves as a guideline to ease and scope the interaction with practitioners and reduce the iteration phases. For instance, it helps to communicate what runtime concepts (elements and relationships) build a resource usage view and presents examples of resource usage models. Moreover, it helps us to define the requirements and inputs to construct new resource usage models (e.g., identify stakeholders, selection of suitable execution scenarios, techniques to collect runtime data).
CUSTOMIZED TOP-DOWN APPROACH
In our previous work [8], we presented a dynamic analysis approach to construct execution models of a large software-intensive system in a top-down fashion. This approach is an iterative process that allows us to cope with complexity by providing means to collect and analyze high-level information first, and then dig down for details when needed. This has proven useful especially to support top-down and architecture-driven activities to analyze the runtime of the software of a large software-intensive system. Fig. 1 illustrates the main elements of our approach to construct models for an execution view. It includes A) the set of inputs and steps of the overall process to construct execution models interacting with practitioners, B) a metamodel that describes a set of concepts and relationships between them that we use to describe and analyze the runtime of a software system, and C) the sources of actual runtime information that we use. In the rest of this section, we describe the key elements, improvements, and customizations of the elements of our approach to construct models for a resource usage view.
A Resource Usage Model
Execution Metamodel Resource usage viewpoint Analysis Requirements - Scenarios - Stakeholders
Analysis Input
System Execution
Logging and Process Activity
Processing Node Deployed in 1 1..n
1..n
2: Interpretation of Execution Information
Practitioner
Interaction 1..n Performs
Automated Process
Activity
Code Utilization Load/Execute
Access Persistent Data
Legend: Data
1..n Thread
Data access
3: Construction of Execution Model
Activity
Interact
Logging - Workflow - Processes - Threads
1..n
Tool Supported
Document
Execution Coordination
1..n
Mapping Rules
Feedback
Procedure Call
1..n Process
Model Presentation
Data Sharing
Require
Software Component
1: Task Definition
Execution Scenario
Task
Platform Utilization
Code
Use Platform Resource
B
Logic
Figure 1. Customized approach for the construction of a resource usage view
248
Authorized licensed use limited to: University of Groningen. Downloaded on December 10, 2009 at 12:26 from IEEE Xplore. Restrictions apply.
Measurements - Process Activity - Processor and memory activity
C
TABLE I.
Concerns Models Stakeholders Development activities
metamodel (see the highlights in Fig. 1 B) to construct models for a resource usage view.
RESOURCE USAGE VIEWPOINT SUMMARY
Identification of bottlenecks and delays. Definition of metrics, benchmarks, and budgets. Scenario-based resource (i.e. processor, memory, and network) usage models, budgets, predictions. Software architects, designers, testers, and system platform supporters. System understanding, analysis of alternative designs and implementations, introduction of new hardware resources, testing and conformance of design and implementation, corrective maintenance, and tuning of nonfunctional properties.
C. Sources of runtime information The source of information for our approach is a combination of system logging and process activity (see C in Fig. 1). In our previous work [8], we described how we synchronize and combine these two sources to extract information that aligns with the elements and relationships described in our metamodel. So far, we have explored runtime data to determine dependencies (interactions and relationships) between scenarios, tasks, and software components. However, to construct models for a resource usage view, we need to include data about activity of resources such as processors and memory of the system’s processing nodes. Various monitoring tools, usually provided by the runtime platforms, [2-4] support the collection and integration of resource’ s activity to our source of information. For instance, we have extended our source of information with measurements that can describe the usage of the processor(s) and memory of the system’ processing nodes. The measured processor usage information consists of indicators about its performance in executing arithmetic and logical computations, initialization of operations on peripherals, and execution of threads. The measured memory usage information consists of indicators that measure the access to the various sections of the system’ s physical and virtual memory. In this extension of our approach, we focus on processors and memory resources, but additional usage information can be also measured for resources such as network interfaces, disks, and the file system cache. The latter is typically used as indicator of I/O operations because it consists of indicators that monitor the file that stores and permit fast access to recently used data without having to read it again from the disk.
B. Execution Metamodel Our approach is supported by a specific metamodel that describes the various elements and relationships that play a role during the runtime of a software system (see B in Fig. 1). We introduced this metamodel in our previous work [8] and progressively extended it along the progress of our research. In particular, to support the construction of a resource usage view, we have included the concept of Processing Node and specializations for the Platform Resource concept. A processing node represents the hardware devices, e.g., computers, onto which software components are deployed. Fig. 2 illustrates the specialization of the platform resource concept of our metamodel and its relationship with the processing node concept. A processing node contains one or more platform resources, which can be either code (software) or hardware elements. Fig. 2 as a description of the extension of our metamodel, also illustrates that processors and memory are used by a given software component through the activity performed by the threads of its respective set of processes. Processing Node
1..n
Memory
INPUT ANALYSIS AND INTERPRETATION OF RUNTIME ACTIVITY
Technically, it is possible to construct all sorts of resource usage models for a given execution scenario. However, only a set of them address the important concerns of a practitioner trying to solve a given problem. In this section, we describe how to analyze an execution scenario to identify the set of resource usage models (see Table 1) that should be constructed including the resource usage that should be measured and interpreted.
Platform Resource
Platform Hardware
Platform Code
Processor
III.
Network Interface
A. Scenario input analysis For the construction of execution views, in this case a resource usage view, our approach relies on the practitioners’ criteria to select key execution scenarios. As the input for our approach, it is important to define as early as possible the resource usage model to be constructed. This is particularly important to decide what runtime data to collect and how to interpret it. The analysis we follow consists of the identification of the concerns of practitioners about resource usage and
Figure 2. Specialization of execution elements for resource usage description
Overall, the various elements in the metamodel define a number of concepts described in an execution model of a software system. In terms of the elements in our metamodel, we can express that a model of a resource usage view describes in general how a software system uses the hardware resources contained in the system processing nodes. In Section IV we describe the specific set of elements from our
249
Authorized licensed use limited to: University of Groningen. Downloaded on December 10, 2009 at 12:26 from IEEE Xplore. Restrictions apply.
the decisions that may determine the resource usage within a given execution scenario. On the one hand, concerns are identified from the characteristics of the system functionality, delivered by the execution scenario at hand, which requires one or more specific resources. For instance, for an execution scenario that delivers a computation-intensive function, the computationintensive characteristic triggers the concern about the proper usage of the involved processing nodes’ processors. On the other hand, the decisions include design, implementation, and deployment decisions that determine which system processing nodes, software components, and resources (e.g., processor or memory elements) are involved within the execution scenario at hand. This information can be collected by asking practitioners and complemented constructing a functional mapping model [7] as a scenario overview, as we presented in [8]. Together, the identified concerns and decisions, in the case of computation-intensive scenarios, may suggest that the first model to be constructed is a processor usage model using measurements of the usage of the corresponding processor(s) of the processing node (s) involved in the execution scenario. For a single process and single processing node system, this analysis may be trivial, but when the system at hand is large and complex, this is necessary to manage size and complexity when deciding which software components, processing nodes, and resources should be monitored and perhaps instrumented to collect the appropriate runtime activity. In summary, the identification of concerns and decisions of a chosen scenario help us in identifying stakeholders, narrowing down the identification and analysis of the required instrumentation to collect runtime activity, and moreover the identification of the models that may be actually useful to analyze a specific scenario. We will describe more about concerns and decisions of execution scenarios in Section V.
1) Resource usage indicator: This type of mapping rules assigns unique or combined resource activity indicators (see Section II.C) to a resource as its most representative resource usage information. To choose the representative indicators for a given resource and design this type of rule it is necessary to follow two activities. First choose a set of candidate indicators analyzing the technical information of the indicators that can be measured using the available monitoring tools [2-4]. Second, from the candidate set, choose the definitive indicator(s) in common agreement with practitioners based on the characteristics of the scenario under analysis, as described in Section III.A. For the MRI system, we analyzed the technical description of the indicators that can be measured on its runtime platform [13, 14]. We mapped a combination of the Working Set indicator and created Handles indicator to analyze memory usage in a data-intensive scenario. For the interpretation of processor activity, there is only one type of indicator, but when analyzing scenarios using multicore processors, the mapping may use averages and maximum values in case there is no explicit design or deployment decision that pertains to a particular core. In Section IV, we describe in more detail these examples of mapping of resource usage indicators showing models that use them. 2) Runtime activity codification: This type of mapping rules encodes workflow information and activity of pre-identified system execution elements. This consists of mapping predefined types of text patterns of logging messages and process activity events that represent some type of activity performed by tasks, software components, and threads to numerical values. Fig. 3 shows a snippet of this mapping that illustrates how text patterns that describe the beginning and end of a task and any other activity within the task are codified into values 2 and 15 respectively. This codification is may change when digging down for details such as to split a given task into smaller tasks or make a particular interaction, within a task, explicit. The ultimate goal of this codification is the homogenization of the input that we use to construct the graphical representations of resource usage models.
B.
Interpretation of runtime activity Based on our observation on how a large organization develops a large software-intensive system, we consider that presenting resource usage information in terms of the system design and architecture elements is appealing for practitioners following architecture-driven strategies. We have shown in [8] that applying the concept of mapping rules [16] help us to interpret actual runtime activity, i.e. logging messages and process activity to extract information about design and architecture execution elements. For instance, we used mapping rules to extracted instances of execution elements such as the tasks of an execution scenario, the software components of the system and their respective processes and threads, the organization of data repositories, and major code elements [8]. To support the construction of a resource usage view, we have extended our implemented mapping rules mainly to enable the graphical representation of correlations between resource usage measurement and design and architecture execution elements. The types of mapping rules that make this representation possible are:
Time .. 00:04.37 00:04.37 .. 00:04.37 00:23.65 .. .. 00:30.06 00:30.06 .. 00:30.06 01:06.98
Process .. MRBootstrap MRBootstrap .. MRBootstrap MRBootstrap .. .. MRBootstrap MRBootstrap .. MRBootstrap MRBootstrap
PID TID .. .. .. .. .. .. .. .. .. .. .. .. ..
.. .. .. .. .. .. .. .. .. .. .. .. ..
Logging Message .. ----------------------------------------------------------Starting Background .. ----------------------------------------------------------completed startup of Background .. .. ----------------------------------------------------------Starting Application Software .. ----------------------------------------------------------completed startup of Application Software
Activity Available Code Memory .. .. 2 7.00 15 7.00 .. .. 15 7.00 2 6.44 .. .. .. .. 2 6.44 15 6.44 .. .. 15 6.44 2 5.98
Figure 3. Mapping runtime information for a resource usage model
C.
Input to construct a resource usage model To store the information obtained applying the mapping rules described in Section III.B we use two types of tuples. First, (t, v, r) that describes the assigned indicator value v that represents the usage information of a resource r at a time
250
Authorized licensed use limited to: University of Groningen. Downloaded on December 10, 2009 at 12:26 from IEEE Xplore. Restrictions apply.
t. Second, (t, c, e) that describes the code value c that represents the occurrence of a workflow or interaction activity performed by an execution element e at a time t. The information in the target view, series of tuples, represents the input for the Construction of Execution Model activity of our approach (see A in Fig. 1). To construct the graphical representations of the models for a resource usage view, we plot the first two elements of the described tuples. The third component is often used to color code or define the texture of the elements in the graphical representation of the model. The way we use these values varies among the types of models as we describe in Section IV. Due to the use of color-coding and textures to represent and differentiate the various elements in the graphical representation of the presented models in Section IV, we suggest reading on-screen or using color-printed versions. The current tool support that we use to support this process is Microsoft Excel and the .netCHARTING library [1].
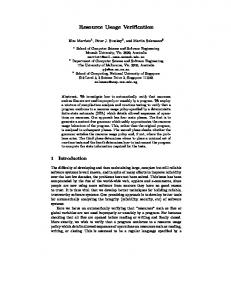
that the required budget to have the software system up and running, in the monitored processing node, is ~1GB in total or 0.56GB and 0.46GB for each of its tasks respectively when looking at the detail. Nevertheless, as we describe in Section V, this is not the only or first information that practitioner may extract using this type of models. Active Tasks Starting Background
Available Memory (GB) 7.4
Starting Application Software
7.2
7.0
6.8
6.6
6.4
6.2
6.0
IV.
MODELS OF A RESOURCE USAGE VIEW
Models of the resource usage view constructed with our approach aim at describing resource usage information in a top-down fashion to support top-down or architecture-driven strategies to analyze the runtime of a large software-intensive system. We distinguish task, component, and thread resource usage models. In this section, we describe these types of models including the execution elements involved, the graphical representation used for each of them.
00:00
00:09
00:17
00:26
00:35
00:43
00:52
01:00
01:09
01:18
5.8 01:26
Execution time (mm:ss)
Figure 4. Example of task resource usage model
B.
Component resource usage models Component resource usage models are more fine-grained than task resource usage models. The purpose of this type of models is to describe the correlation between the activity of each system software component (set of one or more running processes) and the usage of hardware resources within key execution scenarios. Fig. 5 shows an example of a component resource usage model for the main scenario of the MRI system. The execution elements involved in this model are the key software components that interact (running either in the same or different processing nodes) to deliver the functionality of the scenario, the measured values of the usage of the resources under analysis, and the time that the execution scenario takes place. The graphical representation of this type of resource usage model is very similar to task resource usage models, except for two aspects of the description of software components’ activity. First, it is necessary to distinguish if the involved software components run in different processing nodes. To do this, we split the plot area into horizontal sections (delimited by dotted lines). Horizontal sections share the same horizontal axis (execution time), but the vertical axis at the right side serves only as scale for the section that contains the plotted usage information. For instance, the model in Fig. 5 involves two processing nodes, Scanner computer and Recon computer. The first computer contains the Scanner software component. The second computer contains the monitored processor and the Reconstructor software component.
A.
Task resource usage models Task resource usage models are the most coarse-grained representation of resource usage information that we construct. The purpose of this type of models is to describe the correlation between the tasks of key execution scenarios and the activity of hardware resources. Fig. 4 shows an example of a task resource usage model, constructed with the runtime information partially shown in Fig. 3. This model describes memory usage within the major tasks of the booting of the MRI system. The involved execution elements in this type of model are the tasks of the given scenario, the measured values of the usage of the resources under analysis, and the period of time that the execution scenario takes place. The graphical representation of a task resource usage model consists of a horizontal time axis over which the series of resource usage indicator tuples are plotted. Then, a vertical axis at the right side of the model is a reference for the usage information of the resource being described. On top of the usage information, we plot the series of codified runtime activity tuples related to workflow to represent the tasks of the scenario as consecutive segments along the execution time (horizontal axis). The correlations described in a task resource usage model can help to identify the actual resource budget for a scenario as a whole or for its specific tasks under analysis. For instance, the model in Fig. 4 uses the indicator Available Memory to describe the required memory to startup the software of the MRI system. Looking at this model, one can say
251
Authorized licensed use limited to: University of Groningen. Downloaded on December 10, 2009 at 12:26 from IEEE Xplore. Restrictions apply.
RECONSTRUCTOR
SCANNER
Processor Usage 140
S1
120 SCANNER COMPUTER 100 RECON COMPUTER 80 60 R2 40
R1
20 0 00:00
03:36
07:12
10:48
14:24
18:00
21:36
25:12
28:48
32:24
36:00
39:36
Execution Time (mm:ss)
Figure 5. Example of a component resource usage model
Second, according to our execution metamodel (see B in Fig. 1) a software component is mapped to a set of one or more running processes. Thus, the graphical representation of a software component activity is an aggregation of the activity of the processes (including their respective threads) that build it. A horizontal segment (consecutive plotted points) represents the software component’s activity at a given period. This segment aggregates the interpretation of the various logging messages and process activity events within the given period. The height of the segment indicates if the aggregation is for one or more processes. For instance, in the execution scenario described in Fig. 5, the Reconstructor component has two main active processes (R1 and R2) within the execution scenario. When only R1 is active, the segment of the Reconstructor component is at the middle of the first horizontal level. When both processes are active, the segment reaches the middle of the level above. A space between two consecutive segments represents a period of time that the respective component is inactive, e.g., waiting for some data or control message from other component. The correlations described in a component resource usage model expose the periods where a software component is active or inactive and the same for the software components that interact with it. The analysis of these situations and the usage information of the chosen resource enable the identification of bottlenecks and delays. For instance, the model in Fig. 5 shows one of the most computation-intensive execution scenarios of the MRI system where the Reconstructor component has to compute (convert into pictures) as quickly as possible sets of raw data sent by the Scanner component. Thus, the concern within this scenario is the adequate use of the processor in the Recon computer. To address this concern, the model is constructed using measurement of the Processor Usage indicator.
C. Thread resource usage models Thread resource usage models are the most fine-grained representations of resource usage that we construct. The purpose of this type of model is to describe the correlation between thread activity and the activity of hardware resources. This level of abstraction is also important because, according to our metamodel (see B in Fig. 1), threads are the finest and initial links to map resource usage to higher abstractions such as components and tasks in case a bottom up approach is required. Fig. 6 shows an example of a thread resource usage model of another key execution scenario of the MRI system. The execution elements involved in this model are the threads of the processes that interact to deliver the functionality of the scenario, the measured value of the resources under analysis, and the time that the scenario takes place. The graphical representation of this type of models also presents the activity of the involved execution elements over the horizontal time axis. In this case, we present thread activity as horizontal segments vertically distributed. Therefore, segments at the same vertical level represent the activity of the same thread but at different points in time. In addition, if the interpreted runtime information from the logging and process activity makes it possible, gray lines represent the execution flow among threads, which aggregates communication and control flow between them. The vertical level of each thread contains the name of the process and thread. For instance A_ADUI:MAIN indicates that the thread name is MAIN and its respective process name is A_ADUI. Identifying the names of the involved threads is important to present this type of models as information that aligns to a design or architecture level. Identifying the name of a thread (from the collected runtime information), instead of its thread ID (numerical value), helps to make the function or role of the thread explicit and eases the analysis of the model.
252
Authorized licensed use limited to: University of Groningen. Downloaded on December 10, 2009 at 12:26 from IEEE Xplore. Restrictions apply.
Threads
Working Sets (MB)
Handles x10 115
A_ADUI::(NULL) A_ADUI::COMPEXAM
105 A_ADUI::MAIN P_QMUI::USERLOG
95 SCU:: UNKNOWN SCU::(NULL)
85
SCU::DMICOM SCU::EVENTTHREAD
75
SCU::IMG-PROC SCU::PMSTRANSFERPERFORMER
65 SCU::PULLSCHEDULER SCU::PUSHSCHEDULER
55
45 00:00
00:07
00:14
00:21
00:28
00:35 00:41 00:48 Execution Time (mm:ss)
00:55
01:02
01:09
01:16
01:23
Figure 6. Example of a thread resource usage model
However, sometimes it is not enough to make the function of the thread explicit, especially when the system at hand uses third party or off-the-shelf components. Often practitioners are familiar with code libraries or modules that third party or off-the-shelf components provide, but not with the runtime structure, i.e. the processes and threads, of these components and how they use hardware resources. Fig. 7 is a snippet of a concurrency structure of the scenario described by the model in Fig. 6. The support of a concurrency structure model for a thread resource usage model is to make the function or role of threads more explicit showing the code elements or events (see EventThread in Fig. 7) that are executed within them. The construction of concurrency models responds to a concurrency viewpoint [7, 12]. Further information on why and how to construct this type of models for an existing large and complex software-intensive system is part of ongoing work. The scenario described in Fig. 6 represents a dataintensive system functionality where the main concern is the efficient usage of memory resources. Thus, the resource under analysis is memory, for which we choose to use the Working Sets and Handles indicators as the representative information to measure memory usage. On the one hand, the Working Sets indicator represents the actual memory that is used at a given time, rather than the total allocated one. On the other hand, the number of Handles is proportional to the amount of memory used. Thus, variations of this correlation that are not justified by the function of the involved threads may lead to the analysis of the causality of probable inappropriate use of memory resources.
Figure 7. Concurrency information to support resource usage analyis at thread level
253
Authorized licensed use limited to: University of Groningen. Downloaded on December 10, 2009 at 12:26 from IEEE Xplore. Restrictions apply.
We consider that the correlations described by a thread resource usage model can also enable the analysis of bottlenecks and delays but at a finer granularity. Conducting this analysis at this level of detail enables a downstream development activity to communicate or share the results analysis to the internal or external provider that develop or maintain the code elements executed within the given threads V.
mental model, a subsequent analysis is necessary. This may consist of splitting the scenario information into smaller tasks or constructing models at the component or thread level (top-down analysis). When the latter is necessary, the role, domain knowledge, and questions of the involved practitioners will often become more specific, until the analysis helps to determine for instance, the precise nature and causality of inactive periods of a software components and the correlation with the usage of the processor resource when analyzing bottlenecks and delays.
RESOURCE USAGE MODELS IN PRACTICE
Within the validation of our approach, we have constructed models for a resource usage view to support the analysis of the runtime of the software system of our industrial partner, the Philips MRI scanner. The key contribution of this view for practitioners is that it enables the analysis and understanding of variations (peaks and valleys) of resource usage in terms of their specific system elements (e.g., tasks, software components, processes, and threads). This enables the analysis of the causality (relation of cause and effect) of inappropriate resource usage, and helps to address the various concerns within their resource usage viewpoint (see Table 1). In the rest of this section, we describe our observations on how practitioners use a resource usage view and the activities that it supports.
B.
Supporting development activities In overall, the resource usage view that we have constructed contribute to system understanding. On the one hand, we as researchers acquired domain knowledge about the system functionality, design, and implementation. On the other hand, we observed that a resource usage view is often a suitable medium to discuss and transfer technical knowledge between practitioners analyzing it. We have also observed the application of resource usage models to support other specific activities such as the analysis of alternative designs, introduction of new hardware resources, and performance tuning. As part of our experimentation, we have constructed a set of models for the scenario in Fig. 5 using different configurations of the system (alternative designs and implementations). There we learned how practitioners could use resource usage models to analyze alternative designs and implementations towards the detection and correction of bottlenecks and waiting times to improve the performance of the system. We observed that some designs rely on the efficient use of resources, e.g., multicore processors, to achieve certain requirements. Thus, similar to the support of analysis of alternative designs and implementations, resource usage models help to test, verify, and analyze if the implementation is actually using the given resource as is stated in the design specification. Finally, we observed that resource usage models help practitioners to tune and analyze the performance of execution scenarios that involve third party components. As part of this activity, we have constructed the model in Fig. 6, which so far has helped to identify the use of extra memory due to the wrappers that manage the heterogeneity of the code elements executed by the involved threads.
A.
Using a resource usage view In Section IV, we provided descriptions of the correlations described by the models of a resource usage view. Our main observation in how this view helps to address the concerns of a resource usage viewpoint is that practitioners need to complement the described correlations with their own domain knowledge and mental models through several iterations. The domain knowledge and mental models of practitioners include references about the system functionality, the function and implementation of elements such as software components and processes, and physical and mechanical characteristics of the system. For instance, we present a resource usage model that can describe the actual memory budget for the start-up of the software system (see Fig. 4). At first, this model provides an overview of the actual situation. However, practitioners do not take the measured information as the definitive budget; instead, they first use domain knowledge and insights to assess what the causality is for the measured value (e.g., amount of used memory). In this case, the domain knowledge includes references about the functions and communication requirements of the various software components that are initialized within the starting background and starting application software tasks. Another example is the analysis of delays and bottlenecks using the model in Fig. 5. In this case, the domain knowledge used to assess the nature of low processor usage and inactivity periods at the beginning of the scenario involves the references about the influence of the physical phenomena that rules the acquisition of data by the Scanner component. In summary, when the information in a constructed model does not align with the requirements and design decisions of the given scenario (e.g., drastic variations in the described correlations), or it is different from the analyst’s
VI.
RELATED WORK
We consider that the related work of our contribution presented in this paper can be distinguished into two groups. The first group includes architecture reconstruction methods such as Symphony [16]. This method uses architectural concepts such as viewpoints and views, and mapping rules to extract architectural level information from existing software systems. This aspect is the main commonality with our work, but our focus so far is recovering information for the execution architecture using specific execution viewpoints and views, specifically the resource usage viewpoint and view. Furthermore, to construct such execution views, we have exploited the concept of mapping rules to map data in a source view (the collected logging messages, process activity
254
Authorized licensed use limited to: University of Groningen. Downloaded on December 10, 2009 at 12:26 from IEEE Xplore. Restrictions apply.
events, and resource usage measurements) to information in a target view (series of resource usage indicators and the codified runtime activity). The second group includes the existing tools to collect and present resource usage measurements tools [2-4]. As we described in Section I, our observations are that these tools are often used by practitioners, but mainly to conduct online analysis to support corrective maintenance. Although these tools facilitate the collection of resource usage information without any instrumentation and minor overhead, their current visualizations or descriptions of resource usage (e.g., usage curves and histograms, and lifetime of processes and their activities) do not use system-specific design and architecture concepts. This last point limits the use of these descriptions as architecture or design information to support architecture-driven activities when developing large software-intensive systems.
REFERENCES [1] [2] [3] [4] [5] [6]
[7]
VII. CONCLUSIONS AND FUTURE WORK
[8]
Our contribution is that we provide a structured approach to construct a resource usage view that describes the correlation between high-level execution concepts (e.g., tasks of key execution scenarios, software components, processes, and threads) and the usage of hardware resources. Furthermore, we described how to use this view in practice and the need to combine it with specific domain knowledge Technically the graphical representations used in the models of the resource usage view are not much different from visualizations provided by the existing monitoring tools [2-4]. Thus, we consider that other software development organizations and tooling providers can use and implement our process to map runtime information and create similar graphical representations to describe resource usage at different levels of abstraction. Our ongoing work focuses on constructing execution views, including resource usage views, to identify in topdown fashion opportunities for improvement and tuning nonfunctional properties such as performance and ease corrective maintenance. We expect to report more elaborately on these results as part of our future work.
[9]
[10]
[11]
[12]
[13] [14] [15]
[16]
ACKNOWLEDGMENT We would like to thank the Software Architecture Team and the software designers of the MRI system in Philips Healthcare, in particular Sergiy Bachynskyy, Henri Matthijssen, and Harry van de Kerkhof. We also extend our gratitude to Johan Muskens and our Darwin colleagues for their feedback and joint work. This work has been carried out as a part of the Darwin project at Philips Healthcare under the responsibility of the Embedded Systems Institute. This project is partially supported by the Dutch Ministry of Economic Affairs under the BSIK program.
[17]
.netCHARTING, http://www.dotnetcharting.com/ Sysinternals Suite, http://technet.microsoft.com/en-us/sysinternals/bb842062.aspx Windows Performance Analyzer (WPA), http://msdn.microsoft.com/en-us/library/cc305187.aspx LTTng Project, http://ltt.polymtl.ca/ Philips Healthcare - Magnetic Resonance Imaging, February 2009 http://www.healthcare.philips.com/main/products/mri/index.wpd S. Balsamo, A. Di Marco, P. Inverardi, and M. Simeoni, Model-based performance prediction in software development: A survey, IEEE Transactions on Software Engineering, vol. 30, pp. 295--310, 2004. T. B. Callo Arias, P. America, and P. Avgeriou, Defining Execution Viewpoints for a Large and Complex Software-Intensive System, in Joint Working IEEE/IFIP Conference on Software Architecture & European Conference on Software Architecture, 2009. T. B. Callo Arias, P. Avgeriou, and P. America, Analyzing the Actual Execution of a Large Software-Intensive System for Determining Dependencies, in 15th Working Conference on Reverse Engineering, 2008. M. Devarakonda and R. Iyer, Predictability of Process Resource Usage: A Measurement-Based Study on UNIX, IEEE Transactions on Software Engineering, vol. 15, pp. 1579--1586, 1989. ISO/IEC-JTC1/SC7, ISO/IEC 42010 Systems and software engineering - Recommended practice for architectural description of software-intensive systems 2007. J. Muskens and M. Chaudron, Prediction of run-time resource consumption in multi-task component-based software systems, in International Symposium on Component-Based Software Engineering: Springer LNCS, 2004. N. Rozanski and E. Woods, Software Systems Architecture: working with stakeholders using viewpoints and perspectives Addison Wesley 2005. Technet-Microsoft, Memory Object: Core Services, http://technet.microsoft.com/en-us/library/cc778082(WS.10).aspx Technet-Microsoft, Process Object: Core Services, http://technet.microsoft.com/en-us/library/cc780836(WS.10).aspx P. van de Laar, P. America, R. Rutgers, S. van Loo, G. Muller, T. Punter, and D. Watts, The Darwin Project: Evolvability of SoftwareIntensive Systems, presented at 3rd International IEEE Workshop on Software Evolvability 2007. A. van Deursen, C. Hofmeister, R. Koschke, L. Moonen, and C. Riva, Symphony: View-Driven Software Architecture Reconstruction, in 4th Working IEEE/IFIP Conference on Software Architecture: IEEE Computer Society, 2004. T. Wood, L. Cherkasova, K. Ozonat, and P. Shenoy, Profiling and Modeling Resource Usage of Virtualized Applications, in 9th ACM/IFIP/USENIX International Conference on Middleware, 2008.
255
Authorized licensed use limited to: University of Groningen. Downloaded on December 10, 2009 at 12:26 from IEEE Xplore. Restrictions apply.