8th IEEE International Symposium on Applied Computational Intelligence and Informatics • May 23–25, 2013 • Timisoara, Romania
Context dependent maintenance effort estimation: Case study in a small software company Z. Stojanov*, D. Dobrilovic*, J. Stojanov*, V. Jevtic* *University
of Novi Sad, Technical faculty "Mihajlo Pupin", Zrenjanin, Serbia
[email protected],
[email protected],
[email protected],
[email protected] Abstract—This paper presents an approach to software maintenance effort estimation based on the analysis of software maintenance requests available in issue tracking system in a very small local software company. Over 1900 requests, collected during 19 months in 2010 and 2011, were selected for analysis. The approach takes into account: the frequency of submitted user requests for particular periods of time important for organizing work in the company, the existence of maintenance service agreement for clients, the number of programmers assigned to the task associated to each request, and the number of working hours required for requests solving. The approach calculates correlation and establishes linear regression between frequencies of submitted user requests and the average time required for completing requests. This approach estimates an average number of working hours for processing user requests in periods of time that are important for internal company organization. In the paper are also discussed implications for practice and research, and provided recommendations for adapting this approach to other small software companies.
I. INTRODUCTION Maintenance is usually perceived as a set of activities with the aim to ensure proper functioning of software products after delivery. These activities should ensure the quality of products and maintenance. Many studies have reported that software maintenance is the most costly part of the software life cycle [1][2]. According to Boehm and Basili, software maintenance consumes over 70% of the total costs for typical lifecycle of a software product [3]. Solving users' requests, finding and fixing defects, and providing efficient support are very important issues in software maintenance. Software maintenance is typically perceived as being expensive and ineffective [4]. The essential sub-process in software maintenance is related to processing user maintenance requests [5]. Software users that report problems, or request new features in software products usually initiate this process. Estimating the efforts and costs of maintenance request process is very important. Estimations may facilitate planning maintenance activities and cost/benefit analysis. Optimization of time intervals in software maintenance request process is vital for estimation of efforts and costs, and prevention of potential risks. Kenmei et al. [6] stated that the knowledge of how many new requests will arrive in the next week or month is valuable information for estimating and planning maintenance activities. Many factors influence timelines in maintenance request process. Further, timelines of maintenance request process significantly influence the quality of products and
978-1-4673-6400-3/13/$31.00 ©2013 IEEE
services offered to clients. Maintenance effort estimations are usually related to person-hours, or the actual working hours, used to perform maintenance tasks. Although expert based effort estimations and predictions are acceptable in some cases, objectivity and the higher accuracy require quantitative analysis of factors that influence maintenance activities [7]. Effort estimation models are derived from effort data that are usually available in maintenance repositories. Effective estimation models can improve the practice in software industry. Although many studies have reported researches related to effort estimation in software maintenance, there are no studies on the maintenance effort estimation in very small software companies according to our knowledge. Existing studies are based on historical data collected from opensource software repositories or from large software companies. However, small software companies are dominant in economies across the globe [8]. Laporte et al. [9] reported that in Europe, 85% of IT sector companies have between 1 and 10 employees. Qualitative empirical study about the maintenance practice in local small software companies revealed that they face many problems, both technical and organizational [10][11][12]. Therefore, practice assessment and improvement in these companies require more attention. This paper presents an approach to maintenance effort estimation in a very small software company. This study is a part of a large project (from 2011 to 2014) with the aim to assess and improve maintenance practice in the selected software company. Records collected in the company through practice observation, interviews with programmers, and analysis of company documents and maintenance repository revealed that software maintenance consumes the majority of the daily working hours for all programmers. In addition, most of the maintenance activities are related to solving user requests. Therefore, the goals of this study are to investigate the relationships between the frequency of maintenance requests and the average number of working hours required to solve them, and to propose a model for estimating the average number of working hours for the known frequency of requests. The main characteristic of this study is that it takes into account time periods that are important for internal work organization in the company. These time periods are used to classify data extracted from the maintenance repository, and to provide effort estimation models for the most important time periods. II. RELATED WORKS Traditional approaches for maintenance effort estimation are typically based on mathematical models
– 461 –
Z. Stojanov et al. • Context Dependent Maintenance Effort Estimation: Case Study in a Small Software Company
that use quantitative data from the large number of records observed during the specific periods of time. Two types of studies can be found in literature: studies that deal with strictly managed software or closed-code software, and studies that deal with open-source software. Data are usually collected from issue tracking systems, defect tracking tools and defect repositories such as CVS or Bugzilla. These repositories enable easy access to large amount of historical data that can be used in empirical researches [13]. Majority of published studies provide prediction and estimations models for various time intervals in request processing. Niessink and Van Vliet used principal components analysis and regression analysis to explore relationships between characteristics of change requests and the effort needed to implement them [14]. Measurement was implemented in the maintenance departments of two immature organizations that did not applied defined maintenance process. Authors performed multivariate regression analysis to investigate if the factors found in the principal components analysis could be used to explain the effort spent on the change requests. Based on analysis results, Niessink and Vliet concluded that the existence of a consistently applied process is an important prerequisite for efficient measurement of software maintenance effort. Leung [15] presented a method to estimate maintenance project effort using an improved version of analogy. Method uses two nearest neighbors of the target project for estimation, and refinement based on the relative location of the target project. Method, called analogy with virtual neighbor (AVN), consists of two stages: development of cost driver and effort estimation, and project estimation based on the relationship identified in the first step. Case study for method evaluation used historical data from 20 past projects. The study found 14 relevant cost-drivers as necessary for the estimation, end proposed linear relationship between cost drivers and expanded actual effort. Lucia et al. [16] presented estimation model based on multiple linear regression analysis for corrective maintenance in a major international software enterprise. For experimental validation, comparison and assessment of the model, they used a data set obtained from different corrective maintenance projects. Maintenance projects were mainly legacy business applications for various business fields, prevalently written in COBOL. In addition, customers often ask for very high service level agreement, which require allocation of very skilled maintainers. The study consisted of two phases: the first phase was construction of effort estimation models validated against real data, while the second phase was replicated assessment of developed effort estimation models. According to the authors of the study, the performance of maintenance effort estimation model can be improved if the types of the different maintenance tasks are taken into account. Yu [17] reported a research study that includes examination of maintenance data from closed-source software projects from NASA SEL, and constructs two different maintenance effort models for open-source software project based on linear regression. Models are based on strictly managed maintenance data such as the effort to identify the problem, to make the changes, and to test the correctness of the changes. Two measures are
identified: lag time (the time between starting and closing a maintenance task) and source code change (the amount of source code change in one maintenance task that indirectly represent the effort). Correlation analysis is performed in order to validate their relationships with maintenance effort. Analysis revealed that there are positive linear correlations between the maintenance effort and lag time, the maintenance effort and the number of lines changed, and the maintenance effort and the number of modules changed. A holistic approach towards a study of the factors affecting the effort involved in maintenance of existing software systems is presented in [18]. Effort estimation model includes various factors. However, the model is directly influenced by software baseline characteristics and maintenance team capability, while customer attitude and management attitude indirectly influence effort estimation. This model suggests that estimation model should encompass not only technical data available in maintenance repositories, but also organizational and human issues. The main assumption is that programmers that are familiar with the history of particular software application will provide more reliable maintenance services to clients. III.
CONTEXT
Understanding developed estimation model requires insight into the organizational context where the study is conducted. This research was realized in a very small software company with seven employees, six programmers and one technical secretary. Five programmers work on tasks related to development and maintenance of specific software applications for clients, while one programmer is assigned only to develop and maintain internal software systems. The company provides maintenance support for over 30 business software applications used by local clients in Serbia. Clients are classified in two groups: those with and without signed Maintenance Service Agreement (MSA). Software development and maintenance activities are organized in the way that one or more programmers are assigned to each software application. When a maintenance request (MR) is received from a client, the first step is to identify software application, and after that to forward a request to a programmer from a set of assigned programmers. Assignment of more than one programmer to a software application increases the chances for speedy processing of requests. This is especially important in the cases when a programmer is busy with other activities and cannot accept a request. In such cases, another programmer from associated group of programmers will accept a request. Each request may be solved by one programmer, or by a set of programmers assigned to software application. The software maintenance workload in the company is primarily influenced by user demands for maintenance and distribution of responsibilities among programmers. A. Periods of time important for request processing Periods of time, important for processing user requests are determined by internal organizational policies in the company. The first rule is to process and solve all requests as fast as it is possible, which means during the day when they are received. All requests that are not processed immediately are forwarded to the next regular working
– 462 –
8th IEEE International Symposium on Applied Computational Intelligence and Informatics • May 23–25, 2013 • Timisoara, Romania
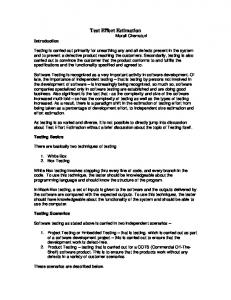
meeting that is scheduled for each Monday in the morning. This implies that the next important time interval for processing requests is within a week (2-7 days). The third important time interval is current month because a company should pay taxes for all provided services on the monthly basis (8-30 days). Other intervals selected for analysis are three months (31-90 days), a year (91-365 days) and over a year. B. Issue tracking system in the company Each client request is recorded, dispatched and tracked formally. An internal web based application for issue tracking was developed in the company and used since 2008. The system is designed to enable tracking of all tasks in the company. Each client request has associated task and working order. This enables tracking the effort spent by each programmer in the company on all tasks. It is important to note that issue tracking system does not contain only records for clients maintenance requests, but also records for all other, non-maintenance, activities. However, analysis of all records for the period from May 2010 to November 2011 reveals that 1896 tasks of totally 2252 tasks are related to software maintenance (84%), while 356 tasks are related to other activities (16%). This ratio is consistent with data presented in the literature [3]. A period of 19 months that begins two years after introducing the issue tracking system in the company is selected for analysis. Discussions with programmers in the company confirmed that all developers are accustomed in using the system, which ensured extraction of more reliable data. Monthly distribution of maintenance requests for clients with MSA and without MSA is presented in figure 1. IV.
APPROACH
The approach includes the following steps: • Extracting relevant data from the internal repository for tracking issues. • Splitting the data set into non-overlapping time frames based on important time intervals for the company business. • Calculating the local trends for the number of completed requests and the average number of working hours for all intervals, considering the number of available programmers. • Determining the correlation between the number of completed requests for all intervals and the average number of working hours required for solving those requests. • Establishing linear regressions for correlated data in selected time intervals. • Estimating the average number of working hours for new requests based on calculated determination coefficients, end estimation errors. Two sources of data were used for analysis: documents containing description of organizational structure of the company, and data extracted from the internal repository by using SQL script. From company documents were extracted data about programmers’ assignments to software applications, and the list of clients that have MSA. These data were entered into Microsoft Excel tables and later used with data extracted from the repository. Internal maintenance repository contains data about user
Figure 1. Monthly distribution of completed maintenance requests
requests and other entities that are necessary to track all activities associated to each request. Data was extracted from tables UserRequest, Worker (programmers), SoftwareApplication, User (clients) and WorkOrder. The next step in the analysis was creation of data series that are suitable for analyzing trends in extracted data. Based on extracted dates (\texttt{RecDate} - the date when a request is received from a client and recorded in the repository, \texttt{ComplDate} - the date when a programmer completes all tasks associated to a request) request processing or completion time (ComplTime) for each request was calculated as ComplTime = ComplDate - RecDate. A. Splitting data into non overlapping time intervals Trends are analyzed for the following calculated data series: completion time and total working hours for completed requests. Trends analysis should stress behavior patterns of extracted historical data and help in future trends estimation. Buglear [19] defined a trend as a overall movement in the data, and suggested decomposing data series into parts that are suitable for analysis. Trend analysis is based on data from observed periods that are unique for observed population [20]. In this study, trend analysis is based on observing data in unique time periods specific for company business. All periods are determined by company internal organization and proposed regulation at the national level. Maintenance requests are classified in observed time periods based on the value of completion time (ComplTime). The number of completed requests in selected time periods is presented in table 1. The first column presents numbers of requests submitted by clients with MSA, while the second column presents numbers of requests submitted by clients without MSA.
– 463 –
TABLE I. DISTRIBUTION OF COMPLETED REQUESTS IN UNIQUE PERIODS OF TIME IMPORTANT FOR COMAPNY BUSINESS
Period of time 1 day 2-7 days 8-30 days 31-90 days 91-365 days Over 365 days
MSA clients 678 422 146 33 5 1
Non MSA clients 281 236 76 17 1 0
Z. Stojanov et al. • Context Dependent Maintenance Effort Estimation: Case Study in a Small Software Company
TABLE II. THE FREQUENCIES OF REQUESTS FROM USERS WITH MSA IN
TABLE IV. THE FREQUENCIES OF REQUESTS FROM USERS WITHOUT MSA IN
IDENTIFIED TIME INTERVALS
IDENTIFIED TIME INTERVALS
Programmers 1 2 3 4
1 12 163 382 121
2-7 7 97 229 89
Time intervals 8-30 31-90 4 1 44 5 79 23 19 4
91-365 0 0 3 2
Programmers 1 2 3 4
>365 0 0 1 0
1 0.96 1.22 1.25 0.99
2-7 1.14 1.58 1.33 1.33
Time intervals 8-30 31-90 0.50 3.00 1.72 2.80 1.69 3.59 2.00 0.75
91-365 0.00 0.00 14.67 4.50
2-7 5 65 132 34
Time intervals 8-30 31-90 2 0 23 5 38 8 13 4
91-365 0 0 1 0
>365 0 0 0 0
TABLE V. THE AVERAGE NUMBER OF WORKING HOURS FOR REQUESTS FROM USERS WITHOUT MSA IN IDENTIFIED TIME INTERVALS
TABLE III. THE AVERAGE NUMBER OF WORKING HOURS FOR REQUESTS FROM USERS WITH MSA IN IDENTIFIED TIME INTERVALS Programmers 1 2 3 4
1 11 74 146 51
Programmers 1 2 3 4
>365 0.00 0.00 3.00 0.00
The next parameter that was included in the analysis is the number of programmers that were assigned to software application for which a request is received. It is worthwhile to note that each programmer is included in several different teams for maintenance with one, two, three or four members. Regardless of the number of team members, one programmer from the team solved the majority of requests. However, in some cases all team members work together on solving a request. Trends for frequencies and the average number of working hours for requests classified in the identified time intervals respectively are presented in tables 2 and 3. These tables contain data for requests originated from users that have signed MSA, classified according to the number of programmers that participate in request solving. The similar trends for requests that originate from users without signed MSA are presented in tables 4 and 5. B. Determining correlation between requests frequencies and the average number of working hours Regression analysis is based on two steps: determining correlation between two variables, and establishing simple linear regression for variables [21]. Since the goal of the study is to define a model that estimates an average number of working hours for solving user maintenance requests in the specific context, correlation is determined between appropriate values in columns that contain frequencies of user requests and the calculated average time for requests that exists in the repository. This practically means that correlation coefficient R is determined for all identified time intervals, and for both clients with and without MSA. Correlation coefficient reflects the degree of linear association between two observed variables [22][23]. Since the number of requests is negligible for time intervals that last over 30 days, correlation coefficients are calculated only for time intervals that are shorter or equal to 30 days (one month). Microsoft Excel was used for calculations [23]. Independent or predictor variable for regression analysis is the frequency of completed requests in selected time intervals, while variable for which we would like to estimate values is the average number of working hours required for completing requests. Therefore, correlation coefficients are calculated for values in corresponding
1 0.55 1.14 1.08 0.98
2-7 1.50 1.43 1.48 1.15
Time intervals 8-30 31-90 3.00 0.00 2.93 1.70 2.84 3.88 1.15 1.50
91-365 0.00 0.00 6.00 0.00
>365 0.00 0.00 0.00 0.00
TABLE VI. CORRELATION COEFFICIENT R, COEFFICIENT OF DETERMINATION R2 AND SEE FOR CLIENTS WITH MSA IN IDENTIFIED TIME INTERVALS Time interval 1 2-7 8-30
R 0.83 0.33 0.51
R2 0.69 0.11 0.26
SEE 0.10304270 0.20835185 0.70178689
TABLE VII. CORRELATION COEFFICIENT R, COEFFICIENT OF DETERMINATION R2 AND SEE FOR CLIENTS WITHOUT MSA IN IDENTIFIED TIME INTERVALS Time interval 1 2-7 8-30
R 0.75 0.26 0.19
R2 0.56 0.07 0.04
SEE 0.21743654 0.19248448 1.06891936
columns in tables 2 and 3 for clients with MSA, and for values in corresponding columns in tables 4 and 5 for clients without MSA. Prediction or estimation in linear regression can be done by analyzing coefficient of determination R2 [19]. However, some authors have discussed potential problems and pitfalls in interpreting the R2 for reliable predictions in regression analysis, and propose modification of R2 coefficient or considering some additional parameters in order to increase the reliability of the prediction [24][25]. Therefore, in this study both R2 and Standard Error of Estimate (SEE) for established linear regressions in all time intervals are calculated. Values of R2 and SEE are used for judging estimation accuracy. Table 6 presents correlation coefficient R, coefficient of determination R2 and SEE for identified time intervals for clients with MSA. Table 7 presents correlation coefficient R, coefficient of determination R2 and SEE for identified time intervals for clients without MSA. C. Establishing linear regressions Correlation coefficients presented in tables 6 and 7, calculated for time intervals of interest for company internal organization, confirm that the relationship between requests frequency and the average number of working hours is strong only for requests solved within the first day. Correlation coefficients for requests solved within the first day are: 0.83 for clients with MSA, and 0.75 for clients without MSA. For other time intervals, correlation coefficients are smaller, which indicates weaker relationships. Therefore, further analysis that
– 464 –
8th IEEE International Symposium on Applied Computational Intelligence and Informatics • May 23–25, 2013 • Timisoara, Romania
Figure 3. Linear regression for clients without MSA within the first day
Figure 2. Linear regression for clients with MSA within the first day
includes drawing scatter plots and regression trend lines is limited only for this interval. For regression line, independent variable X is the frequency of maintenance requests, while predicted or dependent variable Y is the estimated average number of working hours. Scatter plot and regression line for clients with MSA during the first day are presented in figure 2. Regression line is defined with equation 1 y = 0.0008x + 0.968.
(1)
Scatter plot and regression line for clients without MSA during the first day are presented in figure 3. Regression line is defined with equation 2 y = 0.0035x + 0.6889.
(2)
Correlation coefficients and regression lines were calculated by using formulas from [19]. D. Model for estimating the average number of working hours for new requests Estimation of the average number of working hours, presented with equations 1 and 2 for requests solved within the one day, for the given requests frequencies is based on data presented in tables 6 and 7. However estimation is based not only on values of correlation coefficients R, but also includes values of coefficient of determination R2 and standard error of estimation for regression analysis SEE. High correlation coefficient indicates strong relationship. This is the case only for requests that are solved within the first day. For both requests from clients with MSA and without MSA correlation coefficients are larger than 0.7. Correlation coefficient for requests that originate from clients with MSA is 0.83, and the determination coefficient value of 0.69 provides very good estimation of the future average number of working hours. For this class of requests, standard error of estimation is 0.10304270, which indicates that the model presented with equation 1 can provide reliable estimation. The similar situation is with requests that originate from clients without MSA. For this class of requests correlation coefficient is 0.75. Determination coefficient with value 0.56, and the value 0.21743654 for standard error of estimation also provide acceptable estimation for the model defined with equation 2. For other time intervals, estimations are not reliable. This standing is confirmed with high values of standard errors of estimations.
E. Discussion of results in the company Calculated quantitative values were discussed with management and leading programmers in the company. These discussions were organized as feedback meetings [26] during the assessment of current practice in the company. The discussions confirmed the findings from quantitative analysis. Estimation model is reliable for requests that are received and solved within the first day, and acceptable for requests solved within the seven days, for both clients with and without MSA. V.
THREATS TO VALIDITY
According to guidelines for empirical research in software engineering [27], limitations and validity of any empirical study should be discussed. Discussion on validity includes internal and external validity of the study. The major internal threat to validity is related to complexity of maintenance tasks that influence the time necessary for processing of requests. More precise estimations will include task complexity as a parameter in the analysis. However, this parameter is not considered in this analysis, because in the company does not exists the predefined scale that can be used to distinguish tasks based on their complexity. This analysis will be possible after improving the maintenance request processing. The threat to the external validity primarily is related to applicability of this estimation model in other industrial settings. It is evident that the model is context dependent and assumes a specific internal organization of the software company. However, the approach could be adapted to other small software companies, by considering their internal organization. The analysis process represented in this study could be also adapted to other, preferably small software companies or small teams. Subsequent applications of this approach would provide evidence about its validity and usefulness. VI. CONCLUSIONS In this paper, an approach for estimating the maintenance effort in a very small software company is proposed. Model, presented with equations 1 and 2, enables estimation of the average number of working hours for solving further requests, which in the literature is considered as direct maintenance effort model. Presented model is adjusted to the local context in the company, which improves model accuracy. Model defines correlation between requests frequencies and the average number of working hours per request for identified time intervals important for company organization. Linear
– 465 –
Z. Stojanov et al. • Context Dependent Maintenance Effort Estimation: Case Study in a Small Software Company
regression analysis is applied and resulted in estimation model that is reliable for requests that are solved in short time intervals (less than a week). The main contribution of this study is presented context-based approach that includes parameters such as: defined time intervals for processing requests, the number of assigned programmers, and existence of MSA. The influences of these parameters have not been investigated in previously published studies on estimating maintenance effort. The approach is designed for small software companies or teams. It can be tailored to other similar settings in small companies. Findings of this research contain lessons that can be used by software practitioners in small software companies in order to assess and improve their decision-making and maintenance requests processing. In addition, researchers can find some useful guidelines on how to investigate the influence of various context specific parameters for effort estimation in maintenance requests processing. Further work includes studying the influence of other context specific factors on maintenance effort estimation, triangulation of various analysis methods on the same data set in order to define more precise and comprehensive estimation models, and adaptation of this approach to similar small companies.
[8] [9]
[10]
[11]
[12]
[13]
[14]
[15] [16]
ACKNOWLEDGMENT Ministry of Education and Science, Republic of Serbia, supports this research under the project “The development of software tools for business process analysis and improvement”, project number TR32044, 2011-2014.
[17]
[18]
REFERENCES [1] [2]
[3] [4]
[5]
[6]
[7]
K. H. Bennett and V. T. Rajlich, “Software maintenance and evolution: a roadmap,” in Proceedings of the Conference on The Future of Software Engineering (ICSE ’00), 2000, pp. 73–87. F. J. Pino, F. Ruiz, F. Garcia a, and M. Piattini, “A software maintenance methodology for small organizations: Agile_mantema,” Journal of Software: Evolution and Process, vol. 24, no. 8, pp. 851–876, 2012. B. Boehm and V. R. Basili, “Software defect reduction top 10 list,” Computer, vol. 34, no. 1, pp. 135–137, January 2001. A. April and A. Abran, “A software maintenance maturity model (s3m): Measurement practices at maturity levels 3 and 4,” Electronic Notes in Theoretical Computer Science (Proceedings of the International Workshop on Software Quality and Maintainability (SQM 2008)), vol. 233, pp. 73–87, 2009. A. Abran, P. Bourque, R. Dupuis, J. W. Moore, and L. L. Tripp, Eds. Guide to the Software Engineering Body of Knowledge (SWEBOK). Piscataway, NJ, USA: IEEE Press, 2004. B. Kenmei, G. Antoniol, and M. di Penta, “Trend analysis and issue prediction in large-scale open source systems,” in Proceedings of the 2008 12th European Conference on Software Maintenance and Reengineering, ser. CSMR ’08, Athens, Greece, 2008, pp. 73–82. M. Jørgensen, “Experience with the accuracy of software maintenance task effort prediction models,” IEEE Transactions on Software Engineering, vol. 21, no. 8, pp. 674–681, 1995.
[19] [20] [21] [22]
[23] [24] [25]
[26]
[27]
– 466 –
I. Richardson and C. G. von Wangenheim, “Guest editors’ introduction: Why are small software organizations different?” IEEE Software, vol. 24, no. 1, pp. 18–22, 2007. C. Y. Laporte, A. Renault, S. Alexandre, and T. Uthayanaka, “The application of iso/iec jtc 1/sc7 software engineering standards in very small enterprises,” ISO Focus, pp. 36–38, September 2006. Z. Stojanov, “Discovering automation level of software change request process from qualitative empirical data,” in Proceedings of the 6th IEEE International Symposium on Applied Computational Intelligence and Informatics, SACI 2011, Timisoara, Romania, 1921 May 2011, pp. 51–56. Z. Stojanov, D. Dobrilovic, and V. Jevtic, “Identifying properties of software change request process: Qualitative investigation in very small software companies,” in Proceedings of the 9th IEEE International Symposium on Intelligent Systems and Informatics, SYSI 2011, Subotica, Serbia, 8-10 September 2011, pp. 47–52. Z. Stojanov, “Using qualitative research to explore automation level of software change request process: A study on very small software companies,” Scientific Bulletin of The Politehnica University of Timisoara, Transactions on Automatic Control and Computer Science, vol. 57 (71), no. 1, pp. 31–40, March 2012. R. Hewett and P. Kijsanayothin, “On modeling software defect repair time,” Empirical Software Engineering, vol. 14, no. 2, pp. 165–186, 2009. F. Niessink and H. Van Vliet, “Two case studies in measuring software maintenance effort,” in Proceedings of the International Conference on Software Maintenance, ser. ICSM ’98, Bethesda, Maryland, USA, March 16-19 1998, pp. 76–85. H. Leung, “Estimating maintenance effort by analogy,” Empirical Software Engineering, vol. 7, no. 2, pp. 157–175, 2002. A. D. Lucia, E. Pompella, and S. Stefanucci, “Assessing effort estimation models for corrective maintenance through empirical studies”, Information and Software Technology, vol. 47, no. 1, pp. 3–15, 2005. L. Yu, “Indirectly predicting the maintenance effort of opensource software,” Journal of Software Maintenance and Evolution: Research and Practice, vol. 18, no. 5, pp. 311–332, 2006. P. Bhatt, G. Shroff, and A. K. Misra, “Dynamics of software maintenance,” ACM SIGSOFT Software Engineering Notess, vol. 29, no. 5, pp. 1–5, September 2004. J. Buglear, Stats means business: a guide to business statistics. Oxford, UK: Buttworth-Heinemann, 2001. L. Kish, Statistical Design for Research. Hoboken, NJ, USA: John Wiley & Sons, Inc., 2005. M. P. Allen, Understanding Regression Analysis. New York, USA: Springer US, 1997. C. A. Tompkins, “Using and interpreting linear regression and correlation analyses: Some cautions and considerations,” in Clinical Aphasiology Conference, vol. 21. Destin, FL, USA: ProEd, June 1991, pp. 35–46. T. Quirk, Excel 2010 for Educational and Psychological Statistics: A Guide to Solving Practical Problems. New York, NY, USA: Springer New York, 2012. I. S. Helland, “On the interpretation and use of r2 in regression analysis,” Biometrics, vol. 43, no. 1, pp. 61–69, 1987. S. Brown, K. Lo, and T. Lys, “Use of r2 in accounting research: measuring changes in value relevance over the last four decades,” Journal of Accounting and Economics, vol. 28, no. 2, pp. 83–115, 1999. T. Dyba, T. Dingsoyr, and N. B. Moe, Process Improvement in Practice - A Handbook for IT Companies, ser. International Series in Software Engineering. Norwell, MA, USA: Kluwer Academic Publishers, 2004, vol. 9. F. Shull, J. Singer, and D. I. Sjøberg, Eds., Guide to Advanced Empirical Software Engineering, 1st ed. London, UK: SpringerVerlag London, 2007.