Feb 28, 2017 - Jie Zhao, Jhih-Shian Lee, Hang Xu, Kai Xu, Zi-Hui Ren, Jyh-Cheng Chen, and Cheng-Han Wu. AbstractâReducing the noise associated with ...
IEEE TRANSACTIONS ON NUCLEAR SCIENCE, VOL. 64, NO. 1, JANUARY 2017
705
Scanner-Dependent Threshold Estimation of Wavelet Denoising for Small-Animal PET Jie Zhao, Jhih-Shian Lee, Hang Xu, Kai Xu, Zi-Hui Ren, Jyh-Cheng Chen, and Cheng-Han Wu
OSITRON emission tomography (PET) is a noninvasive nuclear medicine technique that provides quantitative imaging of metabolic changes and biochemical processes in patients. PET has recently become more significant, and it is an important part of clinical diagnosis and preclinical research. Owing to the genetic similarity of small animals to humans, the value of using molecular imaging on small animals by means of PET is widely recognized as an important aspect of preclinical research and drug development. However, there are
two major technical restrictions that affect the measurements obtained using small-animal PET; these limitations are the low spatial resolution and low signal-to-noise ratio (SNR). During PET, the raw data is often corrupted by noise. The noise can generally be characterized into two classes, namely, random noise and structured noise. Structured noise refers to nonrandom variations in counting rate. Random noise, also called statistical noise or quantum mottle, obeys Poisson statistics [1]. Because it is impossible to produce a completely noise-free PET image, there must often be a trade-off made between noise removal and the preservation of low-contrast detail within the image [2]. During small-animal PET, the SNR is usually low; moreover, the low activity of the injected radiopharmaceutical dose and the need to use a short scanning time may exacerbate the problem of noise. Consequently, noise reduction as part of the small-animal PET approach is both an important and challenging task for researchers. Wavelet transform (WT) was developed from Fourier transform (FT). The thesis behind WT was introduced by Haar in 1910 [3]. It was first applied as a mathematical tool by a French scholar, J. Morlet, in 1989. One of the relevant properties of WT is its ability to capture the energy of a signal in a few energy transform values [4], thus allowing the researcher to obtain a sparse representation of the initial signal [5]. The characteristics of WT indicate that it is feasible to apply WT to small-animal PET image denoising [6], [7]. The first practical wavelet denoising (WD) method was named Visushrink, and it was outlined by Donoho in 1994 [8]; as part of this approach, a universal threshold was defined as � �� �� (1) Threshold = (Median �Wij � /0.6745) (2× ln M),
Manuscript received January 18, 2016; revised March 24, 2016, June 15, 2016, and September 18, 2016; accepted October 7, 2016. Date of publication October 11, 2016; date of current version February 28, 2017. (Corresponding author: J.-C. Chen.) J. Zhao is with the School of Medical Imaging, Xuzhou Medical College, XuZhou, China and also with the Department of Biomedical Imaging and Radiological Sciences, National Yang-Ming University, Taipei 112, Taiwan and also with the School of Information and Electrical Engineering, China University of Mining and Technology, XuZhou, China. J.-S. Lee and C.-H. Wu are with the Department of Biomedical Imaging and Radiological Sciences, National Yang-Ming University, Taipei 112, Taiwan. H. Xu and K. Xu are with the School of Medical Imaging, Xuzhou Medical College, XuZhou, China. Z.-H. Ren is with the School of Information and Electrical Engineering, China University of Mining and Technology, XuZhou, China. J.-C. Chen is with the Department of Biomedical Imaging and Radiological Sciences, National Yang-Ming University, Taipei 112, Taiwan, and also with the Biophotonics and Molecular Imaging Research Center, National Yang-Ming University, Taipei 112, Taiwan. Digital Object Identifier 10.1109/TNS.2016.2616364
where wij are the finest scale wavelet coefficients and M is the size of the matrix. This approach utilizes a global threshold and a thresholding function with a fixed structure, and as a result, it is an efficient WD method [9]. The Visushrink method is an efficient WD method for PET images; however, this method also has a number of disadvantages. The use of a universal threshold results in image blurring, and features are lost as a result of discarding the decomposition coefficients. Notwithstanding the above limitations, WD methods have shown remarkable success over the last ten years. Recently, several new and more powerful denoising techniques based on wavelet transform have been developed [5], [7], [10]. Generally, these approaches can produce better denoising results than the Visushrink method. These new methods utilize local or adaptive thresholds and thresholding functions, which have complicated mathematical structures and thus require
Abstract— Reducing the noise associated with small-animal positron emission tomography (PET) images is an important and challenging task. Recently, several hybrid denoising techniques based on wavelet transform (WT) have been developed. However, these hybrid methods have complicated mathematical structures and require complex parameter estimations, and they therefore require a high level of manual intervention. Under such circumstances, good performance with respect to image quality using these new methods would only seem to be achievable with an increased computational burden. In this paper, we propose a novel wavelet denoising (WD) method. This method is based on scanner-dependent threshold estimation and the Visushrink method. The method provides a compromise between computational burden and image quality. The experimental results indicate that the proposed method is better than the Visushrink method. Compared with the Visushrink method, the proposed method provides good image quality at higher decomposition levels. In terms of usability and efficiency, the proposed method is better than the hybrid method. The proposed WD method also has several useful properties; therefore, it is possible that it might become an alternative solution to reducing the noise associated with small-animal PET images. Index Terms— Image denoising, positron emission tomography (PET), small animal imaging, wavelet denoising (WD).
I. I NTRODUCTION
P
0018-9499 © 2016 IEEE. Personal use is permitted, but republication/redistribution requires IEEE permission. See http://www.ieee.org/publications_standards/publications/rights/index.html for more information.
706
IEEE TRANSACTIONS ON NUCLEAR SCIENCE, VOL. 64, NO. 1, JANUARY 2017
Fig. 2. Fig. 1.
Flowchart of the conventional WD method.
complex parameter estimations. Thus, better performance of these new methods in terms of image quality is achieved only with an increased computational burden and decreased usability. However, usability and efficiency are both important factors when considering systems used in the real world. In this paper, a novel method of threshold estimation involving the wavelet approach is proposed for small-animal PET image denoising. After pre-scanning a phantom using a small-animal PET scanner, the threshold values are estimated. The threshold values have unique characteristics when performing small-animal PET. Next, the threshold group is used for WD of the images, all of which were acquired by the same PET scanner. The method provided a compromise between computational burden and image quality. Using a straightforward preprocess for threshold estimation, the conventional WD method could be improved. The modified WD method inherits the good characteristics of the Visushrink method and overcomes a number of its shortcomings. II. M ETHODS A. Wavelet Denoising A WD approach purposely for PET images, based on the classical Visushrink method, was proposed by Yen-Yu Shih. Based on the features associated with PET images, the use of the Visushrink method with optimized parameters was reported [11]. Within wavelet transformation, stationary wavelet transform (SWT) is more effective than discrete wavelet transform (DWT). In terms of wavelet type, Daubeshies wavelet was selected. Regarding thresholding policy, soft thresholding was found to be better than hard or hyperbolic thresholding. When the tests in this paper were performed using the Visushrink method, the process involved the use of the parameters mentioned above. The procedure used by the Visushrink method is illustrated in Fig. 1 and consisted of the steps as indicated. I’ denotes the noisy image to be decomposed by wavelet transform (WT), while CI ’ denotes the resulting wavelet coefficients, and C’IWD denotes the residual coefficients after suitable thresholding of wavelet coefficients. During this process, noise can be removed by discarding coefficients that are insignificant relative to the chosen threshold. The product of this process is I’WD , which is obtained via an inverse WT of the remaining coefficients. As Eq. (1) shows, wij are the WT coefficients of the first sub-band identified using the Visushrink method, and in these
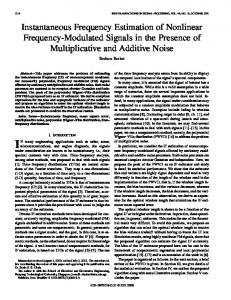
Flowchart of the scanner-dependent threshold estimation.
circumstances, the global threshold discards the decomposition coefficients. Many new WD methods and wavelet-based hybrid methods have been proposed to overcome the above drawbacks [5], [7], [10], [12]–[14]. When these methods of threshold estimation have been employed as part of WD and various wavelet-based denoising methods, the results have been quite good. Nevertheless, the superior performance of these new methods is achieved at a price, namely an increased computational burden. A hybrid method for small-animal PET images was reported by Mejia in 2015 [15]. The Mejia method gave an awesome performance regarding image quality. However, one drawback of the algorithm was the processing time. B. Scanner-dependent Threshold Estimation When undertaking preclinical studies in a real environment, a good method must have procedures and operations that are both fixed and simple to perform. As a powerful mathematic tool, a good algorithm also must consist of as few manual interventions as possible, as well as involving the least possible amount of computational effort. Considering the above factors, a scanner-dependent WD method is proposed in this study. A group of thresholds can be estimated based on data that have already been acquired, namely by pre-scanning a phantom using the same small-animal PET system. Fig. 2 displays the procedure used for the threshold group estimation. In this figure, I’f denotes the noisy image that is decomposed by WT, while C’If denotes the resulting wavelet coefficients, and C’IfWD denotes the residual coefficients after suitable thresholding of the wavelet coefficients. Furthermore, If denotes the noise-free image, and CIf denotes the corresponding wavelet coefficients. Finally, I’f and If are PET images of the same physical phantom (in the following subsections, a detailed description of phantom is provided), using the same small-animal PET system but with a different scanning time. Specifically, If is an image obtained using one hour of scanning time, which is longer than the standard time used for this system. Thus, we assume that If is the reference image, the noise of which can be ignored in this study. If ’ is the relevant noisy image in which the noise is important. During the WD conventional procedure, a noisy image and a threshold or thresholds are always used as the input and parameters, respectively. The purpose of WD is to acquire a noise-free image or at least an image with minimized noise. Thus, a noisefree image is the best output possible and the one that we pursue. In this case, I’f and If are counterparts of the input and
ZHAO et al.: SCANNER-DEPENDENT THRESHOLD ESTIMATION OF WAVELET DENOISING FOR SMALL-ANIMAL PET
Fig. 3. Cold-spot Mini Deluxe PhantomTM . (a) The physical phantom was scanned by a high resolution optical scanner. (b) The image segmented from Fig. 3(a), with the size of rods and the imaginary lines for image rotation shown. (c) The simulated noise-free digital phantom. (d) The simulated noisy digital phantom.
707
Fig. 5. Simulated point phantom. (a) The simulated noisy point phantom. (b) First row shows the results, which were processed by the Visushrink method using different numbers of decomposition levels. Second row shows the results, which were processed by the proposed method using different numbers of decomposition levels.
Fig. 4. Simulated Sheep-Logan phantom. (a) The simulated noisy Sheep-Logan phantom. (b)First row shows theresults, which were processed by the Visushrink method using different numbers of decomposition levels. Second row shows theresults, which were processed by the proposed method using different numbers of decomposition levels. Fig. 6. Images of cold-spot Mini Deluxe PhantomTM were acquired by small-animal PET with different scanning times.
output of the system, respectively. As a parameter, a threshold can be derived reversely from the relevant CIf and C’IfWD . Furthermore, the root mean square error (RMSE) can be minimized to derive in a reverse manner a group of thresholds TN . Specifically, CIf and C’IfWD consist of several subbands; therefore, each threshold will correspond to a given subband: � � n
�2 � � n, (2) wij −w RMSE = � ij
i=1
where wij is the coefficient of CIf , and w’ij is the coefficient of C’IfWD . Based on the Visushrink method, the proposed groups of thresholds replace the universal threshold, and the remaining parts remain the same. How this modified WD method performs in practice with regard to image quality is described in next section. C. Evaluation Study 1) Digital Phantom Simulation: In this study, four digital phantoms were simulated by MATLAB using a 256 × 256 matrix. Fig. 3 shows the two digital phantom images used. These were simulated based on the cold-spot Mini Deluxe PhantomTM; specifically, one is considered to be noise-free, while the other is considered to be noisy. These two simulated images were then used for the estimation of the group of thresholds. In addition, a simulated noisy Shepp-Logan phantom (Fig. 4) and a simulated noisy point phantom (Fig. 5) were also created, which were then used to validate the proposed WD method during the initial part of the study.
Using the cold-spot Mini Deluxe PhantomTM , both noise-free and noisy digital Mini Deluxe PhantomTM images were created by performing the following steps. First, we transformed the digital phantom image into the form of a sinogram using Radon transformation. Second, we reconstructed the image using Inverse Radon transformation. After the above steps were performed, we obtained the first digital phantom image, which was considered to be the noise-free PET image. As a final step, Poisson noise was added to the sinogram, followed by the digital phantom image being reconstructed, which was considered to be the noisy PET image (Fig. 3). Next, using the same steps as described above, the third and fourth digital phantoms, namely the noisy Shepp-Logan phantom image and the noisy point phantom image, were simulated (Figs. 4 and 5). 2) Real PET Data Acquisition: As part of the experimental process in this paper, real PET data were acquired using the microPET R4® (Concorde Microsystems, now Siemens), and these data were reconstructed by filtered back-projection into a 256 × 256 matrix. Three phantoms were used for the quantitative analysis of the proposed WD method. These phantoms were first the cold-spot Mini Deluxe PhantomTM (Fig. 3), in which the isotope involved is 18 F-FDG, and in this case, two images were acquired, one for 60 min and another for 5 min (Fig. 6). Second, a homogeneous cylinder (Fig. 7) was used, in which the phantom was filled with 18 F-FDG, and the dataset was acquired for 30min. Third, a multi-line hot-in-water phantom (Fig. 8) was used, in which the phantom was also filled with 18 F-FDG, and the dataset was
708
IEEE TRANSACTIONS ON NUCLEAR SCIENCE, VOL. 64, NO. 1, JANUARY 2017
background, which could be defined as follows:
CR = 1 − mean (r2 ) mean (r1 ),
(4)
where r1 is obtained from the target of the image, and r2 is obtained from a background area. Furthermore, the SNR and full-width at half-maximum (FWHM) were used as two “objective” measurements of the performance of the proposed method, and SNR is given by
(5) SNR = mean(r1 ) std(r1 ), Fig. 7. Homogeneous cylinder phantom. (a) The noisy image of a homogeneous cylinder phantom. (b) First row shows the results, which were processed by the Visushrink method using different numbers of decomposition levels. Second row shows the results, which were processed by the proposed method using different numbers of decomposition levels.
Fig. 8. Multi-line hot-in-water phantom. (a) The noisy image of the multi-line hot-in-water phantom. (b) First row shows the results, which were processed by the Visushrink method using different numbers of decomposition levels. Second row shows the results, which were processed by the proposed method using different numbers of decomposition levels.
acquired for 30min. Finally, we also acquired a brain image, which was obtained from a 500g rat injected with 0.75mCi of 18 F-FDG; this image was also acquired using the same microPET R4® and a scanning time of 30min. The rat brain image was used for qualitative observation of the results of the proposed WD method (Fig. 11). The two images of the cold-spot Mini Deluxe PhantomTM were used to estimate the group of thresholds. The images of the homogeneous cylinder phantom and the multi-line hot-inwater phantom were used to assess the proposed WD method. 3) Quantitative Analysis: As an initial step, the simulated noisy Shepp-Logan phantom and the simulated point-source phantoms were processed to allow for initial observation of the approach. Second, the two real phantoms were used to assess the proposed WD method. Finally, a rat brain PET image was employed to obtain qualitative observations of the results of the proposed WD method. Normalized root mean square error (NRMSE) was used to evaluate the difference between the processed images and their reference images. The NRMSE is defined in Eq. (3): � N � N � 2 � [y (i) −x(i)] [x(i)]2 , (3) NRMSE = i=1
i=1
where x is the simulated noise-free image, and y is the simulated noisy image. In addition, contrast recovery (CR) was used to represent the contrast between the signal and
where r1 belongs to a uniform area of the image. SNR is applied to judge the uniformity and noise of the data. The spatial resolution indicates the minimum distance between two objects that can be distinguished, and FWHM was used to evaluate the potential loss of spatial resolution when the proposed method was applied. A narrow FWHM indicates better resolution, while a wider FWHM indicates worse resolution. Specifically, we fitted each point spread function (PSF) in the images of the multi-line hot-in-water phantom using the asymmetrical Gaussian model. The FWHM is defined as: √ (6) FWHM = 2 2 ln 2 σ f , where σf is the standard deviation. Two digital phantoms were used to validate the proposed WD method as part of the initial observations; therefore, only one region of interest (ROI) was drawn at the center of the phantoms. As Fig. 4 shows, the ROI was placed in the large homogeneous region. For FWHM analysis, as Fig. 5 shows, the ROI was drawn around a point at the center of the phantom. During the real phantom study, if the ROI was changed, the relevant results were also changed. As Fig. 7 shows, five ROIs were selected to evaluate the SNR. The mean of the SNR values from the five ROIs was computed to perform image quality analysis. The FWHM value was acquired in the same manner (Fig. 8). In addition, we used visual inspection to assess performance parameters that are not well quantified by either the SNR or the FWHM values. III. R ESULTS In this section, we investigate the performance of the new WD method that uses the proposed group of thresholds. Two digital phantoms and two real phantoms were employed to compare the image quality of the Visushrink method and our proposed method. When we used the simulated noisy Shepp-Logan phantom, it was possible to use the NRMSE to assess the difference between the processed images and the noise-free Shepp-Logan phantom. Fig. 9 shows the NRMSE curves for the two methods. The NRMSE values increase sharply from level three using the Visushrink method. In contrast, the curve of our proposed method initially declines slightly and then remains constant from level five onwards. Fig. 4 shows the images obtained by processing using the two methods with one to five decomposition levels. This figure shows that, for the Visushrink method, the acceptable decomposition level is three. However, as Fig. 4 illustrates and considering the curve of the proposed method in Fig. 9, the limit of the decomposition level used for our proposed method depends on
ZHAO et al.: SCANNER-DEPENDENT THRESHOLD ESTIMATION OF WAVELET DENOISING FOR SMALL-ANIMAL PET
709
TABLE I D IGITAL P HANTOM
Fig. 10. Comparisons of two WD methods using real phantoms: (a) comparison of SNR, (b) comparison of CR, (c) comparison of FWHM.
Fig. 9. Comparisons of two WD methods using simulated phantoms: (a) comparison of NRMSE, (b) comparison of SNR, (c) comparison of CR, (d) comparison of FWHM.
the image size. Thus, in the simulated phantoms study, we use three decomposition levels for the Visushrink method and eight decomposition levels for the proposed method. Fig. 9 shows that, in terms of SNR improvement, there is no significant difference between the two methods at level three. The same
tendency can be found when improvement in CR is used, as seen in Fig. 9. However, if we examine the loss of resolution caused by the denoising, then FWHM shows a numerically significant difference at level three. Table I shows the SNR, CR, and FWHM values of the denoised simulated images that have acceptable resolution and the highest SNR values. In a real phantom study, as shown in Fig. 7, the image denoised by the Visushrink method at level four is too blurred, and the same result can also be seen in Fig. 8. As a result, with the real phantom, three decomposition levels were used for the Visushrink method, and eight decomposition levels were used for the proposed method. Fig. 10 shows that,
710
IEEE TRANSACTIONS ON NUCLEAR SCIENCE, VOL. 64, NO. 1, JANUARY 2017
TABLE II
TABLE IV
R EAL P HANTOM
P ROCESSING T IME
Fig. 11. Zoom of the rat brain acquired with the small-animal PET scanner. (a) shows the original noisy data and its zoom view. (b) shows the data after being processed with the Visushrink method. (c) shows the data after being processed with the proposed method. TABLE III P ROCESSING T IME
using the real phantom, the trends in terms of SNR, CR, and FWHM improvements are similar to those found using the simulated phantoms. The corresponding values are shown in Table II. The proposed method seems to perform better in terms of SNR, CR, and FWHM, because the decomposition level is increased without blurring the anisotropic regions. Finally, Fig. 11 shows a PET image of a rat brain and its denoised version obtained using either the Visushrink method or the proposed method; these images allow for a qualitative comparison to be performed. The average processing time of the methods were estimated using a 3.1-GHz core processor with 16GB of memory and the results are shown in Tables III and IV. Compared with the Visushrink method, our proposed method is as concise as the Visushrink method. Moreover, our proposed method is more efficient than the hybrid method. IV. D ISCUSSION The objective of this work is to propose a novel method able to provide better image quality using straightforward mathematical structures and pre-scanning of a phantom.
The proposed method is as concise as the Visushrink method, but it provides better image quality, especially at high decomposition levels. The hybrid methods could provide excellent image quality, but the complicated mathematical structures and complex parameter estimations also result in a heavy computational burden. However, usability and efficiency are both important factors when considering the method that is used in a commercial small-animal PET scanner. Compared with the hybrid methods, our proposed method is able to provide acceptable image quality using a low level of computational complexity together with limited manual intervention. The Visushrink method is an efficient WD method that has straightforward mathematical structures [8], [13]. Compared with a Gaussian filter, which is widely used by commercial small-animal PET scanners, the Visushrink method is more efficient [15], [16]. However, the universal threshold of the Visushrink method results in an excess of over-smoothing, especially at high decomposition levels. This excess results in overkill that affects the decomposition coefficients; this outcome in terms of the restored images after denoising loses many of the image’s details and characteristics. Thus, using the Visushrink method at high decomposition levels results in a progressively worsening situation [17], [18]. As Fig. 7 shows, the edge of the cylinder phantom cannot be distinguished accurately at levels 4 and 5, and the same results can also be seen in Fig. 8. Specifically, Fig. 8 shows the images of a multi-line hot-in-water phantom that, when processed using the Visushrink method, have lost many details at levels 4 and 5. Considering the above factors, the highest decomposition level that can be used with the Visushrink method is limited to level 3. Many modified WD methods have been developed to overcome the disadvantages of the Visushrink method and increase its stability; specifically, statistical models can be applied to improve denoising efficiency and image quality. A large number of algorithms can provide better image quality than the Visushrink method [19]–[21]. In contrast, in most cases, these algorithms have complex structures and are therefore dependent on a generous amount of computational time being available. Additionally, some hybrid WD methods have attracted widespread interest in recent years. These WD methods have been always based on a combination of two or more denoising approaches and related algorithms, which inevitably added to the complexity. These WD methods could produce good images, but their computational needs increased significantly [5], [22]–[24]. Nevertheless, during actual small-animal PET imaging and image post-processing, the processing time is a very important factor. Thus, these hybrid WD methods could not be used in a commercial small-animal PET scanner.
ZHAO et al.: SCANNER-DEPENDENT THRESHOLD ESTIMATION OF WAVELET DENOISING FOR SMALL-ANIMAL PET
Our proposed method is designed to overcome the above disadvantages. There is almost always a trade-off between the image quality and the efficiency of the WD method [25]. Therefore, we focused on substituting the mathematical structures used rather than introducing a drastic modification. In our case, when pre-scanning of a phantom by the smallanimal PET scanner is executed, a corresponding group of thresholds can be obtained. This corresponding group of thresholds is then used to simplify the mathematical model. Fig. 2 illustrates the specific flowchart used for the scanner-dependent threshold estimation. We apply the obtained group of thresholds to replace the universal threshold of the Visushrink method and retain the remaining parts of this WD method. The proposed method inherits the properties of the Visushrink method; therefore, it is simple and efficient. Table III indicates that the replacement of the universal threshold by the calculated group of thresholds does not result in reduced efficiency. The proposed method is as concise as the Visushrink method. In fact, although the proposed method applies higher decomposition levels, it requires less time than the Visushrink method. A hybrid method for small-animal PET images was reported by Mejia in 2015 [24]. The Mejia method provided excellent performance regarding image quality. However, one drawback of the algorithm was the processing time. As Table IV shows, our proposed method requires less than 30% of the total time required for processing when using the Mejia method. Our proposed method not only inherits the properties of the Visushrink method, but it also provides better performance with respect to image quality. As Fig. 7 shows, five ROIs were selected when evaluating the SNR. The mean of the SNR values from the five ROIs was computed to allow for the image quality analysis. The FWHM value was acquired in the samemanner (Fig. 8). Descriptive statistics and the independent t-test were used to compare the SNRs acquired by either the Visushrink method or our proposed method. Table II shows that, when using images of real phantoms, our proposed method achieved an increase of up to 80.6% in SNR ( p < 0.001) and a reduction of up to 13.2% ( p < 0.01) in FWHM. Compared with the Visushrink method, our proposed method provides good performance at higher decomposition levels, and at these levels, it allows for the detailed characteristics of the object to be identified (Figs. 7 and 8). Even at higher decomposition levels, our proposed method remains efficient and stable (Figs. 9 and 10). From decomposition level six onwards, the values are almost constant. This property could be used to lower the level of manual intervention. Table II also shows that the Visushrink method has a limit in terms of decomposition level, but our proposed method does not seem to have such a limit. The decomposition of the proposed method does have a limit, but this is because the matrix of the real PET images used in this study is only 256 × 256. V. C ONCLUSIONS In this paper, scanner-dependent threshold estimation is proposed. A group of thresholds can be estimated based on data acquired via the pre-scanning of a suitable phantom
711
using the same small-animal PET system. Once a group of thresholds hasbeen determined, this group can be used for the WD of any image acquired using the same small-animal PET scanner. If the small-animal PET scanner remains stable, this pre-scanning and threshold estimation does not need to be performed very often. Our proposed method is based on the Visushrink method and uses a group of thresholds to replace the universal threshold of the Visushrink method; the remaining steps of the Visushrink method are retained. When this modified WD method was explored, the experimental results indicated that, compared with the Visushrink method, our proposed method provided a good level of performance with improvements in SNR and CR, as well as a reduction in the loss of resolution. To remove noise effectively, the conventional WD method has the tendency to over-smooth and to lose sharpness, especially at high decomposition levels. There is a tradeoff between noise reduction and over-smoothing of the PET images. Thus the selection of an appropriate decomposing level results in the need for manual intervention. Many new WD methods and wavelet-based hybrid methods with superior performance in noise reduction, as well as resolution preservation, have been developed. However, these hybrid methods always require complex parameter estimations, increasing the level of manual intervention and imposing a greater computational burden. Our proposed method inherits the properties of the Visushrink method; therefore, it is simple and efficient. Furthermore, at high decomposition levels using our proposed method, equilibrium between noise reduction and oversmoothing occurred at a certain decomposition level, and it did not change significantly at higher levels. This property reduces the need for manual intervention. The method proposed in this paper could become an alternative solution to noise reduction when performing small-animal PET imaging studies. ACKNOWLEDGMENTS The authors would like to express their appreciation to Prof. Yu-Te Wu for providing valuable comments. The authors also thank technologists Ms. Nan Sun and Mr. Bloom Zhao for their valuable help. R EFERENCES [1] S. R. Cherry, J. A. Sorenson, and M. E. Phelps, Physics in Nuclear Medicine. New York, NY, USA: Elsevier, 2012. [2] P. Chatterjee and P. Milanfar, “Is denoising dead?” IEEE Trans. Image Process., vol. 19, no. 4, pp. 895–911, Apr. 2010. [3] A. Haar, “On the theory of orthogonal function systems,” Math. Ann., vol. 69, pp. 331–371, 1910. [4] B. Ergen, Signal and Image Denoising Using Wavelet Transform. Rijeka, Croatia: InTech, 2012. [5] A. Le Pogam, H. Hanzouli, M. Hatt, C. C. Le Rest, and D. Visvikis, “Denoising of PET images by combining wavelets and curvelets for improved preservation of resolution and quantitation,” Med. Image Anal., vol. 17, no. 8, pp. 877–891, 2013. [6] H. de Jesús Ochoa Domínguez, L. O. Máynez, O. O. V. Villegas, N. G. Castillo, V. G. C. Sánchez, and E. D. G. Casas, “Wavelet-based regularization and edge preservation for submillimetre 3D list-mode reconstruction data from a high resolution small animal PET system,” Nucl. Instrum. Methods Phys. Res. A, Accel. Spectrom. Detect. Assoc. Equip., vol. 652, no. 1, pp. 798–801, 2011.
712
IEEE TRANSACTIONS ON NUCLEAR SCIENCE, VOL. 64, NO. 1, JANUARY 2017
[7] H. de Jesús Ochoa Domínguez, L. O. Máynez, O. O. V. Villegas, B. Mederos, J. M. Mejía, and V. G. C. Sánchez, “Denoising of high resolution small animal 3D PET data using the non-subsampled Haar wavelet transform,” Nucl. Instrum. Methods Phys. Res. A, Accel. Spectrom. Detect. Assoc. Equip., vol. 784, pp. 581–584, Jun. 2015. [8] D. L. Donoho and J. M. Johnstone, “Ideal spatial adaptation by wavelet shrinkage,” Biometrika, vol. 81, no. 3, pp. 425–455, 1994. [9] M. Lang, H. Guo, J. E. Odegard, C. S. Burrus, and R. O. Wells, “Noise reduction using an undecimated discrete wavelet transform,” IEEE Signal Process. Lett., vol. 3, no. 1, pp. 10–12, Jan. 1996. [10] X.-Y. Wang, H.-Y. Yang, and Z.-K. Fu, “A new wavelet-based image denoising using undecimated discrete wavelet transform and least squares support vector machine,” Expert Syst. Appl., vol. 37, no. 10, pp. 7040–7049, 2010. [11] Y.-Y. Shih, J.-C. Chen, and R.-S. Liu, “Development of wavelet de-noising technique for PET images,” Comput. Med. Imag. Graph., vol. 29, no. 4, pp. 297–304, 2005. [12] S. G. Chang, B. Yu, and M. Vetterli, “Adaptive wavelet thresholding for image denoising and compression,” IEEE Trans. Image Process., vol. 9, no. 9, pp. 1532–1546, Sep. 2000. [13] D. L. Donoho and I. M. Johnstone, “Adapting to unknown smoothness via wavelet shrinkage,” J. Amer. Statist. Assoc., vol. 90, no. 432, pp. 1200–1224, 1995. [14] M. Nasri and H. Nezamabadi-pour, “Image denoising in the wavelet domain using a new adaptive thresholding function,” Neurocomputing, vol. 72, nos. 4–6, pp. 1012–1025, 2009. [15] J. M. Mejia, H. de Jesús Ochoa Domínguez, O. O. V. Villegas, L. O. Máynez, and B. Mederos, “Noise reduction in small-animal PET images using a multiresolution transform,” IEEE Trans. Med. Imag., vol. 33, no. 10, pp. 2010–2019, Oct. 2014.
[16] R. Yao, R. Lecomte, and E. S. Crawford, “Small-animal PET: What is it, and why do we need it?” J. Nucl. Med. Technol., vol. 40, no. 3, pp. 157–165, 2012. [17] M. C. Motwani, M. C. Gadiya, R. C. Motwani, and F. C. Harris, Jr., “Survey of image denoising techniques,” in Proc. GSPX, 2004, pp. 27–30. [18] F. E. Turkheimer, M. Brett, D. Visvikis, and V. J. Cunningham, “Multiresolution analysis of emission tomography images in the wavelet domain,” J. Cerebral Blood Flow Metabolism, vol. 19, no. 11, pp. 1189–1208, 1999. [19] S. P. Ghael, A. M. Sayeed, and R. G. Baraniuk, “Improved wavelet denoising via empirical Wiener filtering,” Proc. SPIE, vol. 3169, pp. 389–399, Oct. 1997. [20] J. Portilla, V. Strela, M. J. Wainwright, and E. P. Simoncelli, “Image denoising using scale mixtures of Gaussians in the wavelet domain,” IEEE Trans. Image Process., vol. 12, no. 11, pp. 1338–1351, Nov. 2003. [21] F. Luisier, T. Blu, and M. Unser, “Image denoising in mixed Poisson–Gaussian noise,” IEEE Trans. Image Process., vol. 20, no. 3, pp. 696–708, Mar. 2011. [22] B. Ismail and A. Khan, “Image de-noising with a new threshold value using wavelets,” J. Data Sci., vol. 10, no. 2, pp. 259–270, 2012. [23] J. Li, C. Cheng, T. Jiang, and S. Grzybowski, “Wavelet de-noising of partial discharge signals based on genetic adaptive threshold estimation,” IEEE Trans. Dielectr. Electr. Insul., vol. 19, no. 2, pp. 543–549, Apr. 2012. [24] W. Stefan, K. Chen, H. Guo, R. A. Renaut, and S. Roudenko, “Waveletbased de-noising of positron emission tomography scans,” J. Sci. Comput., vol. 50, no. 3, pp. 665–677, 2012. [25] M. K. Mihçak, I. Kozintsev, K. Ramchandran, and P. Moulin, “Lowcomplexity image denoising based on statistical modeling of wavelet coefficients,” IEEE Signal Process. Lett., vol. 6, no. 12, pp. 300–303, Dec. 1999.