David J. Pasta, ICON Clinical Research, San Francisco, CA ..... Cox (1957), which includes the optimum groups for the Normal case. ..... Cochran, William G. (1983), Planning and Analysis of Observational Studies, Eds. Lincoln E. Moses and.
SAS Global Forum 2009
Statistics and Data Analysis
Paper 248–2009
Learning When to Be Discrete: Continuous vs. Categorical Predictors David J. Pasta, ICON Clinical Research, San Francisco, CA ABSTRACT Some predictors, such as age or height, are measured as continuous variables but could be put into categories ("discretized"). Other predictors, such as occupation or a Likert scale rating, are measured as (ordinal) categories but could be treated as continuous variables. This paper explores choosing between treating predictors as continuous or categorical (including them in the CLASS statement). Specific topics covered include deciding how many categories to use for a discretized variable (is 3 enough? Is 6 too many?); testing for deviations from linearity by having the same variable in the model both as a continuous and as a CLASS variable; and exploring the efficiency loss when treating unequally spaced categories as though they were equally spaced.
INTRODUCTION Early in your statistical training, whether it was formal or informal, you probably learned that variables have a "level of measurement" of nominal, ordinal, interval, or ratio. The popularization of this rubric goes back at least to the 1950s (see Blalock 1979 section 2.2 and the references mentioned there). A nominal variable is a classification for which there is no ordering (although sometimes there is a partial ordering): the values are just "names" and are not to be interpreted quantitatively even if they are numbers. The values of an ordinal variable can be put into a unique order, but the distance between values cannot be quantified. For an interval variable, the distance between values can be quantified but the "zero" is arbitrary, so we cannot talk about one value as being "twice as big" as another. Finally, the highest achievement for a variable is to be a ratio variable: both the distances between values and their ratios can be quantified. It may surprise you to learn that this method of characterizing variables is not, in fact, generally accepted by statisticians. Yes, it has some value as a pedagogical tool and it provides some common language for discussing what sorts of analyses might make sense. However, it ignores important distinctions within categories, including whether a nominal variable has a partial ordering and whether a ratio variable arises as a count or a proportion. Much can be (and has been) written on this topic; a good starting place is Velleman and Wilkinson (1993). For the purposes of this paper we will emphasize a very practical distinction that arises in the analysis: will the variable be treated as continuous or as categorical? We will refer to variables as continuous even though it is easy to argue that no variable being analyzed in a digital computer is truly continuous, as measurements are recorded with finite precision. What we really mean is that we're treating the variable as a measure of an underlying continuous or approximately continuous value and we are willing to treat the differences between values as quantitative. Thus it is meaningful to talk about the effect of "a one-point increase" in the value of X or for that matter "a 0.3-point increase". This is one place where it may be important to distinguish among subdivisions of continuous variables. If variable X is a count, we would probably want to talk only about whole-number increases in the value of X; if it is a proportion, we would only want to talk about increases that were less than 1. What we are calling continuous variables are referred to by others as quantitative, metric, interval-scaled, or other similar terms. The important thing to remember is that for continuous variables we are treating each unit change as having the same effect. When we do not want to treat the differences between values as quantifiable, or at least not uniformly quantifiable, we treat the variable as categorical. In SAS® procedures, this means including the variable on the CLASS statement. The values represent categories. It will be important to know whether those categories are unordered (nominal), partially ordered, or fully ordered (ordinal). It is even possible for the fully ordered variables to be interval or ratio – for example, if it represents numerical ranges of income – but what is important for our purposes is that we want to estimate the effect of each value separately. Thus the effect of moving from one category to another may differ depending on the categories. These variables are also referred to as discrete, but we use the term categorical because it is in broad use and because even variables treated as continuous are measured discretely. 1
SAS Global Forum 2009
Statistics and Data Analysis
A WORD ABOUT BINARY VARIABLES Binary variables are those that take on exactly two values, such as 0 and 1 or True and False or Male and Female. For analysis purposes, they can be considered either continuous or categorical. In general it doesn't matter which way you think about them. However, it can have implications for computational algorithms, for parameterizations of models, and for interpretations of results. There are circumstances where it matters a great deal whether you are treating a binary variable as continuous or categorical, such as when you are adjusting for it in a linear model and you are calculating least squares means (LSMEANS). Specifically, putting a binary variable in a CLASS statement affects (1) the parameterization and therefore (2) the interpretation of the results; it also affects (3) the calculation of the least squares means (LSMEANS) and also (4) the interpretation of the OBSMARGIN option on LSMEANS. Generally, it is safer to treat binary variables as categorical than to treat them as continuous, although there are times when you will want to treat them as continuous.
SHOULD MY VARIABLE BE CONTINUOUS OR CATEGORICAL? At first blush, it seems easy to tell which variables should be continuous and which should be categorical. There are, however, many gray areas and even situations where you are quite sure it may turn out that others have a different point of view. My experience is that the decision at times appears to hinge on the analytic techniques people are most familiar with. Someone who works with lots of survey data and is very comfortable with categorical variables is eager to treat household income (measured to the nearest thousand) as a categorical variable by dividing it into groups. Another analyst, working almost exclusively with continuous variables, might be eager to take household income (as recorded in broad ranges) and make it a continuous variable. How much difference does it make? Are there clear situations that go one way or the other? First, the easy direction: Any continuous variable can be made into a categorical one – or a set of categorical ones – by "discretizing" it. You define categories and use the continuous value to determine the appropriate category for each measurement. Why would you want to do that? Don't you lose information that way? How can that ever be a good idea? It is true that if the variable in question has an exactly linear relationship with the outcome, you do lose information by making a continuous variable into a categorical one. Furthermore, instead of estimating a single coefficient (1 degree of freedom, or df) you need to estimate K coefficients if your variable has K categories, which represents K-1 df. (You use up only K-1 degrees of freedom because of the inherent redundancy of classification – if you know an observation is not in any of the first K-1 categories, it must be in the Kth category. Put another way, the proportion of observations in the categories must add up to 1. Therefore as long as there is an intercept term in the model, or another categorical variable, the number of degrees of freedom is equal to the number of categories minus 1.) On the other hand, what if the relationship is not precisely linear? Treating the variable as continuous allows you to estimate the linear component of the relationship, but the categorical version allows you to capture much more complicated relationships. What about the other direction? Does it ever make sense to take a categorical variable and treat it as continuous? Indeed it does. In fact, I would argue that it is nearly always worthwhile at least examining the linear component associated with any ordinal variable. Even if you want to keep a variable as categorical, it is worth understanding the extent to which the relationship is linear. It is, in general, a more powerful approach to analyzing ordinal variable to treat them as continuous and to fail to consider that possibility may cause many useful relationships to be overlooked. The article by Moses et al. (1984) is positively eloquent on the subject. One concern often expressed is that "we don't know that the ordinal categories are equally spaced." That is true enough – we don't. But we also don't "know" that the relationship between continuous variables is linear, which means we don't "know" that a one-unit change in a continuous variable has the same effect no matter whether it is a change between two relatively low values or a change between two relatively high values. In fact, when it's phrased that way -- rather than "is the relationship linear?" -- I find a lot more uncertainty in my colleagues. It turns out that it doesn't matter that much in practice – the results are remarkably insensitive to the spacing of an ordinal variable except in the most extreme cases. It does, however, matter more when you consider the products of ordinal variables. 2
SAS Global Forum 2009
Statistics and Data Analysis
I am squarely in the camp that says "everything is linear to a first approximation" and therefore I am very cheerful about treating ordinal variables as continuous. Deviations from linearity can be important and should be considered once you have the basics of the model established, but it is very rare for an ordinal variable to be an important predictor and have it not be important when considered as a continuous variable. That would mean that the linear component of the relationship is negligible but the non-linear component is substantial. It is easy to create artificial examples of this situation, but they are very, very rare in practice. Are there situations where even I would insist on keeping a variable as categorical? As tempting as it might be for some people to put an order on race/ethnicity or religious affiliation, except in rare cases that is inadvisable. There are certainly situations where objects have been grouped by unspecified criteria and part of the object of the analysis is to understand those groupings – those need to be considered nominal, not ordinal. Genetic mutations might also be nominal, although often there is a partial ordering associated. You can probably think of some other examples from your own experience. In general, though, truly nominal (not even partially ordered) variables are infrequent in practice. Just as uncommon, in my view, are continuous measures where you are certain that the effect is linear (a one point change has the same impact no matter on the scale it occurs). In fact, other than the limiting case of binary variables (where there is not enough information to detect nonlinearities) no good examples come to mind outside of the physical sciences. So I see the world as pretty much shades of gray. There are many variables might be treated either as continuous (linear) or as categorical and many fewer that should definitely be treated one way or another.
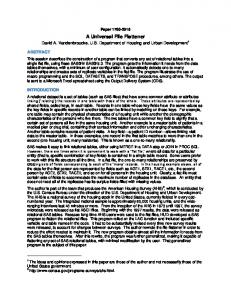
AN EXAMPLE: TESTING FOR DEVIATIONS FROM LINEARITY I mentioned testing for deviations from linearity. How do you do that? It's actually pretty easy, but it leads to output that people find a little odd-looking at first. For any ordinal variable, (1) but the ordinal variables in the CLASS statement, (2) make an exact copy that will not be in the CLASS statement, and (3) include both variables in the MODEL statement. For example, you might have a variable measuring education called EDUCAT with K categories. You can create L_EDUCAT (L for Linear), and include both in the model. What happens? L_EDUCAT will have 0 degrees of freedom and 0 Type III effect (it doesn't add any information after the categorical EDUCAT is included). EDUCAT will be a test of deviations from linearity with K-2 degrees of freedom – 1 lost to the overall constant, and 1 lost to the linear effect L_EDUCAT. There are some details to watch out for, best expressed by looking at some SAS output.
EDUCAT categorical with typical labels Dependent Variable: y Sum of Source
DF
Squares
Mean Square
F Value
Pr > F
Model
4
21702.2880
5425.5720
2.24
0.0707
Error
95
230398.3776
2425.2461
Corrected Total
99
252100.6656
R-Square
Coeff Var
Root MSE
y Mean
0.086086
33.46631
49.24679
147.1533
Source
DF
Type I SS
Mean Square
F Value
Pr > F
educat
4
21702.28797
5425.57199
2.24
0.0707
Source
DF
Type III SS
Mean Square
F Value
Pr > F
educat
4
21702.28797
5425.57199
2.24
0.0707
3
SAS Global Forum 2009
Parameter Intercept educat educat educat educat educat
HS grad college grad less than HS post college some college
Statistics and Data Analysis
Standard Error
Estimate 136.6563385 B -2.3539316 B
8.32422640 14.86171676 13.59340479
35.1031661 B 2.6127789 B 21.0818184 B
t Value 16.42
Pr > |t| F
Model
4
21702.2880
5425.5720
2.24
0.0707
Error
95
230398.3776
2425.2461
Corrected Total
99
252100.6656
R-Square
Coeff Var
Root MSE
y Mean
0.086086
33.46631
49.24679
147.1533
Source
DF
Type I SS
Mean Square
F Value
Pr > F
educat
4
21702.28797
5425.57199
2.24
0.0707
Source
DF
Type III SS
Mean Square
F Value
Pr > F
educat
4
21702.28797
5425.57199
2.24
0.0707
Parameter Intercept educat educat educat educat educat
Estimate 157.7381569 B -18.4690395 18.4690395 B
1 less than HS 2 HS grad 3 some college
-23.4357501 B -21.0818184 B 14.0213477 B
4 college grad 5 post college
0.0000000 B
Standard Error 12.71546586 18.66120207 17.69917942 15.19788858 16.64845280 .
t Value 12.41
Pr > |t| F
Model
1
10457.6803
10457.6803
4.24
0.0421
Error
98
241642.9853
2465.7447
Corrected Total
99
252100.6656
4
SAS Global Forum 2009
Statistics and Data Analysis
R-Square
Coeff Var
Root MSE
y Mean
0.041482
33.74458
49.65627
147.1533
Source l_educat Source l_educat
Parameter Parameter Intercept
DF
Type I SS
Mean Square
F Value
Pr > F
1
10457.68028
10457.68028
4.24
0.0421
DF
Type III SS
Mean Square
F Value
Pr > F
1
10457.68028
10457.68028
4.24
0.0421
Standard Error
Estimate 121.1955784 8.4005599
l_educat
13.54728807 4.07910241
t Value 8.95
Pr > |t|