Location Based Association of Customers' Sentiments and Retail Sales ... with their locations, number of employees, sales volume (2014) information gathered .... We thank the SAS Global forum 2015 conference committee for providing a ...
Paper 3342-2015
Location Based Association of Customers’ Sentiments and Retail Sales Asish Satpathy, School of Business and Administration, University of California, Riverside, CA; Tanvi Kode, Goutam Chakraborty, Spears School of Business, Oklahoma State University, Stillwater, OK ABSTRACT There are various economic factors that affect retail sales. One important factor that is expected to correlate with sales is customers’ overall sentiments towards a given brand. In this paper, we analyze how location specific customers’ sentiments could correlate with sales at retail stores. In our attempt to find any dependency, we have used location specific Twitter feeds related to a national brand chain retail store (Walmart Inc.) and opinion mine their overall sentiments using SAS® Sentiment Analysis Studio™. We estimate correlation between peoples’ sentiments and retail sales within the studied geographic areas. Later in the analysis, using ESRI’s ArcGIS Online, we estimate if other location specific variables that could potentially correlate with customer’s sentiments towards the brand, are significantly important to predict brand’s retail sales.
INTRODUCTION The retail sales are common indicator of the health of the economy. They are also a big component of the total gross domestic product (GDP) in the USA. A proper forecast of company’s retail sales is very important for businesses to anticipate the future purchasing action of consumers. Because consumer behavior, consumer sentiments and their demographics are expected to play a significant role in overall sales at a given location, our goal in this paper is to confirm or refute this hypothesis and measure the underlying significance from a sample data collected for the Walmart retail stores in the USA. Social media continues to play an important role in capturing people’s sentiments and opinions about a wide variety of subjects and discipline. The ability to quantify and evaluate people’s perceptions about certain product and services has become an increasingly critical factor to the success of marketplace where customers’ voice can be heard unbiased and direct. When people post their opinions on Twitter or Facebook about a particular topic of their interests, these opinions can be highly resourceful for the marketplace to receive appropriate feedback if they are gathered and analyzed in a meaningful way. These social metrics are critical for companies to successfully optimize their consumer engagement strategy which overall results in value creating opportunities. In this paper we leverage publicly available geo-referenced tweets (using an application programming interface (API)) to understand how local customers’ sentiments matter for potential growth and decision making process of retail store. We have used ESRI’s online product suite to study 30 randomly selected Walmart stores across the USA with their locations, number of employees, sales volume (2014) information gathered from the ESRI’s Business Analyst Online (BAO) application. Latitude and longitude are separately determined from the street address for each Walmart location and then tweets within 100 miles from each location are collected using a custom developed application. Sentiment analysis is performed on about 1,000 georeferenced tweets for each location using SAS® Sentiment Analysis Studio™. Location based demographic variables are analyzed to understand how they may attenuate the correlation between people’s sentiments c with the local sales volume.
DATA ANALYSIS We develop this analysis with few assumptions on the collected data sample to address two important research questions. The locations of 30 Walmart stores are randomly chosen across the US with a requirement of distance between any two stores is more than 200 miles. In the following sections we provide detailed steps for the analysis.
1
Assumptions on collected data: (1) The time window (in the month of December 2014) for which we chose to collect geo-referenced tweets is a random sample for a given location. The results from sentiment analysis performed on that sample represent the overall sentiments of the population. We have ignored the temporal factors that could potentially influence sentiments such as festivals, holidays and other economic factors including unemployment rate, poverty level etc. (2) The geographic centroid of the collected tweets is the location of the store. We use 100 mile radius from the store location to collect tweets to maintain our sample of the order of 1,000 tweets for each location. (3) A trade area for each Walmart store is assumed to be a circle of 10 mile radius from the store location. Demographic factors and sentiments of people residing in a trade area are characteristics of potential Walmart customers. (4) For a given Walmart location, although the sample of tweets collected for the analysis represent data from a much larger trade area (a circle with100 mile radius), we assume the sentiments of people remain fairly uniform within the trade area including the studied 10 mile radius trade area. Research Questions: (1) For a given trade area, is there any significant relationship between sales volume of Walmart stores and customers’ sentiments towards the Walmart brand? (2) How does the above relationship change with the presence of location based demographic and socioeconomic factors such as “Total number of households”, “Average home value”, and “Total retail spending” in the trade area of the store location? Collection of Tweets Data: Georeferenced tweets are contents and references (microblogging) created by users which are associated with users’ short quips at the speed of thought using 140 characters or less. They are available in bundle with additional pieces of metadata – entities and users’ places when tweet was authored as far as users agreed to share their location information on the Twitter application.
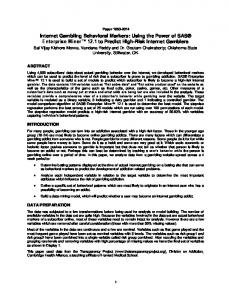
Figure 1. Custom developed application to collect tweets with designated key word (“Walmart” in our case) within 100 mile radius from a given location (latitude, longitude).
2
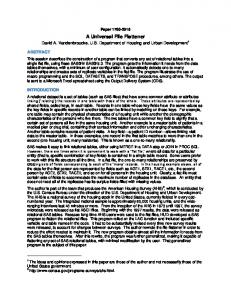
We have developed a custom build application that queries tweets confined to a specific geographical location (100 mile radius from the location of store) with string matching option [Figure-1]. Although it is not clear how sentiments are expressed given the informal language and message-length constraints of microblogging, our goal is to establish Twitter sentiment about Walmart by collecting tweets that contain “Walmart” as a matched string at a given location. We collect about 1,000 independent tweets at each location and identify three samples (with100 tweets each) for positive, negative and neutral tweets to use for training three way sentiment classifiers. We have not considered any emoticon data (for example - , etc.) to classify sentiments in the tweets. Using these training samples, we build model using SAS® Sentiment Analysis Studio™. The best model that classifies sentiments is Smoothed Relative Frequency and Chi Square [Figure-2]. Using this model, tweets for all 30 Walmart locations are tested to determine the percentage of net positive sentiment which is define as: [(Number of positive sentiments / Number of negative sentiments) - 1]*100. Figure-3 shows the distribution of positive, negative and neutral sentiments for one of the 30 Walmart location used for our study.
Figure 2. Comparison of different statistical models tested for determining the optimized precision to classify training samples into positive, negative and neutral sentiments.
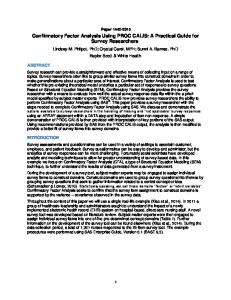
Figure 3. Example of sentiment distributions for one location using the best model obtained from the training sample. These numbers are used to estimate the percentage of net positive sentiment at a given location.
3
Data Analysis: The estimated percentage of net positive sentiments are compared with the sales volume at each of the 30 Walmart locations using ESRI’s ArcGIS online tool as shown in Figure-4. There is no clear indication that there exists a definite correlation between net positive sentiments and sales volume of a brand at a given location. A test for a correlation between an alternative metrics such as “(# of positive sentiments / (Total number of positive, negative and neutral sentiments) and sales volume of the brand at a given location showed no evidence of clear significance.
Figure 4. Walmart’s sales volume vs percentage of net positive sentiments about the brand. The gray colored bubbles represent the percentage of net positive sentiments for the brand superimposed on the sales volume of the stores.
A correlation between Sales volume and net percentage of positive sentiments is checked using SAS Enterprise Guide 6.1. Again, we don’t find a significant correlation as shown in the Figure-5.
P-value for this linear fit = 0.4586 (>0.05) We can’t reject the null hypothesis at 95% confidence level that there is no significant correlation between dependent and independent variables.
Figure 5. Linear regression results to estimate the correlation between percentage of net positive sentiments and sales volume for 30 Walmart locations.
4
We estimate other location variables at each Walmart stores using ESRI’s Maps for Office. By introducing three such location based variables ( “Total households”, “Average Home value” and “Retail goods spending” of the trade area), the significance of the regression model improves although we can’t definitely confirm an association as shown in Figure-6.
Source Model Error Corrected Total
Variable Intercept Retail Goods Spending Total Households Average Home Value % of Net Pos. Sentiments
DF 4 25 29
Analysis of Variance Sum of Mean Squares Square F Value Pr > F 7.971154E16 1.992788E16 1.82 0.1561 2.73426E17 1.093704E16 3.531375E17
Parameter Estimates Parameter Label DF Estimate Intercept 1 453097685 1 0.15576 1 -3363.99940 1 -1008.20077 % of Net Pos. Sent 1 -1428818
Standard Error t Value Pr > |t| 89960627 5.04