Samsudin et al. / Malaysian Journal of Fundamental and Applied Sciences Vol. 13, No. 3 (2017) 294-303
RESEARCH ARTICLE
Control limit detection for source apportionment in Perlis River Basin, Malaysia Mohd Saiful Samsudin a, Saiful Iskandar Khalit a, b,*, Azman Azid a, b, Hafizan Juahir c, Ahmad Shakir Mohd Saudi d, Zati Sharip e, Muhammad Amar Zaudi f a b
c
d e f
Faculty of Bioresources and Food Industry, Universiti Sultan Zainal Abidin, Besut Campus, 22200 Besut, Terengganu, Malaysia UniSZA Science and Medicine Foundation Centre, Universiti Sultan Zainal Abidin, Gong Badak Campus, 21300 Kuala Nerus, Terengganu, Malaysia East coast Environmental Research Institute (ESERI), Universiti Sultan Zainal Abidin, Gong Badak Campus, 21300 Kuala Nerus, Terengganu, Malaysia Institute of Medical Science and Technology, University of Kuala Lumpur, 43600 Kajang, Selangor, Malaysia Water Quality and Environment Research Centre, National Hydraulic Research Institute of Malaysia, 43300 Seri Kembangan, Selangor, Malaysia Department of Environmental Science, Faculty of Environmental Studies, University Putra Malaysia, 43400 UPM Serdang, Selangor, Malaysia
* Corresponding author:
[email protected]
Article history Received 9 May 2017 Accepted 5 September 2017 Graphical abstract
Abstract This study presents the application of selected environmetric in the Perlis River Basin. The results show PCA extracted nine principal components (PCs) with eigenvalues greater than one, which equates to about 77.15% of the total variance in the water-quality data set. The absolute principal component scores (APCS)-MLR model discovered BOD and COD as the main parameters, which indicates the measure of the agricultural pollution in the Perlis River Basin, the hierarchical agglomerative cluster analysis (HACA) shows 11 monitoring stations assembled into two clusters in accordance with similarities in the concentration of BOD and COD, which are grouped in P4. The X ̅ control chart shows that the mean concentration of BOD and COD in P4 is in the control process. The capability ratio (Cp) was applied to measure the risk of the concentration in terms of the river pollution in a subsequent period of time using the limit NWQS. Keywords: Environmetric, water quality, principal component analysis, APCS-MLR, cluster analysis, statistical process control © 2017 Penerbit UTM Press. All rights reserved
INTRODUCTION A river is a system that comprises a main course and its tributaries, which carrying the one-way flow of a significant load of matter in dissolved and particulate phases from both natural and anthropogenic sources (Shrestha and Kazama. 2007; Mohd, et al. 2011; Najar and Khan.2012: Rashid et al. 2013). Surface water is a natural resource essential for life on Earth and plays an important role in everyday human life (Zali et al. 2011; Ibrahim et al. 2015). In recent years, increasing attention has been given to surface water quality, since it is a component of the natural environment and considered as the main factor for controlling environmental health and potential hazards (Lim et al. 2013. The continuous economic expansion and industrialization in Malaysia have resulted in environmental problems with everincreasing land, air and water pollution (Ho, 1996). During the peak of the agricultural development in the 1960’s and 1970’s, pollution from the agro-based industries accounted for approximately 90% of the industrial pollution load, while it was the largest source of water pollution during a period when there were inadequate provisions for regulating the discharge of effluents (DOE, 1990). Although there has always been plenty of fresh water in Malaysia, a supply of clean water has not always been available due to an increasing water pollution problem. 294
The water quality index (WQI) has been considered to provide criteria for surface water classification based on the use of standard parameters for water characterization (Sa’nchez et al. 2007). WQI is used as a basis for the assessment of a watercourse in relation to the pollution load categorization and the designation of classes of beneficial uses as stipulated in the National Water Quality Standard of Malaysia (NWQS). Therefore, the NWQS has applied in relation to the surface waters as a guideline for the classification of the different state of the river water quality. The WQI in Malaysia was derived using Dissolved Oxygen (DO), Biochemical Oxygen Demand (BOD), Chemical Oxygen Demand (COD), Ammoniacal Nitrogen (NH3-N), Suspended Solid (SS), and pH. Polluted water resources can have huge impact on human being since they can affect their health as well as their living and working environments. Water quality management requires robust methods to assess the influence of various point and non-point sources of pollution (Rode et al. 2010; Nigel et al. 2010; Zhao et al. 2014). Several statistical techniques, such as chemometrics and statistical process control (SPC), are considered as an effective approaches to support water quality management decisions. These techniques are also able to help in interpreting the complex data matrices, especially in the context of water quality and the ecological status of the studied system, which allows for the identification of possible factors/sources that influence
Samsudin et al. / Malaysian Journal of Fundamental and Applied Sciences Vol. 13, No. 3 (2017) 294-303
water systems and provides a valuable tool for the reliable management of water sources and a rapid solution to the problem of pollution (Vega et al. 1998; Lee et al. 2001; Adams et al. 2001; Wunderlin et al. 2001; Reghunath et al. 2002; Simeonov et al. 2002; Simeonov et al. 2004). In the present study, a large data matrix, obtained during 5-year (20032007) monitoring program by the Malaysian Department of Environment (DOE) were taken into consideration to extract the spatiotemporal information for the Perlis River monitoring stations, as part of the river water quality monitoring programme. Thirty physicochemical parameters were involved in this study. The objectives of this study were to identify the types of pollution sources at Perlis river basin in terms of different of land uses and surrounding activities, classify the most significant parameters, determine the most significant possible pollution sources for each rivers, which can contribute to river pollution loading, and discover the
potential contamination of pollutants and perform the process capability of water quality in the study area. EXPERIMENTAL The watershed size of the Perlis River Basin covers approximately 310 km² with 11 km of length through Kangar city to Kuala Perlis (DID, 2009) as shown in Fig. 1 and Table 1. More than ten streams flow into the Perlis area, while the Perlis River is one of the most important rivers in Perlis. From January to April, the weather is usually hot and dry. From September to December, it is the rainy season with recorded temperatures between 21 °C and 32 °C, while the average annual rainfall is between 2000 ml and 2500 ml per year (Perlis, 2011a; Perlis 2011b).
Fig. 1 Map of Perlis River Basin.
Table 1 Information of monitoring stations at Perlis River Basin.
295
LONGITUDE
LATITUDE
STA No.
RIVER
LOCATION
E 100° 09.426’
N 06° 26.013’
P1
Perlis
E 100° 14.927’
N 06° 28.007'
P2
Ngulang
E 100° 17.495’
N 06° 32.661’
P3
Serai
Kg. Batu Bertangkup
E 100° 15.978’
N 06° 30.918’
P4
Jernih
Bridge at Beseri
E 100° 15.950’
N 06° 30.996’
P5
Jernih
Kg. Siam
E 100° 15.615’
N 06° 37.574’
P6
Jarum
JPS Telemetry Station Kg. Titi Tinggi Ulu
E 100° 18.382’
N 06° 39.250’
P7
Kok Mak
E100° 12.219'
N 06° 37.718'
P8
Pelarit
Bridge near JPS Telemetry Station Pelarit River
E100° 11.893'
N 06° 42.268'
P9
Wang
Perlis State Park
Kg. Tebing Tinggi Bridge Ngulang Cross Road's Bridge
Kg. Kolam, Padang Besar Road
Samsudin et al. / Malaysian Journal of Fundamental and Applied Sciences Vol. 13, No. 3 (2017) 294-303
Pre-Processing Data Preliminary work was undertaken in the data matrix that included assembly and data transformation. The data below the detection limit were substituted with values equal to half the detection limit. Normal distribution tests were carried out with the support of the W (ShapiroWilk) test; the agreement of the distribution of the physico-chemical parameters of water with normal distribution was tested (Sojka et al. 2008; Juahir et al. 2010; Samsudin et al. 2011). Standardization was applied to upturn the influence of variables whose variance is small and conversely. Log scaling is very common in environmental data since some of the variables might show very low or very high values. Principal Component Analysis (PCA) Principal Component Analysis (PCA) was used to the normalized data set to examine the contrast in the compositional pattern among the analyzed water quality parameters (variables) and recognize the factors that influence each of the parameters (Mutalib et al. 2013; Azid et al. 2014a; Azid et al. 2014b; Rwoo et al. 2014; Saudi et al. 2014; Kamaruddin et al. 2015; Isiyaka et al. 2015; Isiyaka and Azid. 2015). The new variable which is known as Principal Components (PCs) are the linear combinations of the original set of variables (Sousa et al. 2007; Juahir et al. 2011a; Juahir et al. 2011b; Ismail et al. 2016). Factor loading gives the correlation between the original variables and the VFs, while the individually transformed observations are called factor scores (Vega et al. 1998). The VF coefficients having a correlation 0.49–0.30 are considered ‘weak’ significant factor loadings, correlations in the range of 0.74–0.50 are considered ‘moderate’ and those in the range of >0.75 are considered ‘strong’ (Retnam et al. 2013; Azid et al. 2015). Absolute Principal Component Scores- Multiple Linear Regressions (APCS-MLR) The quantitative contribution made by the various identified sources was determined based on the MLR of the Absolute Principal Component Scores (APCS) from the PCA. In APCS-MLR, the predicted influence of each pollution source upon the total concentration was determined using MLR, with the de-normalized APCS values produced by PCA as the independent variables and the measured concentrations of the particular pollutant (Zhou et al. 2007). The APCS–MLR model is based on the assumption that the total concentration of each contaminant is made up of the linear sum of the elemental contribution from each pollution component collected (Retnam et al; 2013). Source contributions were calculated after grouping the water quality parameters for each basin in this study into the number of factors and identifying the possible sources by PCA. Therefore, in order to find the source of the contribution, MLR was used to calculate sample mass concentration on the APCS (Simeonova et al. 2003). The coefficient of determination, R², Adjusted R² and Root Mean Square Error (RMSE) are the values that need to be considered in determining the best fitting regression linear equation (Azid et al. 2014; Dominick et al. 2012). R² is defined as the proportion of variability in the dependent variable, which is the fundamental measurement of the goodness of the fit of a linear model and is the fundamental measurement of the goodness of the fit of a linear model which is accounted for by the regression equation (Dominick et al. 2012; Ilten and Selici. 2008). The performance of the MLR model was assessed using correlation coefficient R², adjusted correlation coefficient R², Schwarz Bayesian Criteria (SBC) and Akaike’s Information Criteria (AIC). The best model performance was selected when the R², adjusted R², AIC and SBC values are close to unity (Retnam et al. 2013). The minor difference in AIC and SBC indicate the MLR model fit for the prediction of possible pollution sources (Juahir et al. 2011a; Retnam et al. 2013; Aertsen et al. 2010). Hierarchical Agglomerative Cluster Analysis (HACA) Hierarchical Agglomerative Cluster Analysis (HACA) is an independent pattern recognition technique that exposes constitutional structure or fundamental behavior of a data set, which is deprived of creating an assumption about data, to categorize the items of the system 296
into categories or clusters based on their closeness or similarity (Cai et al. 2012; Ibrahim et al. 2015; Ismail et al. 2016). HACA was accomplished with the normalized data set by means of the Ward’s method, using Euclidean distances as a measure of similarity and by gathering items into groups, such that items in a cluster were like each other, while things located in other groups had dissimilarities with each other. Statistical Process Control (SPC) Technique Statistical Process Control (SPC) is a tool used in the form of control charts, which displays variation by using a set of statistical rules for interpreting the control chart and searching for assignable causes of variation (Maurer et al. 1999). The objective of SPC analysis is to eliminate variability in the process. It may not be possible to eliminate variability completely, but the control chart is an effective tool in reducing variability as much as possible. The x and R charts are an example of these control charts with a subgroup size of two or more, which are coupled together in the statistical control process. Both charts will determine whether the process is stable and predictable. The x chart will display average changes over time and the R-chart will display the range of subgroups changes over time. The x and R charts are used for any process with a subgroup size greater than one which the size falls between two and 10. According to Besterfield (2009), control chart is completed when there is an upper control limit, central line and lower control limit to determine whether the process is stable or not (Saudi et al. 2015a; Saudi et al. 2015b; Saudi et al; 2015c). Capability Index The process capability analysis will assist decision makers in making decisions whether the process is capable of complying with existing environmental legislation or benchmarks that are set for a sufficiently large proportion of time (Corbett and Pan, 2002). A measure of the stable and predictable is shown by the control charts, even though waste is produced. Cp, which is a measure of process capability is a necessary complement to a variables control chart. When the Cp value is 1.33 or greater, the operating personnel have the responsibility of keeping the process centered, stable and predictable. However, when the Cp value is 1.33 or reach a greater amount, the operating personnel are responsible to maintain the process centered, stable and predictable (Douglas, 2009). The process capability and tolerance are combined to form a capability index as defined in the following Eq. (1): Cp=
USL−LSL 6σ0
(1)
where Cp is the capability index, USL – LSL represents the upper specification limit substitute by the lower specification limit or tolerance and 6σ0 refers to the process capability. According to Besterfield (2009), when the capability index is 1.00, it is considered as Case (II) situation and if the ratio is greater than 1.00, it will be referred as Case (I) situation which is desirable, and if the ratio is less than 1.00, Case (III) situation will take place which is undesirable. There are three possible situations will occur which is case(I) when the process capability is less than tolerance, (II) when the process capability is equal to the tolerance, and (III) when the process capability is greater than tolerance.
RESULTS AND DISCUSSION PCA PCA of the entire data set (Table 2) involved nine PCs with eigenvalues greater than one explaining about 77.15% of the total variance in the water-quality data set. From Table 2, VF1 shows that 29.97% of total variance has strong positive loadings on conductivity, salinity, DS, TS, Cl, Ca, K, Mg and Na, which can be interpreted as a mineral component of the river water. These findings further support Vega et al (1998), who stated that such clustering variables point to a
Samsudin et al. / Malaysian Journal of Fundamental and Applied Sciences Vol. 13, No. 3 (2017) 294-303
common origin for these minerals, likely due to the dissolution of limestone and gypsum soils. All the possible pollutants sources have been summarized in Table 3. VF2, shows 9.614% of total variance with strong positive loadings of SS, turbidity and Fe. This VF represents the surface run-off source because of the variables contains. This factor loaded with solids indicates towards their origin in run-off from the fields with high load of solids and waste disposal activities. VF3 shows that 7.67% of strong variance has strong positive loadings of BOD and COD, on account of anthropogenic pollution sources. This first factor could be explained by considering the chemical components of various anthropogenic activities that constitute point source pollution especially from industrial, domestic, commercial and agricultural areas (Juahir et al. 2010a). This VF can be explained by the fact that high levels of dissolved organic matter and biological organic matter derive from agricultural activities (paddy fields) and
industrial activities, based on observations along the Perlis River. VF4 (6.5% of total variance) has strong positive loadings of E. coli and coliform. E. coli and coliform are strongly related to municipal sewage and waste water treatment plants along the river. VF5 (5.2% of total variance) has two moderate negative loadings of Pb and Cd. According to Laxen and Harrison (1977), the widespread prevalence of these pollutants noticeably come from leaded petrol. Analysis of land use activities within the study area showed a ferry terminal was based at the mouth of the Perlis River. Ship repairs and maintenance activities could be the potential sources of Pb in the water body. Additionally, the fossil fuel combustion which occurred during the shipping may lead to the presence of Cd. Thus, this can be attributed to the shipping waste pollution. VF6 explained 5.6 % of a strong positive loading of temperature and a strong negative loading of DO.
Table 2 Loadings of nine varimax factors (VFS). VF1
VF2
VF3
VF4
VF5
VF6
VF7
VF8
VF9
DO
-0.128
-0.057
-0.261
-0.185
-0.197
-0.703
0.120
0.077
-0.122
BOD
-0.009
0.006
0.957
-0.009
-0.018
0.050
-0.029
-0.041
0.029
COD
-0.002
0.002
0.949
-0.002
0.013
0.020
-0.028
-0.003
-0.013
SS
0.026
0.924
-0.042
0.114
0.053
0.007
0.022
-0.015
-0.046
pH
-0.075
-0.227
-0.434
-0.056
0.060
-0.229
0.540
0.230
-0.209
NH3-NL
0.446
0.027
-0.129
0.154
0.066
0.396
-0.249
0.087
0.155
TEMP
0.083
0.083
-0.008
0.034
-0.106
0.805
0.158
-0.022
-0.178
COND
0.995
-0.011
-0.004
0.004
0.002
0.028
-0.005
-0.003
0.000
SAL
0.995
-0.006
-0.003
0.004
-0.006
0.008
-0.008
-0.002
-0.006
TUR
-0.027
0.930
-0.028
0.066
0.085
0.003
0.005
0.041
-0.025
DS
0.996
-0.009
-0.003
0.003
0.001
0.021
-0.003
-0.001
-0.002
TS
0.995
0.027
-0.005
0.007
0.002
0.022
-0.002
-0.004
-0.002
NO3
-0.088
0.159
-0.063
0.015
0.006
-0.028
-0.165
0.737
0.114
Cl
0.990
0.000
-0.013
0.003
0.012
0.023
-0.030
-0.002
0.005
PO4
-0.010
0.413
0.044
-0.063
-0.279
0.223
0.009
0.229
0.507
As
0.444
-0.036
-0.036
-0.106
-0.196
0.183
0.371
0.235
0.156
Hg
0.157
-0.032
0.028
-0.063
0.072
0.164
0.469
0.185
0.138
Cd
-0.035
-0.050
0.023
-0.073
0.739
0.046
-0.013
0.255
0.037
Cr
-0.021
-0.092
-0.063
0.200
-0.096
0.083
0.744
-0.284
0.058
Pb
0.033
0.217
-0.042
-0.082
0.735
-0.012
-0.060
-0.199
0.044
Zn
0.065
0.629
0.206
-0.181
-0.147
-0.021
-0.219
-0.037
0.216
Ca
0.739
-0.145
0.220
0.056
-0.018
0.066
0.325
-0.110
0.069
Fe
-0.098
0.763
0.081
-0.022
-0.007
0.165
-0.188
0.062
0.139
K
0.982
0.019
-0.015
-0.002
-0.009
0.077
0.017
0.032
0.046
Mg
0.984
-0.020
0.010
-0.004
0.004
0.027
0.037
-0.029
-0.014
Na
0.993
0.006
-0.013
0.006
-0.002
0.008
-0.037
-0.011
0.000
Oil & Grease (OG)
-0.033
0.016
-0.005
-0.137
-0.165
0.196
-0.056
-0.019
-0.746
BAS
-0.020
0.158
0.206
-0.119
-0.096
0.199
-0.104
-0.498
0.425
E-coli
0.059
0.077
0.010
0.929
-0.045
0.065
0.029
0.012
0.013
Coliform
-0.035
0.026
-0.014
0.937
-0.030
0.041
0.044
0.004
0.034
Variability (%)
29.969
9.614
7.668
6.491
5.205
5.601
4.175
3.947
4.476
Cumulative %
29.969
39.583
47.251
53.742
58.947
64.548
68.722
72.669
77.146
Note: Values in bold indicate the variables has strong loading >0.75 and value in bold and italic indicate the moderate loading.
297
Samsudin et al. / Malaysian Journal of Fundamental and Applied Sciences Vol. 13, No. 3 (2017) 294-303
4.747
AIC
651.445
SBC
684.724
5.273 4.853 7.089 4.832 4.735 5.580 4.905 4.753 5.009
11.10 2.34 57.43 1.91 0 17.98 3.38 0.35 5.51
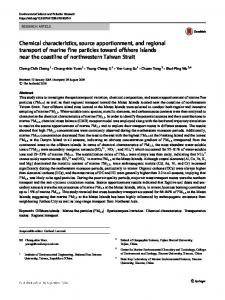
HACA HACA was performed on BOD and COD parameter to study the spatial variations of water monitoring stations based on their similarity level since APCS-MLR show VF3 has highest percentage of contribution in Perlis River. The level of concentration of BOD and COD varies with high and low concentration. High level of concentration implies that there is potentially high concentration level of BOD and COD. In contrast, low level of concentration implies that there is potentially low level concentration of BOD and COD in the monitoring stations. For Perlis River, the HACA has successfully grouped the stations into two clusters for each of the parameter. Based on the Fig. 2, cluster 1 (P4) represents a high level of BOD concentration, while cluster 2 (P1, P2, P3, P5, P6, P7 P8, P9) implies a low level of BOD concentration. These results suggest that station P4 should be monitored frequently as it contains a high level of BOD concentrations. According to Fig. 3, cluster 1 (P4) represents a high level of COD concentration, while cluster 2 (P1, P2, P3, P5, P6, P7, P8, P9) implies a low level of COD concentration. Interestingly, the COD dendrogram result also identified a similar stations with high COD concentration, namely, P4. Therefore, this station should be monitored from time to time in order to reduce the pollutants discharge into the Perlis River. There are several possible explanations for these results. Natural processes, such as precipitation inputs, erosion and weathering process, as well as anthropogenic activities such as industrial, commercial and agricultural activities, lead to increases in BOD and COD concentration in the river. The Perlis River is known for agricultural activities as well as urban activities. In general, therefore, it seems that station P4 is exposed to all the constant polluting sources that modify surface water hydrochemistry, which in turn increase the level of BOD and COD concentration. Thus, the station P4 should be labelled as the main spot for polluting sources and should be monitored frequently to reduce the BOD and COD concentration in the Perlis River Basin. 350000 300000 250000 200000 Cluster 1
150000 100000
Cluster 2
50000 0
P6
RMSE
4.747
27.800 23.555 50.251 23.346 22.421 31.133 24.057 22.588 25.091
% contribution
P8
22.534
22.534
P7
MSE
0.064 0.013 0.330 0.011 0.000 0.103 0.019 0.002 0.032 0.575
P3
0.722
0.670 0.721 0.404 0.723 0.734 0.631 0.715 0.732 0.703
RMSE
P9
Adjusted R²
0.734
MSE
P1
0.734
All Source L-VF1 L-VF2 L-VF3 L-VF4 L-VF5 L-VF6 L-VF7 L-VF8 L-VF9 Total
P2
R²
Diff R²
R²
P5
Table 3 Goodness of fit statistic for regression of WQI
Variable
P4
APCS-MLR The 𝑅2 of the APCS-MLR model is 0.734 as shown in Table 3, which indicates 73.4% variability in WQI, which is explained by nine independent variables used in this model. The mean square error (MSE) and the RMSE calculates the residual errors that provide estimation of the mean difference between observed and modelled values of WQI. Based on the coefficient of determination 𝑅 2 (0.734), MLR shows good adequacy between measured and predicted value. Although 𝑅2 is less than 0.75 and differs from the published study (Wu et al. 2009), the result are still considered as a good fit as it is more than 0.70. From previous discussions, the number and characteristics of possible pollution sources has been identified by PCA, while source contributions were computed using APCS-MLR, a proven effective approach for supplying quantitative information regarding the contributions of each source type (Pekey et al. 2004). The percentage contribution of each possible source is shown in Table 4, with VF3 showing the highest percentage of BOD and COD. The contributions of BOD and COD concentrations to the Perlis River were 57.43%. The Perlis River is situated near the agricultural and domestic areas. This may be the reason for the higher contribution of this source in the Perlis River Basin. VF3 consists of parameters BOD and COD. High levels of BOD and COD are the result of agricultural wastes that flow into waterways, which are broken down by microorganisms. This process uses oxygen that is needed by river life, including plants and fish, to survive. Higher BOD levels can be attributed to decaying organic materials, which elevate the COD level that also cause increased production in chemical activities by aquatic organisms. The higher contribution of this source suggests that agricultural and domestic waste should be controlled effectively in order to protect this water source.
Table 4 Percentage of contribution.
Dissimilarity
This factor could be attributed to the solubility of gases; the solubility of gases in water will decrease with increasing temperature (Vega et al. 2007; Shrestha and Kazama. 2007). VF7 (4.18% of total variance) has strong positive loading on Cr. Cr is a specific pollutant that provides evidence of industrial pollution like dyeing or paint operations. From the site survey along Perlis River, the main activities on this river are fishery and agriculture. Anti-fouling paint is used at the bottom of fishermen’s boats to prevent the build-up of algae and other marine life. Therefore, the presence of Cr can be related to the anti-fouling paint from fishermen’s boats. VF8 shows 3.95% of a strong positive loading of NO3, due to agricultural waste based on a nitrate that can be found in the Perlis River. According to Kazama and Yoneyama (2002), this factor represents the contribution of non-point source pollution from paddy fields and agricultural areas. In these areas, farmers use nitrogenous fertilizer, which undergoes nitrification processes, while the rivers receive nitrate nitrogen via groundwater leaching. VF9, which contributed 4.48% of total variance, has one strong negative loading concerning oil and grease. This VF represents non-point source pollution, which can be assumed to be related to oil waste from restaurants along the Perlis River. Fast food restaurants typically produce a low volume of waste water, but higher levels of grease and COD, generated by their daily kitchen activities, for which there is currently no acceptable treatment technology.
Fig. 2 BOD dendrogram showing classified sampling sites located at Perlis River Basin.
298
Samsudin et al. / Malaysian Journal of Fundamental and Applied Sciences Vol. 13, No. 3 (2017) 294-303
4000000 3500000 Dissimilarity
3000000 2500000 2000000
Cluster 1
1500000 1000000
Cluster 2
500000 P3 P7
P6
P4 P5 P2 P1 P8 P9
0
Fig. 3 COD dendrogram showing classified sampling sites located at Perlis River Basin.
x and R chart for Perlis River Basin The x and R charts for BOD and COD concentration in the Perlis River Basin between 2003 and 2007 are presented in Figure 4. The first period of data analysis is referred to as a trial control limit or is known as the base period. The trial control limit is shown in Figure 4. Based on the Figure 4a, the central control limit of BOD are exceeding the upper control limit (UCL). In the x chart, the central control limit at points 7 and 8 lies outside the control limit, suggesting a possible assignable cause that indicates that 8% of the mean concentrations lies outside the UCL. In the R charts (Fig. 4b), the central control limit of BOD at points 1, 7 and 8 exceeded the control limits. Three out of 25 points, which indicate that 12% of the mean observations lie outside the control limit in the range chart describing the variation in concentration, are not stable. From this result, it can be suggested that the process is not stable for BOD concentrations. Besterfield (2009) stated that most processes are not in control when analyzed for the first time. According to Maurer (1999), the natural processes are commonly characterized by large variations. When natural processes are coupled with anthropogenic activities, the potential for variation and fluctuation may increase even more as stated by the rule violation (Maurer et al. 1999). Therefore, the out of control point should be discarded to get a desirable control limits. The revised control chart is computed by removing all the out-ofcontrol points from the data. In Figure 5a, x chart shows the Upper Control Limit (UCL) with the value of 4.0762, Lower Control Limit (LCL), 0.8179 and the central limit of 2.4471. Meanwhile in R chart (Fig 5b) the value of UCL is 5.9689, LCL is 0.0 and the central limit is 2.8235. The revised control charts shows no out of control points outside the control limits area (Fig. 5). This control chart indicates that the process is in good control. Therefore, the control charts can be selected as the representative for the whole process to make the future prediction and measure the risk of pollution. The revised control limit that is established is used for BOD concentration data. The UCL of 4.0762 and LCL of 0.8179 are used. Two mean observations from the other BOD concentration data subgroup are added to the process in order to determine whether the process is stable or not. This is to ensure that the constructed revised control limit can determine whether the process for the other subgroup data is stable or unstable. Based on Fig. 5, when the two observations are added to the process, the x charts (Fig. 6a) shows that point 27 is lies below the LCL which can be considered as one of the out-of-control points. However, in the range chart (Fig. 6b), there are no out-of-control points that lies beyond the control limits. Although there is a variation within control limits, it is still considered as a natural variation of the process. This signifies that the mean concentration of BOD in the Perlis River is in the control process. The x and R chart for trial control limit is shown in Figure 7.The x chart (Fig. 7a) showed that COD concentration at points 7 and 8 exceeded the control limit, which suggests a possible assignable cause that indicates that 8% of the mean concentrations lies outside the UCL. 299
In the R charts (Fig. 7b), the mean concentration of COD at points 1, 7 and 8 exceeded the control limits. Three out of 25 points, which indicate that 12% of the mean observations lie outside the control limit in the range chart describing the variation in the concentration, are not stable. From this result, it can be suggested that the process is not stable for COD concentrations. Therefore, the out-of-control point should be discarded in order to obtain desirable control limits. Fig. 8 presents revised control charts following the removal of out-of-control points. The revised control charts (Fig. 8) shows no out of control points outside the control limits’ area. This indicates that the process is under good control. Therefore, the control charts can be regarded as representative of the whole process for the purpose of making future predictions and measuring the risk of COD concentration in causing pollution. In Fig. 8a, x chart shows the UCL with the value of 44.335, LCL, 15.689 and the central limit of 30.012. In R chart (Fig. 8b) the value of UCL is 52.477, LCL is 0.0 and the central limit is 24.824. Based on the analysis, it can be seen that all the points in the x chart were lying in the range. Thus, the controls limits can be selected as representative of the whole process because it shows that there are no out-of-control point lyng outside the control limits, thereby indicating that the process is stable. The revised control limit that is established is used for COD concentration data. This attempt was made using the revised control limit that was constructed, as shown in Fig. 9. A UCL of 44.335, a LCL of 15.669 and a central limit of 30.012 were used. Two mean observations from the other COD concentration data subgroup were monitored to determine the stability of the process. Based on Fig. 9, when the two observations are added to the process, x and R charts respectively shows all the points’ lies between UCL and LCL. This signifies that the mean concentration of COD concentrations in the Perlis River is in the control process. Process Capability Indices Data concentration of BOD is found to be within the Upper Specification Limit (USL) and Lower Specification Limit (LSL), with only natural variation occurring. This process is considered to be under statistical control or in a stable process. Therefore, the process performance can be predicted by process capability analysis. The inherent variability of the process is compared with the specification limits in the process capability analysis, such that the environmental performance potential can be detected under normal or in control conditions (Corbett and Pan, 2002). Based on Fig. 10, the capability index (Cp) has been calculated by using the capability analysis to measure the risk of BOD to environment. Cp is used to measure the potential risk of BOD concentration in terms of water pollution. The Cp value is found to be 0.5498 (