Mar 14, 2017 - while âpre-trainingâ [6, 7] of layers as auto-encoders con- tributed to the revived ... and cost functions are employed in neural networks. But if the input .... tered in physics in the statistical mechanics of quantum systems and ...
Convergence of Deep Neural Networks to a Hierarchical Covariance Matrix Decomposition Nima Dehmamy,1 Neda Rohani,2 and Aggelos Katsaggelos2
arXiv:1703.04757v1 [cs.LG] 14 Mar 2017
1
CCNR, Physics Department, Northeastern University, Boston, USA 2 IVPL, Northwestern University, Evanston, 60208 IL, USA
We show that in a deep neural network trained with ReLU, the low-lying layers should be replaceable with truncated linearly activated layers. We derive the gradient descent equations in this truncated linear model and demonstrate that –if the distribution of the training data is stationary during training– the optimal choice for weights in these low-lying layers is the eigenvectors of the covariance matrix of the data. If the training data is random and uniform enough, these eigenvectors can be found using a small fraction of the training data, thus reducing the computational complexity of training. We show how this can be done recursively to form successive, trained layers. At least in the first layer, our tests show that this approach improves classification of images while reducing network size. INTRODUCTION
It is highly nontrivial how the training of a deep neural network1 (DNN) can converge into good solutions. Naively speaking, given the sheer number of interaction parameters between perceptrons, finding good solutions should be difficult. DNNs have a mathematical structure similar to a physical model called spin glass [1–3], which is a system of binary nodes interacting over a random network. Minimizing the cost function in training of a DNN is equivalent to finding the ground state (minimum energy configuration) in the spin glass. Most spin glasses, especially with random interactions, have a very rough energy landscape full of local minima, hence finding the low energy states becomes an NP hard problem. Thus, the question that arises here is: how do DNNs manage to converge to satisfactory solutions? Another aspect of DNNs that needs to be understood is the way they abstract the information contained in the data. The best example is perhaps the activation pattern of filters in an image processing DNN with many convolutional layers [4]. As we go higher in layers (i.e. deeper), the trained filters, when projected down to the input layer, represent more and more complex and highlevel features in the data [5]. The filters in higher layers are combining filters of lower levels and that is why they represent more complicated objects. But how a network whose weights are being updated simultaneously for all layers ends up choosing the correct abstract features at each level is also not a trivial matter. Note that, while “pre-training” [6, 7] of layers as auto-encoders contributed to the revived success of neural networks, many successful DNNs currently used in image processing tasks such as AlexNet [8] or VGGNET [9] converge without pre-training. The large amount of training data avail-
1
By neural network we exclusively mean feed-forward perceptron models.
able today seems to be sufficient for both convergence and building of abstract hierarchy of features. We will argue that the layered structure is key to both the convergence and the appearance of hierarchies. Our results are based on the assumption that the layers’ activation functions can be approximated by a truncated linear expansion, which is closely related the rectified linear activation functions that are becoming the preferred choice for DNNs. We first show that in a deep, layered, linear model programmer the weights of the first layer converges fastest. When the training data is sufficiently randomized, the trained first layer weights become the Karhunen-Loeve transform of the input data. We then illustrate how successive layers start converging in a similar fashion. We use this method to construct a deep convolutional network optimized on MNIST dataset.
RELU AND COMPRESSIVE SENSING
In the past, sigmoid functions were commonly used as activation functions. However, most recent DNN architectures choose to work with Rectifying Linear Units (ReLU) defined simply as g(x) = max{0, x} because of a number of reasons including lower computational complexity, constant gradient, faster learning, sparsity, and no vanishing gradient problem [10, 11]. Note that choosing ReLU activation has a profound effect on the training of weights in a neural network. Unlike sigmoid or tanh activation where bad weights w whose overlap with all data x yields w · x < 0 still result in a nonzero gradient and are, therefore, slowly pushed towards valid weights, ReLU gives zero gradient in these cases. This means that such components in the weights stop evolving and the gradient only amplifies weights that have significant positive overlap with data (assuming biases are close to zero). In unsupervised learning, if we try to train a single layer auto-encoder, this feature of ReLU should lead to the auto-encoder learning pricipal components in the data. If the number of weights is much smaller than the
2 dimensions of the data, the trained auto-encoder will be doing compressive sensing [12, 13] on the data and find a truncated basis in the data. Thus, in spite of being non-linear, ReLU may essentially result in a truncated linear transformation of the data. Based on this intuition, we will start from a completely linear system and truncate the weights later. We are claiming that the nonlinearity may not be essential in the activation functions of the initial layers and that these layers are more about transforming the data to a feature basis.
TABLE I. Notation n # of layers N # of training data P # of pixels in an image C (k) # of channels in layer k xa (z) value of image x at location z in channel a w(k) weights of layer k (k) ha (z) output of layer k at location z in channel a
DNN AND LINEAR PROGRAMMING
We will first introduce a mathematical construction similar to DNNs but based on linear programming and then draw the parallels with a DNN with ReLU activation. We will specifically focus on the classification task in image-processing. We will denote an image by x. It may have multiple channels, as in RGB, multispectral or hyperspectral images. We will denote the number of training images by N . We will use i = 1, ..., N to index images. We denote the number of channels by C and index the channel by a, b, c, .... A pixel at location z on the image and in channel a will be denoted by xa (z). The dimension of the image is the total number of pixels times number of channels D = P × C. Consider the linear programming problem of fitting the N input images X = (x1 , ..., xN ) to N output label vectors, Y = (y 1 , ..., y N ) of dimension R, which is equal to the number of classes. Obviously, there is no guarantee that this problem can be solved using linear programming as Y = AX and that is why nonlinear activation and cost functions are employed in neural networks. But if the input dimensions is much greater than the output dimensions, i.e. P × C � R, there may be enough parameters in matrix A to allow for an approximate linear formulation. Similar to layers in a deep neural network, we want to break A down into many successive linear transformations w(k) . This is analogous to assuming all biases are fixed at zero and that all layers have a linear activation. With n layers we have2 A=
n Y
w(k)
(1)
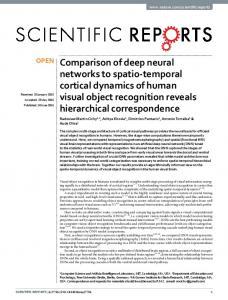
FIG. 1. Sketch of notation.
now z represents location on, and a the channels3 of the output layer. Table I summarizes our notation. Fig. 1 sketches the structure of the system. Similar to regression, we will first take the final cost function after n layers to be the classification error N � � 1X (n) (n) g h ,y = ||h − yi ||22 2 i=1 i
where i indexes the images. Solving this problem using gradient descent should be prone to the same problem of local minima. We will ignore this issue at the beginning and get back to it shortly. DEPTH AND GRADIENT DESCENT
We wish to understand how the depth n of the network affects the convergence of the gradient descent and what solutions a deep network is able to find. The output of each layer in this linear model is given by h i (k) (k−1) h(k) (z) = w · h (z) a a
k
k=1
We will denote the output of layer k by
≡ (k) ha (z)
(2)
where
C X X b=1
b
(k−1)
w(k) a (z, z 0 )hb
(z 0 )
(3)
z0
with C k denoting the number of channels4 in the output of layer k, or the number of filters/kernels of layer k. Our 2
When the number of samples N is much larger than the number of parameters in A, that is N � P R, over-fitting will not be a concern. But images can generally be high resolution and finding sparse representations is desired. Breaking A down into layers does not necessarily decrease the number of parameters, as we will discuss below. Thus, we will have to check for over-fitting.
3 4
Channels may also be the filters in a convolutional neural network In fully connected layers there are no channels and C k simply counts the number perceptrons.
3 b
notation for the weights will be that w(k) a (z, z 0 ) signifies weights of layer k in the input channel a, output channel b, input at location z and output at location z 0 . In T the transpose w(k) both a, b and z, z 0 will be switched. We want to derive the condition for gradient descent to stop evolving for a particular layer. The expression for gradient descent is ∂g ∂g ∂g δh(n) = δw(n) + δh(n−1) (4) δg = (n) (n) ∂h ∂w ∂h(n−1) where channel indices and location coordinates are understood. The variation δh(n−1) in turn results in a recursive expansion showing the backpropagation ! n−1 n−1 (m) X Y ∂h(k) (m) ∂h (n−1) δw δh = ∂h(k−1) ∂w(m) m=1 k=m+1 ! n−1 n−1 X Y = w(k) δw(m) h(m−1) (5) m=1
k=m+1
Since the number of classes R may in principle be much smaller than the input dimensions P × C, A(1) will most likely not be full rank. In spite of this, we will define a (1) pseudo-inverse using the full rank minor of A . Assuming R < P × C we define the right pseudo-inverse as a matrix satisfying A(1) A
(1) −1
. For each of infinitely many such pseudo-inverses A (0) these, we can define an input hi resulting in the desired output yi by (0)
hi
(n−1) ∂hi
(n)
(n−1) ∂hi
(n)
= hi =
(0)
− yi = A(1) · hi
∂g (n) ∂hi
where n Y k=m
w(k)
� � T (0) T (0) = hi − hi A(1) w(n) .
(9)
∂g ∂h(1) δg = δw(1) ∂h(1) ∂w(1) N � � X T (0) T (0) (0) = hi hi − hi A(1) A(2) i=1
=
N X
(0)
hi
�
(0)
hi
� (0) T
− hi
T
w(1) K (2) .
(10)
i=1 T
with K (m) ≡ A(m) A(m) . As mentioned above, we expect that w(1) varies much faster than the other w(k) ’s during gradient descent and, thus, we will assume that K (2) is very slowly varying. Solving the first layer
The expression in (10) is similar to what is encountered in physics in the statistical mechanics of quantum systems and some of that terminology will be useful here.
− yi
� �T (0) w(n) = A(1) · hi − yi w(n) (7)
A(m) ≡
yi
Thus, combining (9) with (5) the variation with respect to w(1) is (for details of indices, see Appendix )
k
∂hi ∂g
(1) −1
(0)
The Leading Term
∂g
≡A
Since the input hi is not unique, we will have to average over all such inputs. 5 But first we will use one such input (0) vector hi to formulate the problem. We may write ∂g
for the L1 norms and in the sparse w limit. When ||w(k) ||1 ∼ c, c > 1 in a deep networks with n � 1 we get blowing up activation and when c < 1 we get vanishing gradient in the high layers. But since during the training time when the network is not sparse, gradient descent is sensitive to input data h(0) (i.e. avoids vanishing gradient) only if ||w(k) || ∼ O(nε ) with small ε > 0. Consequently, it follows from plugging (5) into (4) that the largest term in the gradient descent is the lowest m, meaning the first layer. Thus, the first layer is most likely to get optimized first. Therefore, in this step of the gradient descent the weights of higher levels should be changing more slowly than w(1) and we will assume that they are approximately fixed. With MSE as cost function, for each input i we have
= IR×R
with I being the identity matrix. There are, of course,
where h(0) = x is the input layer.
Since the input is propagated Q up from the first layer to the last using the weights k w(k) , in order to get finite output from the network we should have Y ||w(k) ||1 ≥ O(1) (6)
(1) −1
(8)
5
The assumption that yi generates all possible hi based on the data statistics may not hold in some cases. If yi does not cover all types of high-level patterns in the image (i.e. if it does not assign some of the features to any class at all) then propagating back from yi will not generate the features describing the patterns not classified by yi . Therefore, in higher levels, yi may introduce a bias that prefers features which are relevant to the classification and not necessarily all features present in the data.
4 Define the “density matrix”, ρ of the dataset X as the covariance matrix ρ ≡ XX T =
N X
(0) (0) T
hi hi
If this is the case, we define a unit image density matrix ρ0 such that ρ(N ) = ρN 0 .
(11)
i=1
Taking the derivative with respect to N we get
The components of ρ have both channel and location indices ρab (z, z 0 ) =
N X
(0)
(0)
hia (z)hib (z 0 )
(12)
i=1
Also, define a “target density matrix” ρ≡
N X
T (0) (0)
hi hi
dρ(N ) = ρN 0 log ρ0 dN ρ0 is not normalized and to extract a probability distribution from it we should factor out the trace Z0 = Tr [ρ0 ], known as the “partition function”. Define the “Hamiltonian” H via ρ0 = Z0 exp[−H].
(13)
i=1
In every step of the gradient descent, we are confronted with a new image from the ensemble of N images. Thus, we may think of the gradient descent as changing the total number of samples N used in calculating the weights. So
with Z0 factored out, H becomes a positive-semi-definite matrix because all eigenvalues of exp[−H] are less than 1 and positive because ρ0 is symmetric. We will refer to an eigenvalue of H as “energy”. We now have dw(1) dN
T
−ε
dw(1) δg . ∼ (1) dN δw
for some small constant ε. Using this together with the definitions (11) and (13), we can rewrite (10) for each (0)
choice of hi
as
dw(1) dN
T T
= −ε (ρ − ρ) w(1) K (2)
(14)
The descent will stop when (14) vanishes. (0)
But this is the equation for one particular choice of hi and to get the most likely outcome for w(1) we must average over all choices. However, to have the most likely outcome based on the statistics of the data, the averaging must be done with a distribution based on past data. Such an averaging can be done using the input (0) data X(N ) up to step N . Since h must be drawn from the distribution of X(N ), the expected value of ρ before the N th data point is provided is simply the ρ at N − 1. Thus, at the N th step we have ρ − ρ ≈ ρ(N ) − ρ(N − 1) ≈
dρ dN
After a large enough N and assuming that the ensemble is uniform in N , we expect ρ to represent the statistics of the data. At this point, we can find the eigenvectors of ρ to find a probability distribution PN for the data. However, note that if we assume that each image xi in the ensemble is drawn from the same distribution P1 , then the distribution of N independent such images is simply PN = P1N
(15)
T T
≈ εZ N e−N H (H + ln Z0 )w(1) K (2)
with ln Z0 being a positive constant. The weights that stop evolving earliest are eigenvectors of H with the smallest eigenvalues. These are the eigenvectors representing the highest probability features in the input data. Since eigenvectors of H are also eigenvectors of ρ, passing the data through these eigenvectors corresponds to performing a Karhunen-Loeve (KL) transform [14] on the dataset. It is known that the KL transform minimizes the MSE for representing the data. We have shown that, as long as the final labels yi are not entirely zero, effectively regardless of the values of the details of yi , the first layer is pushed to learn the statistics of the data the same way the KL transform does. In conclusion, we have found that, if the network is deep, the first layer will most likely converge the earliest and it will converge to a basis derived from the KL transform of the data, that is the eigenvector basis of the (1) density matrix ρ. The number of weights wa that we choose is the number of channels (or filters) C 1 of the output of the first layer. Note that just as with the KL transform and compressive sensing [12, 13], we may perform lossy compression by not keeping a complete basis, i.e. if C 1 < P × C.
SUBSEQUENT LAYERS
As we argued under (6), the norm of the kernel K (m) = A A(m) , using (8), grows with the number of layers n as (m) T
||K (m) ||1 ∼ eα(n−m) ,
1 � α > 0.
5 Using the same argument about pseudo-inverse and (m) thereby defining h , the gradient descent equation for layer m becomes N
� X (m−1) � (m−1) δg (m−1) T h = h h − i i i δw(m) i=1 T
· w(m) K (m+1) .
(16)
This means that we can define a density matrix ρ(m) for layer m based on the output h(m−1) of the layer before it ρ(m) ≡
N X
(m−1) (m−1) T hi .
hi
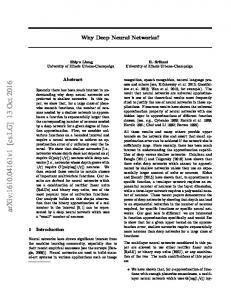
FIG. 2. The Density matrix (covariance matrix) for the two datasets MNIST and CIFAR (gray-scaled) for with convolutional DMNs of kernel size 5 × 5.
(17)
i=1
This way, we have essentially the same equations as for the first layer, except that this time the input is not the raw input data, but rather the output of the previous layer (that is, the images propagated through the previous layers). So we can define an effective Hamiltonian for layer m as H (m) = −N −1 log ρ(m) and choose the weights based on the eigenvectors of this Hamiltonian with lowest eigenvalue. Thus, with this linear construction all we need to do to train the network is to perform recursive KL transforms on the outputs of each layer. We construct a network based on this method below. THE RECURSIVE DENSITY MATRIX NETWORK
The network constructed above is based on recursively calculating the density output of data propagated through previous layers and finding the eigenvectors. We will call this network a recursive Density Matrix Network (DMN). The detail of the architecture of each layer will still depend on how we prepare the data. For instance, for images a convolutional structure will be beneficial as is known in the community. We will also argue for this from the mathematical perspective. To draw the relation with existing DNNs we will discuss the relation to ReLU and its connection with layer size. Note on layer sizes, compression and ReLU
An important point to note is that as we go up in layers, the number of possible channels increases very rapidly. For instance, C 1 = P × C and if the image size in the output of the first layer P (1) ∼ P the number of possible channels of layer 2 becomes CP × P (1) ∼ CP 2 . The reason is that each layer computes all combinations of outputs of the previous layer to construct higher-level features. For high resolution images with P � 1 keeping all the weights quickly becomes impractical. Therefore, we should only keep the most prevalent weights (i.e. highest eigenvalues of ρ(m) or lowest energies of H (m) ) the
same as in compressive sensing. This truncation has a similar effect to using ReLU instead of linear activation. ReLU forces the weights to become the ones that have the largest positive overlap with the output of the previous layer, which is the same as having vectors in a basis of lowest energy eigenvectors. Based on this, we expect a network constructed using our method of recursive KL transforms to have great deal of similarity with a trained DNN.
Translational symmetry in images and the economy of Convolution
Images have features which may appear at different locations in the image or be repeated. This is why convolutional neural networks (CNNs) [4] are useful for image processing, because the convolution tries to match each weight to all parts of the image, thereby finding a feature anywhere in the image. A convolutional approach is also commonplace in using KL transforms for image compression [14]. Using convolution in KL transforms allows us to drastically reduce the dimensionality of the space of filters. Instead of dealing with CP weights in the first layer we only have CK filters with K being the “kernel size” of the filter and K � P . Fig. 2 shows two density matrices for 5 × 5 for a single convolutional DMN layer on two datasets. Filters of size K cannot capture any feature of a larger size and cannot recognize scaling in an image. In fact, with fixed kernel size in each layer, scaled up version of the same image result in different decompositions (this could be mitigated by having different kernel sizes and this may be what is happening in GoogLeNet’s inception module [15]). The point of going to deeper architectures with CNNs is that each subsequent layer’s filter finds features in combinations of filters of the previous layer and it does this locally on the image. The receptive field (i.e. kernel size projected down to the original image) of filters of higher levels cover a larger portion of the original image and thus find larger features. There is, however, a problem in terms of efficiency with using a convolutional architecture in our model. When
6
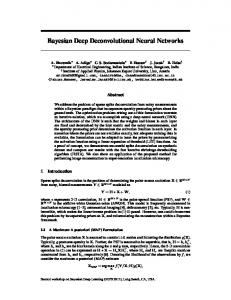
FIG. 3. The spectrum of energies of a second layer of DMN showing the characteristic jump in energies due to the extreme high prevalence of filters coming from overlaps (the first 25 filters, in this case). These filters need to be discarded to get meaningful filters to describe image features.
the weights are multiplied into overlapping patches, the outcome of the weights is highly correlated. Thus, unlike the original image where there could in principle be no spatial correlation among pixels, we will observe spurious correlation in the KL transform due to overlaps in convolution. This will result in the next layer picking up these spurious correlations as the prevalent feature in the data and find irrelevant geometric patterns referring to the pattern of overlaps. To avoid this problem, we will need to “disentangle” the outputs of adjacent filters.
Disentangling Over-complete Weights and Significance of Pooling
For the KL transform in the second layer to find only correlations pertaining to the input data, it must discard modes that are due to overlapping kernels in the convolution. While doing this carefully requires more calculations, there is simple way to identify these weights. The filters due to overlap are so prevalent that their energy (i.e. -log pi with pi being the eigenvalue of ρ) is much smaller than the rest of the energies. Fig. 3 shows the energies at the second layer of a DMN with 3 × 3 convolutional first layer kernels and 3 × 3 second layer filters and trained on 10’000 images from the MNIST dataset. We will discard these overlap filters and use the rest of the filters to capture actual features in the data.
SIMULATION
To examine the utility of using this approach we test it using 10’000 images from the MNIST dataset of handwritten digits.
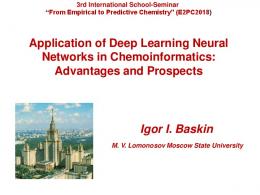
FIG. 4. Filters of a 5 × 5 DMN, first layer, trained on MNIST dataset. The numbers on top of each image are the energies of that filter, referring to minus the logarithm of its prevalence in the dataset.
For all our test models, the highest two layers will be 1 Dense (fully-connected) layer with 128 perceptrons and 1 Dense classification layer, with 10 output classes referring to the digits 0,...,9. We use 9000 images for training and 1000 for valication. Without any extra layers, this basic model manages to reach a validation accuracy of 0.919. A common architecture that has been very successful on this dataset is LeNet [4] which uses 2 convolutional layers (CNNs), both with 3 × 3 kernel sizes and each with 32 filters, before passing the data through the dense layers. Using our training and validation sets, this architecture achieved 0.976 accuracy. The receptive field of the second layer CNN layer is 5 × 5 on the images. We, thus, first test our model with a single DMN layer of size 5 × 5. The filters of this single layer are simply KL tranforms of the training data. Fig. 4 shows these filters. Since the likeihood of these filters appearing in the data falls dramatically with the higher their energies are, we do not keep all the 25 filters of the DMN and instead only keep the first 9 filters, as in compressive sensing. After passing the output of this single layer DMN to the dense layers, our network achieved an accuracy of 0.987. Note that this system has only 9 filters in the first layer, compared to the 32 + 32 = 64 filters of the 2 layer CNNs of LeNet. But because it captures the statistics of the data, it seems to perform better than LeNet. Also, note that the computational complexity of training the 5 × 5 DMN is far less than the two layer 3 × 3 CNN. Finally, note that, as we suggested above, if the training data is picked randomly enough, the density matrix converges quickly to its full ensemble value. This means that we do not require the full training set to train the low-level ρ,
7
First Layer 3 × 3
TABLE II. Comparison with other simple architectures used for MNIST (10’000 images). The base architecture is 1 dense layer with 128 perceptrons and 1 classification layer (softmax) with 10 classes. The other layers were added between input and the first dense layer. 1Dense+1Softmax Kernel #Filters Accuracy base (128) – – 0.919 base+2CNN 3,3 32,32 0.976 base+1DMN 5 9 0.987
Second layer 3 × 3 (5×5 receptive field) layer DMN filters resulted in better and faster training. This may indicate that using an improved DMN approach, one could construct DNNs with much smaller layer sizes.
CONCLUSION
FIG. 5. 2 layer 3×3 DMN filters. The second layer’s filters are propagated through the first layer to produce the 5 receptive field over the image area. The filters of layer 2 shown here do not include the filters due to overlap of layer 1 convolutions.
We showed that, under certain assumptions of uniform sampling in the training dataset, low-lying layers in deep neural networks converge to, and therefore can be trained using, a recursive version of the KL transform. This transform captures the statistics of the data and can be done efficiently even using a fraction of the training data. WE call these networks Density Matrix Networks (DMNs). We showed that, at least in the first layer, such networks can perform superior to larger convolutional networks, while having far smaller number of filters. Some theoretical and practical challenges remain for using multi-layer DMNs, but initial results seem promising.
Indexing of Gradient Descent
which means that only a fraction of the computation is necessary. We then tested a single layer 3 × 3 DMN before the dense layers and the accuracy went down to 0.949. This is probably suggesting that relevant features in MNIST span areas larger than 3 × 3 blocks and therefore, even though it is advantageous over not having a DMN layer, the gain in accuracy is modest at best. We also experimented with multi-layer DMNs, but the results are still preliminary. If we do the naive truncation of the filters in the second layer, based on the energies, as shown in Fig. 3, we actually get accuracies of 0.916. This is below a single layer DMN and even less than the dense layers alone. Although our multi-layer networks have not been successful yet, we are positive that the solving the disentanglement problem will improve their fidelity. One other point to note is that the accuracy of using DMNs increases if we discard filters with very high energies, meaning the features that are extremely rare in the data. We checked that only keeping the first few relevant second
Eq. (10) has both channel and location indices which had been omitted for clarity. The full equation with all indices reads δg b δw(1) a (z, z 0 )
=
N X
(0)
hib (z)
i=1 C1 X
Z
� � (0) T c1 (0) (z0 ) dz0 dz1 hi − hi
c1 =1 2
C X
T c2
a
w(1) c1 (z0 , z1 )K (2) c2 (z1 , z 0 ).
(18)
c2 =1
[1] E. Gardner, Journal of physics A: Mathematical and general 21, 257 (1988). [2] E. Barkai, D. Hansel, and I. Kanter, Physical review letters 65, 2312 (1990).
8 [3] D. J. Amit, H. Gutfreund, and H. Sompolinsky, Physical Review A 32, 1007 (1985). [4] Y. LeCun and Y. Bengio, The handbook of brain theory and neural networks 3361, 1995 (1995). [5] Y. LeCun, Y. Bengio, and G. Hinton, Nature 521, 436 (2015). [6] J. Schmidhuber, Neural Computation 4, 234 (1992). R in Machine Learn[7] Y. Bengio, Foundations and trends ing 2, 1 (2009). [8] A. Krizhevsky, I. Sutskever, and G. E. Hinton, in Advances in neural information processing systems (2012) pp. 1097–1105. [9] K. Simonyan and A. Zisserman, arXiv preprint arXiv:1409.1556 (2014).
[10] A. L. Maas, A. Y. Hannun, and A. Y. Ng, in Proc. ICML, Vol. 30 (2013). [11] Y. Bengio, P. Simard, and P. Frasconi, IEEE transactions on neural networks 5, 157 (1994). [12] E. J. Cand`es and M. B. Wakin, IEEE signal processing magazine 25, 21 (2008). [13] E. J. Candes and T. Tao, IEEE transactions on information theory 51, 4203 (2005). [14] K. Fukunaga, Introduction to statistical pattern recognition (Academic press, 2013). [15] C. Szegedy, W. Liu, Y. Jia, P. Sermanet, S. Reed, D. Anguelov, D. Erhan, V. Vanhoucke, and A. Rabinovich, in Proceedings of the IEEE Conference on Computer Vision and Pattern Recognition (2015) pp. 1–9.