early dropping best-effort traffic or forcing routing changes using traffic ... work performance monitoring, making it easy to solve end-to- end performance ...
Coping with Distributed Monitoring of QoS-enabled Heterogeneous Networks Ren´e Serral-Graci`a, Pere Barlet-Ros, Jordi Domingo-Pascual Advanced Broadband Communications Centre, Technical University of Catalunya (UPC), Spain {rserral, pbarlet, jordid}@ac.upc.edu Abstract— Service providers’ portfolio is continuously increasing with emerging real-time services, which are offered to current and new potential clients with an associated fee. In order to properly charge such a fee, both service providers and customers must have guarantees that the offered services are correctly delivered. One way of acquiring on-line information is by monitoring some traffic parameters like one way delay or packet loss. The issue in a real scenario arises when many connections must be monitored, involving diverse underlying network technologies and different Quality of Service policies. This makes broad deployment of a measurement infrastructure very challenging. This paper presents a distributed monitoring infrastructure for tracking the QoS offered by the network. Its novelty resides on efficiently handling the resources to obtain a scalable solution that operates over heterogeneous networks. Traffic aggregation techniques are presented with the purpose of optimising the used network resources. The proposed design has been deployed and validated in a scenario using an European-wide testbed. In particular for this scenario we used heterogeneous network technologies deployed within the framework of the IST EuQoS project. This offers a convenient environment where to examine the feasibility of the solution.
I. I NTRODUCTION As the deployment of real-time services spread all over the network, the necessity of providing mechanisms to guarantee their proper quality increases. Historically, those guaranties have been achieved by means of Quality of Service (QoS) techniques. However, given that customers pay for the service, they require guaranties on the fulfilment of their contracts. From the application point of view, this implies that specific network constraints (i.e. One-Way Delays, Packet Loss Ratio, etc.) are provided within the specified thresholds. The network has to guarantee those parameters and, in a QoS environment, take the necessary actions when they are not being properly provided. Actions to enforce QoS contracts are, for example, early dropping best-effort traffic or forcing routing changes using traffic engineering [1]. The goal of this paper is to provide mechanisms to inform the network whether the QoS parameters are being properly provided or not. The focus resides on the design of a generic passive networking analysis infrastructure named Network Parameter Acquisition System (NPAS). Although it can be This work was partially funded by IST under contract 6FP-004503 (ISTEuQoS), MCyT (Spanish Ministry of Science and Technology) under contract TSI 2005-07520-C03-02 and the CIRIT (Catalan Research Council) under contract 2005 SGR 00481.
used in any network monitoring scenario, this work aims at the application and deployment of this system for on-line QoS reporting. This work presents the full system, but the main validation focus on intra-domain and heterogeneous scenario supporting end-to-end QoS. This paper covers the description of the basic architecture, which has high demands on network resources. It also presents optimisations over the system by introducing aggregation techniques. Specifically, the improvements focus on reducing the required resources and bandwidth usage of the control traffic but with minimum loss on the result’s accuracy. This work differs from the related research efforts in the area by proposing a full featured solution for on-line QoS reporting that gives accurate results while using a reasonable amount of resources. The validation of the proposal is performed on a real European-wide testbed provided by the IST EuQoS project [2]. Such experimental tests show the high reduction (over 56%) of the required bandwidth for on-line reporting. The rest of the paper is structured as follows. The next section overviews the related work. Section III discusses the proposed Network Parameter Acquisition System. The paper follows with the improvements to the base system by reducing the required control traffic. Section V focuses on the study and the effect of applying such optimisations in different real environments compared to the basic proposal. The paper finishes with the conclusions and further studies related to this work. II. R ELATED W ORK In network monitoring the reduction of the required resources for monitoring high speed networks is important [3]. It is accomplished by using different techniques such as traffic sampling which permits to infer with high accuracy the traffic characteristics [4]. Such techniques are useful as base knowledge to build monitoring systems as we already discussed in [5]. Usually such optimisations only consider a centralised scenario. In the field of distributed platforms for QoS validation, similar approaches have been discussed before in projects such as perfSONAR [6] and InterMON [7]. On the one hand, perfSONAR is an infrastructure for network performance monitoring, making it easy to solve end-toend performance problems on paths crossing several networks. It focuses on studying the capacity and availability of the
links, while our work analyses directly the QoS constrained traffic within the link, specifically its perceived quality. In QoS environments this is a basic requirement since flows can have different treatment depending on its CoS. As a consequence, analysing the raw link might drive to inaccurate results. Moreover, perfSONAR is focused on service oriented performance, while we aim to deliver a network service to interact with a QoS control plane, rather than an end-user interface, which cannot react to network events in real-time. InterMON, on the other hand, focuses on the data gathering, its automated access and database design for inter-domain QoS analysis [8]. This infrastructure aims to deliver human understandable information, while our approach delivers network related data to be interpreted by decision taking entities to guarantee the quality of service. Zseby et al. in [9] propose different methods for efficient distributed flow and packet identification. In this work, we use these techniques to provide a full featured network infrastructure for on-line QoS reporting. III. N ETWORK PARAMETER ACQUISITION S YSTEM The Network Parameter Acquisition System (NPAS) is a distributed infrastructure for real-time QoS parameter measurement and on-line reporting. It has three main features, i) both intra and inter-domain traffic analysis, ii) end-toend information reporting, and iii) hardware and network independence. Although the platform has been designed to operate on both intra and inter-domain environments, this work mainly focuses on the intra-domain scenarions. Its evaluation in inter-domain environments constitutes an important part of our future work. The QoS parameter acquisition is performed by collection points spread over the network. These collection points report to a higher level entity within the network domain that extracts QoS information about the traffic under QoS constraints. This entity and its associated collection points form a Measurement Domain (MD). This distributed infrastructure is required because each collection point can only access to local packet information, while usually most QoS metrics such as One-Way Delay require distributed information (i.e. timestamps from the collection points). This provides a two layer infrastructure. The first layer is in charge of MD reporting, where detailed traffic information is gathered and reported to the higher level unit. While the second layer covers inter-domain reporting which consists of publishing aggregated information about the traffic. The traffic is aggregated depending on the underlying network, for example using classes of service. With this approach it is possible to reduce the overhead caused by the gathering and publishing of QoS parameters, specially on inter-domain links where the control traffic might be subject to some constraints. In our current implementation the extracted packet information includes the One-Way Delay (OWD), Packet Loss Ratio (PLR) and IP Delay Variation (IPDV) but it could be easily extended. This information is published to higher control entities (i.e. QoS control plane).
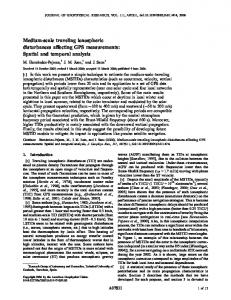
Fig. 1.
NPAS structure
NPAS is divided into three main entities as shown in Figure 1: i) Monitoring Entities, ii) Processing Entities and iii) InterDomain Subscriber Entities. Full discussion of each entity follows. A. Monitoring Entity The Monitoring Entity (ME) collects the QoS constrained traffic and extracts the required parameters (e.g., reception timestamp, packet size, etc.) for later processing. Since MEs act autonomously over a single network point, they only get local packet information. Thus, for computing QoS parameters involving delays or packet losses, several ME are required. ME is divided into two different parts, the Hardware Dependent Monitoring Part and the Hardware Independent Monitoring Part. 1) Hardware Dependent Monitoring Part (HDMP): It is in charge of performing the traffic collection depending on the underlying hardware and network technology. HDMPs need to have direct access to the traffic. Usually, this involves the use of optical splitters or monitoring ports on the switches to replicate the traffic towards the ME, where it can be collected without interfering with the normal operation of the network. 2) Hardware Independent Monitoring Part (HIMP): It abstracts all the hardware details managed by the HDMP, sets up collection policies and provides a generic interface for collecting the QoS traffic. It also reports such information to the higher level entities in charge of the processing and QoS parameter extraction. Collection policies are based on a selection function that determines the level of aggregation.The packet filtering policy is set up by the administrator or the QoS Control Plane. In this work we will consider as a proof of concept Per Flow and Per CoS aggregation. The ME has to uniquely identify every collected packet to report its network information to the higher level entity, which will gather the information of all the ME to extract the QoS metrics. There are two different identifiers, a packet identifier and an aggregate identifier. The packet identifier (PID ) (32 bit) is generated by a fast CRC computation. It is obtained from: IP Source and Destination, Datagram Identifier, Protocol Identifier and 27 bytes of
Each ME reports per packet information to its PE. This control traffic introduces a significant overhead within the MD. In later sections we evaluate the amount and effects of such control traffic. All this information is forwarded to the QoS control plane and to the inter-domain entity (whose interface and functionality is out of the scope of this paper). The QoS control plane will take the required actions to assure that the QoS is provided. Fig. 2. Frame format. Flow Descriptor (FD ) (top) and Packet Descriptor (PD ) (bottom)
the packet’s payload. And optionally, the TCP Window which permits to distinguish among retransmissions when TCP is used. Using 27 bytes of the packet’s payload overcomes the identifier’s collision caused by some operating systems leaving a blank Datagram Identifier. This approach only requires to process a small portion of the packet. Further discussion about the selected fields can be found at [9]. The aggregate identifier (AID ), for the sake of simplicity, is considered as a flow identifier without loss of generality. The flow identifier (FID ) (32 bit) must be unique, as it identifies a given flow on all the ME. It is obtained similarly to the PID by computing a fast CRC, as described in [9], using the following header fields: Source and Destination Addresses (32 or 128 bits each), Source and Destination Ports (16 bits each) and Protocol (8 bits). The Type of Service field used sometimes as part of the flow identifier [9] is not considered, since in a QoS environment this field might change along the packet’s path depending on the DiffServ policies [10]. This Flow Descriptor is (|FD | = 13) bytes long, and it is sent independently to the Processing Entity for the first packet of each flow. The per packet information sent to the Processing Entity (each ME) is the minimum indispensable for extracting endto-end QoS metrics. The descriptor is |PD | = 18 bytes long and it is shown in Figure 2 for later reference. B. Processing Entity The Processing Entity (PE) is the MD entity in charge of gathering the traffic parameters extracted by the MEs. It uses the PID and the FID fields to classify the packets and to identify them on each ME. Once a packet has been collected on all the MEs of its path it is possible to: • Identify the ingress and egress points within the MD along the packet’s path. • Compute QoS parameters needed by higher layers within the MD: – One-Way Delays from each reported timestamp on the MEs, as described in RFC 2679. – IP Delay Variation as defined in RFC 3393. – Packet Losses that are detected when a packet appears on one or more ME, but not in the others down the path, as specified in RFC 2680.
C. Inter-Domain Subscriber Entity Although a detailed description of the IDSE is not the goal of this paper, an introduction to the subject is performed in order to provide complete information to understand the full system’s design and architecture. End-to-end reporting involves often inter-domain links. Usually such scenarios belong to different administrative domains, which might limit the interchanged control traffic. This renders the mechanism explained above not suitable for inter-domain reporting, since it assumes no constraints over the control traffic. Moreover deploying broadly such resource intensive mechanism is clearly not scalable. IDSE is deployed as a service offered under subscription by each MD. It publishes aggregated QoS details from each PE to allow legitimate subscribers to extract them. The information is aggregated on a per CoS basis. This aggregation level is feasible given that in DiffServ domains all the CoS receive similar treatment on the MD. This overcomes the scalability problems as the number of CoS is low (typically 5 as defined in [11]). The subscribers of this service are authorised entities (e.g. a peer MD or a network administrator) who query all the MD on the interesting flow’s path to compute whether the end-to-end QoS is provided or not. IV. BANDWIDTH OPTIMISATION Deciding the information that must be available on the PE or IDSE is not enough for having a scalable and reliable reporting system. This section details the intra-domain protocol for reliable and efficient reporting along with the cost of the solution in terms of bandwidth. The Intra-Domain Reporting Protocol (IDRP) specifies the information exchanged between ME(s) and PE. This protocol aims to reduce the used bandwidth in the ME’s and PE’s communication while keeping accurate information about QoS metrics. The basic approach presented so far reports the QoS metrics in a per packet basis. Besides the obvious overhead caused by the IP headers, the whole solution is very expensive in terms of bandwidth. As described before, each new flow generates a 13 byte flow descriptor (FD ) that is sent separately from the packet’s information. Together with FD a PD is generated for each packet. It requires a 18 byte data structure as already shown in Figure 2. In summary, reporting per packet information depends on the new flow rate and the packet rate for each monitored flow,
which follows expression 1. n
BW = |FD | · NFR + |PD | ∑ PRi
(1)
i=1
where NFR represents the rate at which new flows per second arrive. PRi holds the packet rate of flow i for all flows under analysis. As can be noted the bandwidth usage of this mechanism grows linearly with the new flows and packet rate. In order to overcome this high demands the rest of this section presents an optimisation to the system by using traffic aggregation. A. Intra-Domain Reporting Protocol The NPAS as specified above is a reliable alternative to online QoS parameters reporting. However, the fact that it needs to report information in a per packet basis makes the solution expensive in terms of used bandwidth between the PE and all MEs. It could be an issue even if this traffic is limited within an administrative domain. We propose a packet aggregation mechanism to reduce this resource consumption. The proposed aggregation mechanism, instead of performing per packet reporting, uses a Time Window (TW) for packet collection. Such time window is defined by a time interval t that sets the reporting rate. This solution permits to reduce the reporting overhead at expenses of delaying the packet’s reporting. The frame format is shown in Figure 3. The fields contain: • Window ID: It is an identifier which indicates the base time window on the ME for the aggregation group. It contains the timestamp of the window start time. • AID : It contains the aggregate identifier. • Packet’s CRC: Identifier for matching packets among ME. • Offset: Offset of the current packet since the beginning of the time window.
Fig. 3.
Frame format
Expression 2 models the bandwidth required in the aggregation case. n 1 BW = |AD | · NFR + |PID | ∗ (|AID | ∗ AR + ∑ PRi ) t i=1
(2)
All the values in the expression relate to the time window (t). AR stands for the Aggregates Rate representing the number of different aggregates per TW. Depending on the aggregation type, the required bandwidth might vary largely, as it relies on NFR and AD . Although, several types of aggregation might be used, as a proof of concept, this work uses Flow and CoS aggregation. The choice is compelled by the different overhead present on each alternative. When using flow aggregation the overhead tends to be high, as there can be many new flows per time window, with the
Fig. 4.
Time Window alignment problem
corresponding FD (13 bytes) and the flow identifier (32 bit). While for CoS aggregation the overhead is much lower since CoSs are limited in real scenarios. For example in ITU’s recommendation [11] just 5 Classes of Service plus best effort are defined. This represents a negligible CoS descriptor. The drawback of high aggregation techniques, such as CoS aggregation, is the loss of information tied to it, as different flows from different sources and to different destinations are aggregated as similar traffic. In this context this is not an issue as Differentiated Services guarantee that each class is treated fairly on the whole DiffServ domain [12]. This mechanism requires that all the TW are aligned among all the ME on the MD, since PE matches each packet on the fly, it requires that the information for the same packet arrives as close as possible from all the ME. Even with this TW alignment among ME, in the window edges some packets can fall on different time windows as shown in Figure 4. This is caused by non- constant One-Way Delays. For example P3 in ME1 , which is in Time Window TW − 1 ends up in TW − 2 for ME2 . The TW misalignment can be avoided by having a buffer in the PE with a history of n time windows. The value H = n ×t determines the time threshold when a packet falls out of the buffer, and is considered as lost by the system. Provided that the analysed traffic in QoS is constrained, it means that such traffic is sensible to high one way delays, so considering these packets as lost is not an issue while having limits above the QoS policies. n and t are critical parameters. t determines the reporting interval latency while n limits the packet’s OWD. It is important to consider the following issues when choosing the values for these parameters: • The traffic under analysis has QoS restrictions. • Big t lead to high lags in the reporting. • Both t and n determine the required memory, into the ME and into the PE. The system requires fast response when the desired QoS is not provided, which implies small values for t. At the same time, H must guarantee that all the traffic within delay and loss limits is properly identified. This can be accomplished by using high values of t or n. As reflected in [11] depending on the classes of service, the upper OWD bounds end-to-end are around 400ms with a IPDV of ±50ms (notice that this values might differ depending on QoS policies).
V. E XPERIMENTAL E VALUATION With the goal of validating the feasibility and resource consumption of NPAS, we performed a series of tests in different real scenarios. Such tests aim to prove that the system can be deployed with bearable resource consumption. The tests also state experimentally the effects of the different parameters in IDRP (t and n). A. Testing environment Two different sets of tests have been performed with the goal of, i) Experimentally evaluating the values t and n presented above. ii) Estimating the real bandwidth used by NPAS on a trace obtained in a real backbone. In order to do such evaluation, two different environments are used: 1) EuQoS testbed: In order to experimentally obtain suitable t and n values we used the testbed provided by the IST EuQoS project [2]. The EuQoS project, besides developing a solid infrastructure for end-to-end QoS provision, provides a European wide testbed which allows us to test different technologies, resulting in a representative scenario where to deploy NPAS. There are currently eleven different local testbeds which are interconnected via the G´eant network and National Research and Education Networks (NRENs) through private tunnels whose topology form a configurable mesh. Each partner’s testbed uses different network technologies. Such as: UMTS, xDSL, Ethernet, Gigabit Ethernet and WiFi (802.11). For the purposes of this work, the whole testbed will be considered as a single MD. 2) Backbone traffic collection: Although the EuQoS testbed is suitable for testing under controlled traffic loads, to experimentally evaluate the scalability of the proposal, more knowledge of operational traffic from a real network is required. Hence, to estimate the used bandwidth of the system we performed a full link collection in different hours on a collection point located in a vantage Gigabit Ethernet link on the backbone of the Spanish and Catalan NREN. This point permits to compute and analyse traffic characteristics such as number of packets, number of flows and amount of new flows per time unit. This allows us to estimate the bandwidth NPAS uses in a real traffic environment. B. Experimental selection of n and t in IDRP We used some real network information to have a clearer idea of typical end-to-end OWD characteristics of the network.
6 n=1 n=3 n=5
5 (%) Outside window
Choosing t and n complying with the above restrictions has the trade off between fast response and traffic parameters limits. Regardless of the election H ≥ 450ms must hold in order to guarantee that the parameters are within the limits. Sensible values for t range from 50 to 225ms. In the case of n in normal conditions it ranges from 2 (to avoid the alignment problem) to 9 (as H = n×t for t = 50ms). Although depending on the QoS policies this values can differ. An experimental analysis of t and n is presented on section V-B below.
4 3 2 1 0
50
75 100 125 150 175 200 225 250 275 300 325 350 375 400 Time Window (ms)
Fig. 5.
Error in packet losses count for n = 1, 3, 5
Hence, we performed a set of 520 tests from January until December 2006 using the EuQoS testbed. The tests were composed by a set of combinations of different packet rates, packet sizes and daytime and nighttime tests. A broad range of packet loss and delay variation conditions were encountered given the different cross-traffic found on the network at different days, hours and physical locations all over Europe. That gives good range of one way delays to give proper insights for choosing t and n in the network. The tests were performed by actively generating controlled traffic into the EuQoS network and computing all the end-toend OWD. Later these traces were processed off-line to model the OWD characteristics of the network depending on different t and n values. t and n set the thresholds for packet losses. Figure 5 shows the percentage of packets out of the window due to late arrivals for each t and n. For ease of exposition, the figure only shows the results for n = 1, 3, 5. The results show a non-negligible amount of packets with very high delays (higher than 400ms). This is caused by congested xDSL and UMTS links found in some testbeds. In order to guarantee that most of the packets are within the time window we computed the 99.5 percentile of delay for all the tests, obtaining a value of 509ms. As discussed before H = t × n and for assuring a smaller error than 0.5% H ≥ 509ms, we also need n ≥ 2 because with n = 1 the system suffers of the TW alignment problem exposed before. With these constraints the optimal values for our tests are n = 3 and t = 175. Giving a H = 525ms. Moreover, observing the figure, it also shows the big jump on the delay distribution between t = 150ms and t = 175ms for n = 3 which passes from 2.2% of packets out of the window to less than 0.5%. Another important conclusion is that for n = 5 the small improvement is not worth maintaining the window respect to n = 3. C. Bandwidth usage Apart from the percentage of losses due to TW’s size, the lower is t the higher is the overhead caused by the reporting. This overhead is caused by sending AID for each reporting block. The bandwidth used by this control traffic depends on the packet rate, new flow rate and number of flows per t. To have better insights about the used bandwidth when
TABLE I U SED BANDWIDTH PER BIN t (ms)
N. Flows
N. Pkts
50 75 100 125 150 175 200 225 250 275 300 325 350 375 400
1336 1856 2325 2750 3142 3504 3839 4145 4432 4701 4959 5206 5442 5671 5893
2870 4305 5740 7174 8609 10044 11478 12913 14348 15783 17217 18652 20087 21522 22956
New Flow Rate 101 152 202 253 304 354 405 455 506 556 607 658 708 759 809
BW per flow (Mbps) 4.74 4.68 4.63 4.59 4.55 4.52 4.50 4.47 4.45 4.43 4.41 4.40 4.38 4.37 4.35
VI. C ONCLUSIONS & F UTURE W ORK BW per CoS (Mbps) 3.68 3.68 3.68 3.67 3.67 3.67 3.67 3.67 3.67 3.67 3.67 3.67 3.67 3.67 3.67
deploying our solution, typical traffic characteristics must be known. We collected a packet level trace at the core link of the Spanish NREN. This Gigabit ethernet link has an average load of 360Mbps which under our opinion constitutes a representative sample of backbone traffic. This trace was collected during 30 minutes on November 2005 with a peak of 483Mbps. With a total amount of 103.7 million packets. The results given in this section assume the unrealistic scenario where all the traffic is under QoS restrictions, so the obtained results are strict upper bounds of the real cost of the solution in such a network. Table I summarises the bandwidth required for each t both for the Flow and CoS based aggregation. Values represent absolute bandwidth per ME on the MD. The values on Table I show the average cost when the system reached the stationary state without including the additional cost of registering all the flows by sending FD to PE during NPAS startup. In our experiments during such startup, the maximum new flow rate grows linearly from 1315 to 5756 for 50 and 400ms respectively. Using the original per packet reporting as discussed in section III with this data, the control traffic generated is 8.47Mbps. Using the aggregation techinque presented here, it represents a reduction in the worst case of 56% of control traffic overhead. Using CoS aggregation delivers a control traffic reduction higher than 1Mbps. This reduction is caused by two different factors: 1) AD is not generated as the CoS are decided in advance. 2) In a t period there are a non negligible amount of flows, which require a FID as we discussed in figure 3, while CoS IDs are negligible. It is worth to note that with the traffic reduction resulting from this optimisation the control traffic represents only a 0.9% of the total traffic on the link, even assuming the unrealistic worst case scenario that all flows are under QoS constraints.
In this paper we presented a full-featured distributed QoS monitoring and reporting architecture known as NPAS. This solution is well suited for operating in intra-domain environments, but its design permits to easily upgrade it to interdomain scenarios. Since the basic proposal suffers of scalability problems, this work overcomes this limitation by using well-known techniques based on traffic aggregation. The feasibility of deploying the architecture and optimisations resulting from this work is validated using two real scenarios. On the one hand, we show that the required bandwidth for the control traffic in our system is two orders of magnitude smaller than the studied traffic, by using a packetlevel trace collected at the Spanish NREN. On the other hand, the proper settings for the different system’s parameters are evaluated by using the testbed infrastructure available on the EuQoS project. Besides, the above contributions, some open issues remain for further study. The most important part of our future work resides on the definition and validation of the inter-domain deployment of NPAS. This work will prove useful for having full end-to-end multi-domain on-line reporting of the QoS services. Back in the intra-domain environment further work is required for combining the contributions on this paper with traffic sampling with the goal of further reducing the required control traffic of the system. Another open issue is the use of prediction techniques (e.g. Kalman filters) in order to inform the QoS control plane about potential issues in advance. R EFERENCES [1] Nick Feamster, Jay Borkenhagen, and Jennifer Rexford. Guidelines for interdomain traffic engineering. SIGCOMM Comput. Commun. Rev., 33(5):19–30, 2003. [2] [IST] EuQoS - End-to-end Quality of Service support over heterogeneous networks - http://www.euqos.org/, September 2004. [3] Agarwal D., Gonzlez J., Jin G., and Tierney B. An infrastructure for passive network monitoring of application data streams. In Passive and Active Measurement Workshop (PAM), april 2003. [4] Nick Duffeld. Sampling for Passive Internet Measurement: A Review. Statistical Science, 19(3):472–498, 2004. [5] Ren´e Serral-Graci`a et al. Distributed sampling for on-line qos reporting. In Research Report UPC-DAC-RR-CBA-2007-5, 2007. [6] perfSONAR - http://www.perfsonar.net. [7] [IST] INTERMON - Inter-domain QoS Research - http://www.istintermon.org, September 2003. [8] I. Miloucheva, P.A. Gutierrez, D. Hetzer, A. Nassri, and M. Beoni. Intermon architecture for complex QoS analysis in inter-domain environment based on discovery of topology and traffic impact. In Inter-domain Performance and Simulation Workshop, Budapest, March 2004. [9] Tanja Zseby, Sebastian Zander, and Georg Carle. Evaluation of Building Blocks for Passive One-Way-Delay Measurements. In Passive and Active Measurements Conference, 2001. [10] Fulu Li, Nabil Seddigh, Biswajit Nandy, and Diego Matute. An empirical study of today’s internet traffic for differentiated services ip qos. In ISCC ’00: Proceedings of the Fifth IEEE Symposium on Computers and Communications (ISCC 2000), page 207, Washington, DC, USA, 2000. IEEE Computer Society. [11] ITU-T Recommendation Y.1541. Network Performance Objectives fo IP-based Services, Review Jan 2005. [12] B. Davie, A. Charny, J.C.R. Bennett, and et. al. An Expedited Forwarding PHB (Per-Hop Behavior). RFC 3246, March 2002.