CIRED
22nd International Conference on Electricity Distribution
Stockholm, 10-13 June 2013 Paper 0333
COPULA-BASED MULTIVARIATE STOCHASTIC MODELING OF LOAD DEMAND DUE TO PLUG-IN ELECTRIC VEHICLES IN ORDER TO BE INTEGRATED IN DISTRIBUTION SYSTEM PLANNING Ehsan PASHAJAVID K. N. Toosi University of Tech (KNTU) – Iran
[email protected]
ABSTRACT This paper develops a multivariate probabilistic framework for PEV load modelling to be embedded in system planning problems. In order to successfully integrate the uncertainty attributes of the PEVs in the probabilistic planning issues, relevant vehicular load scenarios is provided through appropriate synthetic data. A student's t copula distribution function is utilized to capture the correlation characteristics among the included datasets namely home departure time, daily travelled distances and home arrival time of the vehicles during weekdays. Then, a Monte Carlo based stochastic simulation is provided to derive hourly load distribution functions of the PEVs. Extraction of the demand profile of the individual PEVs is fulfilled in order to estimate the demand profile of the fleet. The estimated probability distribution functions can be efficiently employed to generate load samples in probabilistic distribution system planning problems.
INTRODUCTION Increasing national security of oil importing countries besides alleviating environmental concerns can be regarded as the main reasons of emphasizing on the proliferation of electric vehicles, especially plug-in electric vehicles (PEVs) [1]. Necessity of power delivering to this vehicular load will require utilities to develop associated structures and modify the existing grids. PEVs including battery electric vehicles (BEVs), plug-in hybrid electric vehicles (PHEVs) and plug-in fuel cell hybrid electric vehicles (PFHEVs) account for vehicles that can be charged directly by plugging into the grid [1]. Moreover, it is possible for these vehicles to inject their stored power back to the grid in order to support its reliability and to flatten the load curve. The former is usually referred as Grid to Vehicle (G2V) while the latter is called vehicle to grid (V2G). Although may be considered as one of fascinating attributes of PEVs, V2G will not be feasible in the near future due to lack of sufficient technical infrastructures. On the other hand, implementation of the controlled charging techniques conflicts with the consumers desires to charge their PEVs as fast as possible. This means utilities should be prepared at first to handle the uncontrolled charging demand of PEVs. The distribution system planning problems should attempt to provide a reliable and cost effective service to consumers
CIRED2013 Session 5
Paper No 0333
Masoud ALIAKBAR GOLKAR K. N. Toosi University of Tech (KNTU) – Iran
[email protected] while satisfying constraints such as keeping voltages as well as power quality within standard limits. Taking into account newly installed loads is an essential step for the planning issues that highly influences their outcomes. Electrifying the transportation sector introduces a new kind of electric demand that impose challenging complexities on the system planning problems. Regarding lack of historical vehicular load statistics, planners depend on load estimations for effective planning. PEVs load demands are probabilistic and follow their owners' driving habits and working schedules. Therefore, multivariate probabilistic methods should be employed in order to estimate PEVs power demand taking into account their stochastic attributes. It is worthy to notice that deficiencies in estimation of the future vehicular loads may results in system shortages or over expenditures. Copula function is adopted in this paper for modeling the associated uncertainties in terms of vehicles departure time, travelled distances, and arrival time. The proposed methodology establishes a single PEV charging demand model, and then provides required number of demand scenarios for the vehicle fleet integrated in power planning problems. The non-Gaussian probability density functions (PDFs) of the power consumptions within each hour is extracted that can be efficiently employed to generate required number of random samples of the demand power within the probabilistic system planning
COPULA FUNCTION Copulas are functions that characterize dependencies among variables, and present an approach to create distributions that model correlated multivariate data [3]. Applying a copula, a multivariate distribution can be constructed by specifying marginal univariate distributions, and then, combining the univariate distributions to provide dependence structure. Actually, copula functions, C:[0 1]p-[0 1], are used to relate univariate marginal distributions, F1(x1), F2(x2), …, Fp(xp), to their joint distribution function, H(x1, x2, …, xp), as below:
C (F1 (x 1 ), F2 (x 2 ),..., Fp (x p ), ρ) H (x 1 , x 2 ,..., x p ) where Fk(xk)=uk, k=1,…,p and H are the cumulative distribution functions (CDF). It should be stressed that the copula function does not constrain choice of the marginal distributions. Due to the fact that the student's t copula presents more observations in the tails than the Normal copula, it is more
CIRED
22nd International Conference on Electricity Distribution
Stockholm, 10-13 June 2013 Paper 0333
suitable for modeling of real life data. The multivariate student's t PDF, ht, is parameterized with ρ, the linear correlation matrix, µ=[µ1, µ2, …, µp]T, mean vector and υ, the degrees of freedom. Let ρ be a symmetric, positive definite matrix with unity diagonal members and Ht the standardized (µ=0) student’s t joint CDF: p 12 2 ρ ( ) 2 p
ht (x)
1 1 (x μ) ρ 1 (x μ) 2
H t (x 1 , x 2 ,..., x p )
x1
x2
(2)
p
T
2
xp
... ht dx 1 dx 2 ...dx p
(3)
where Γ(.) is the Gamma function. Then, for any u = (u1,...,up) ∊ [0 1]p the student's t copula is defined as follows:
C t (u1 ,...,u p ) H t (Ft 1 (u1 ), Ft 1 (u 2 ),..., Ft 1 (u p ))
Ft 1 (u1 )
Ft 1 (u 2 )
...
Ft 1 (u p )
(4)
ht dx 1 dx 2 ...dx p
1
where Ft is the inverse of the univariate CDF of student’s t with υ degrees of freedom.
THE PROPOSED FRAMEWORK Figure 1 illustrates block diagram of the developed framework for stochastic modeling of the PEVs load demand.
Datasets and modelling parameters At the first step, it is essential to provide statistical datasets related to the vehicular demand. As abovementioned, lack of historical PEV load data necessitates estimation of the demand according to the associated parameters like vehicles departure time, travelled distances and arrival time. Theses random variables (RVs) depend on the owners' method of life and work schedule. The datasets employed in this study are related to a number of commuting conventional internal combustion engine (ICE) vehicles in Tehran. Moreover, modelling parameters such as batteries depth-ofdischarge (DOD) as well as batteries capacity (BATTCAP) in addition to the efficiency coefficient of electrical and mechanical components of the PEVs should be available by the producers. The simulation parameters applied in the case study are visible in Table 1. Table 1. The simulation parameters DOD BATTCAP EFFDRV EFFChrg
70% 20kWh 3km/kWh 90%
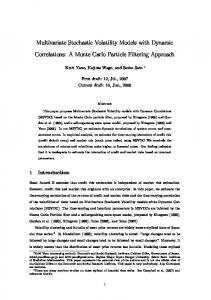
Stochastic modelling methodology A three dimensional student's t copula is utilized to model the correlation among the datasets. Without considering the correlation characteristic, the obtained results cannot be rational and reliable. Figure 2 describes the employed copula algorithm. First, appropriate univariate non-Gaussian CDFs should be fitted to the three mentioned RVs. As may be seen in Fig. 3(a), the Weibull CDF is suggested as the most appropriate function to be fitted to the departure time dataset. To model the travelled distances as well as the arrival time a type III generalized extreme value CDF is derived and the results are illustrated in Fig. 3(b) and Fig. 3(c) respectively. It is seen that the fitted non-Gaussian CDFs provide accurate approximation of the original datasets. Then, these CDFs are utilized to transform datasets to corresponding uniform sets. The parameters of the fitted distributions can be found in [4]. Afterwards, copula fitting can be accomplished through calculation of the correlation among the datasets. Correlation matrix of the mentioned datasets employed in the case study is obtained as follows:
0.48 0.31 1 ρ 0.48 1 0.39 0.31 0.39 1
(5)
Eventually, the extracted copula can be utilized to generate correlated samples. The fitted student's t copula function with 5 degrees of freedom, Ct: [0, 1]3-[0, 1], is utilized to relate the mentioned univariate marginal distributions. Figure 4 illustrates scatter plots of the randomly generated datasets related to one PEV. Modeling parameters: DOD EFFDRV EFFChrg BATTCAP
Gathered datasets: Departures Distances Arrivals
Stochastic modeling Methodology
System planner: Number of PEVs Number of scenarios
PDFs of Vehicular demand within each hour
Generating PEV demand scenarios
Fig 1. The developed framework for stochastic PEV load modeling
Marginal distributions
Data transforming to the uniform space
Estimating the linear correlation and random generating
Transforming unified data to t distribution
Transforming samples to the uniform area
Generating output datasets according to the marginals
Fig 2. The algorithm for utilizing the student's t copula
CIRED2013 Session 5
Paper No 0333
CIRED
22nd International Conference on Electricity Distribution
Stockholm, 10-13 June 2013 Paper 0333
during daily hours for a fleet of 50 PEVs in addition to the suggested PDFs fitted to them.
Data Weibull CDF
0.6
Generating PEV demand scenarios
0.4
0.2
0
6
6.5
7
7.5
In order to achieve a successful planning algorithm for the distribution systems supporting load demand due to vehicular loads, it is essential to take their uncertainties into account. By estimating hourly PDFs of these loads, it becomes straightforward for planners to produce as many as demand samples that satisfy their planning criterions. The randomly generated load profiles in addition to the conventional load profiles can be efficiently applied in a probabilistic distribution system planning procedure. As an example, Fig. 6 demonstrates a number of load scenarios for one PEV generated regarding the extracted PDFs besides their average scenario.
8
Departure time (hour)
(b) Cumulative probability
1 Data Gev CDF 0.8 0.6 0.4 0.2 0
5
10
15
20
25
30
35
40
45
50
55
Travelled distance (km)
(c) Cumulative probability
1
Data Gev CDF
0.8 0.6 0.4 0.2
55 0
16
16.5
17
17.5
18
18.5
19
19.5
20
20.5
50
Arrival time (hour)
Fig 3. The data and CDFs of (a) home departure time, (b) daily travelled distance and (c) home arrival time.
PDFs of vehicular demand within each hour The battery state-of-charge at the arrival time (SOCinit) is extracted based on the daily travelled distances. Taking into account the fact that available charging time in home charging is usually bigger than the necessary time to fully charge the battery, it is logical to assume that the battery SOC at the departure time are 100%. Therefore, the SOCinit of a PEV can be extracted as:
(a)
Travelled distance (km)
(a) Cumulative probability
1
0.8
45 40 35 30 25 20 15 10 5 5.5
6
6.5
7
7.5
8
8.5
8
8.5
Departure time (hour)
20.5
where TRAV stands for travelled distance and EFFDRV indicates the efficiency coefficient of a PEV that depends on the driving patterns and traffic conditions as well as power electronics-based driver efficiency of the electric motors. The hourly power consumption of the PEVs can be estimated after arriving home. Extraction of the demand profile of the individual PEVs is fulfilled in each iteration of the Monte Carlo simulation regarding the following steps: -
-
SOCinit is calculated using (5). The charging available time is evaluated by subtracting arrival time from the departure time that will be happened tomorrow. Taking into account power rate of the charging system and the PEV battery capacity, the load demand within daily hours is estimated.
(b)
Arrival time (hour)
20
(5)
19.5 19 18.5 18 17.5 17 16.5 16 15.5 5.5
6
CIRED2013 Session 5
Paper No 0333
7
7.5
20.5 20
(c)
19.5 19 18.5 18 17.5 17 16.5 16 15.5 10
By accomplishing the Monte Carlo simulation, it is possible to fit appropriate PDFs to the power consumption samples obtained during each hour. These PDFs that characterize load demand of PEVs in each hour can be used to generate scenarios of vehicular demand required by the system planners. Figure 5 shows a number of demand distributions
6.5
Departure time (hour)
Arrival time (hour)
SOCinitn
TRAVn 100 100 EFFDRV BATTCAP
20
30
40
50
Travelled distance (km)
Fig 4. Scatter plots between (a) departure time and travelled distance, (b) departure time and arrival time, (c) travelled distance and arrival time.
CIRED
22nd International Conference on Electricity Distribution
Stockholm, 10-13 June 2013 Paper 0333
-4
1.2
x 10 1.6
Extracted dist. Inverse Gaussian
h = 16 o'clock
1
Load demand (kW)
1.4
(a)
Density
1.2 1 0.8 0.6 0.4
0.8 0.6 0.4 0.2
0.2 0
5
15
25 Demand power (kW)
35
45
0
15
16
17
2
Extracted dist. Generalized extreme value
(b)
Density
h = 17 o'clock
40
45
50 Demand power (kW)
19
20
21
22
23
24
1
2
3
4
55
Fig 6. Load demand scenarios due to one PEV extracted employing the fitted PDFs.
plug-in electric vehicles. Accordingly, the methodology of obtaining appropriate probability density functions of the power consumptions of these vehicles during daily hours has been suggested and applied within a case study.
1
0
18
Hours
-4
x 10
60
-4
x 10
h = 18 o'clock
(c)
Density
2
REFERENCES
Extracted dist. Student's t
1
0
46
50
54 Demand power (kW)
58
62
-4
x 10
Extracted dist. Weibull
1.2
(d)
Density
1
h = 20o'clock
0.8 0.6 0.4 0.2 0
36
40
44 48 Demand power (kW)
52
56
-4
x 10
Extracted dist. Inverse Gaussian
h = 21 o'clock
1
(e)
Density
0.8
0.6
0.4
0.2
0
30
35
40 45 Demand power (kw)
50
-5
x 10 9
Extracted dist. Normal
h = 22o'clock
8
(f)
Density
7 6 5 4 3 2 1 0
20
25
30 35 Demand power (kw)
40
45
Fig 5. Some samples of the distributions of PEVs demand power during daily hours as well as the fitted PDFs to them.
CONCLUSION Integration of the vehicular loads into the probabilistic distribution system planning problems has been addressed in this paper. An stochastic modeling framework has been thoroughly elaborated that can be efficiently employed in order to take into account the uncertainty attributes of the CIRED2013 Session 5
Paper No 0333
[1] A.Y. Saber and G.K. Venayagamoorthy, 2009 ,“One million plug-in electric vehicles on the road by 2015”, in Proc. the 12th International Conf. Intelligent Transportation Syst., pp. 141 – 147. [2] M. A. Golkar and E. Pashajavid, 2011, “Analytical assessment of mutual impacts between PHEVs and power grid”, 21st International Conf. Electricity Distribution (CIRED), Frankfurt. [3] J.H. Gatz, “Properties and Applications of the Student T Copula”, Master dissertation, Delft Univ. Tech., Jul. 2007, [Online]. Available: http://risk2.ewi.tudelft.nl/ research-andpublications/doc_download/153gatzthesis pdf [4] E. Pashajavid and M. A. Golkar, 2012, “Charging of plug-in electric vehicles: Stochastic modelling of load demand within domestic grids”, 20th Iranian Conference on Electrical Engineering, (ICEE2012), Tehran, Iran.