alloy, and of the effect of retrogression and reaging. (RRA) treatments on the aluminum alloy 7075. It ... microstructures produced by the various heat treat- ments ...
Materials"Science and Engineering, A 114 (1989) 197-203
197
Correlation between Microstructure and Calorimetric Behavior of Aluminum Alloy 7075 and AI-Zn-Mg Alloys in Various Tempers J. K. PARK
Department of Materials Science and Engineering, Korea Advanced Institute of Science and Technology, Seoul (South Korea) A. J. ARDELL
Department of Materials Science and Engineering, School of Engineering and Applied Science, University of California, Los Angeles, CA 90024 (U.S.A.) (Received October 6, 1988; in revised form January 31, 1989)
Abstract
The results of detailed microstructural analyses of the commercial aluminum alloy 7075 in several tempers, combined with consideration of similar data on pure A l - Z n - M g alloys, are shown to provide a sound basis for the interpretation of various calorimetric studies reported in the literature. Particular emphasis is placed on the analysis of differential scanning calorimetry (DSC) data on the peak-aged microstructure of both types of alloy, and of the effect of retrogression and reaging (RRA) treatments on the aluminum alloy 7075. It is demonstrated that all the salient features of the DSC curves can be rationalized with the precipitate microstructures produced by the various heat treatments, specifically rl' precipitates in the peak-aged alloys and mixtures of rf and r1 precipitates in the slightly overaged and R R A alloys. 1. Introduction The aging sequence in pure A1-Zn-Mg alloys has been the subject of numerous studies using indirect methods such as hardness measurements [1, 2], resistivity measurements [3] and calorimetry [3, 4], as well as more structurally informative X-ray investigations [5-10]. It is generally accepted that Guinier-Preston (GP) zones appear initially at temperatures below about 100 °C, irrespective of whether the composition lies in the a + r/ or a + T phase fields. The range of temperatures over which GP zones are stable has been observed to increase with increasing concentration of zinc. A recognizable signature of early calorimetric studies [3, 4, 11] was the appearance of a low 0921-5093/89/$3.50
temperature endothermic peak in samples aged at room temperature (naturally aged). The temperature of this peak was observed to shift steadily to higher temperatures with increases in the aging temperature and time. This was attributed to the increase in the size of GP zones with increasing aging time and temperature, larger sizes shifting the peak to higher temperatures because capillarity reduces the thermal stability of small particles. Similar results have been observed in recent studies using differential scanning calorimetry (DSC) [12-14]. The kinetics of aging of the commercial aluminum alloy 7075 have not been thoroughly studied, although the microstructure in particular temper conditions has received considerable attention [15-19]. In the earliest transmission electron microscopy (TEM) studies it was concluded that the precipitate population in the peak-aged condition (T651) consists primarily of GP zones [15-17], although no concrete evidence was presented to substantiate this conclusion. We performed a detailed microstructural study [18] and showed that r/' precipitates rather than GP zones are the predominant constituent in samples of alloy 7075-T6. Despite this direct evidence, the controversy on the nature of the precipitates in alloy 7075-T651 has not abated substantially. One reason for this is the interpretation of the results of DSC studies [20-23], including recent work on the effect of the retrogression and reaging (RRA) treatment [23] on the microstructure. The DSC investigations have been cited [22, 24] as providing strong evidence that GP zones rather than t/' precipitates are the main constituent of the T651 microstructure. In © Elsevier Sequoia/Printed in The Netherlands
198
view of t h e persistent controversy, we have recently readdressed this issue [25] in another microstructural investigation of aluminum alloy 7075, particularly in the peak-aged condition, and have reaffirmed our previous conclusion that GP zones constitute at most a minor fraction of the precipitate microstructure of alloy 7075-T6. Since the conclusions from our microstructural work [18, 19, 25] sharply contradict published interpretations of the results of various calorimetric investigations, it is important to reconcile these apparently conflicting bodies of evidence. The purpose of this paper is to present new analyses of previously published data on the calorimetric behavior of both aluminum alloy 7075 and pure ternary A I - Z n - M g alloys, with the objective of achieving this reconciliation.
2. Thermograms representing the microstructures produced by isothermal aging Thermograms characteristic of underaged and peak-aged aluminum alloy 7075 and pure ternary A I - Z n - M g alloys have several common features and several notable differences, as illustrated in Fig. 1. The common features are a low temperature endothermic peak I followed by an exothermic peak II and a broad endothermic peak III. In alloy 7075, endothermic peak I is a single peak and peak II is usually a doublet (Fig. l(a))
0 6-
100 150 200 250 300 350 400 450 500
T(°C) m
loo 1So 200 2so 3oo 35o 400 ,So s6o T(°C) Fig. l. Schematic diagrams of DSC thermograms for (a) aluminum alloy 7075-T651 and (b) pure AI-Zn-Mg alloys aged at intermediate temperatures (60-100 *C).
while, in the pure alloy, peak I is often a doublet and the exothermic peak II is usually a single peak (Fig. l(b)). Some caution is necessary here because the appearances of the peak depend on the aging time, temperature and composition (for the pure alloy). The peak temperatures also depend strongly on the heating rate Q and can increase by as much as about 50 °C on increasing from 10 to 100 °C rain -1 [11, 12]. Figure 1 is, nevertheless, a reasonable schematic representation of the results of numerous observations. The high temperature endothermic peak III is due to the dissolution of the equilibrium r/phase, precipitates of which form mostly during the calorimetric experiments (although some are probably present originally, depending on the aging condition). The position of this endotherm is little affected by the aging temperature and time. Unlike the interpretation of endothermic peak III, the existence itself of the doublet character of the low temperature endothermic peak I (Fig. l(b)) in samples of the pure alloy has been questioned. This is because the positions of peaks Ia and Ib and their appearance depend strongly on both the aging temperature and the aging time; the peak temperatures increase with an increase in either the aging temperature or the aging time. Lendvai et al. [13] observed the appearance of a doublet in an A1-4.8w.t.%Zn-1. l wt.%Mg alloy aged at 60 °C for 24 h ( Q = 80 °C rain- 1). Peak Ib b e c a m e the stronger of the two when the aging temperature was increased to 100 °C. On aging at 120 °C, peak Ia disappeared, leaving only peak Ib. Similar observations have been made on an A1-5wt.%Zn-lwt.%Mg alloy by Zahra et al. [12] and by Lacom et al. [14]. In this alloy (Q = 20 °C min- 1), a small peak Ib was observed independently in samples aged at room temperature for 24 h. In samples aged at 60 °C or above for 24 h, the two peaks overlap and appear as a doublet. Only peak Ib remained in samples aged at 120 °C for 24 h. Zahra et al. [12], Lendvai et aL [13] and Lacom et al. [14] all agree that the doublet character of endothermic peak I (Fig. l(b)) is real and a manifestation of the precipitation process in the pure ternary alloy. Results similar to these were reported earlier by Hirano and Takagi [3] and Asano and Hirano [4]. The thermograms of Hirano and Takagi [3] clearly indicate the doublet character of the low temperature endotherm in samples of an A1-8wt.%Zn-4wt.%Mg alloy (Q = 3 °c min- l), although the nature of the peak(s) depends sensi-
199
tively on the aging time and temperature. The results of Asano and Hirano [4] show more clearly the doublet character and the upward shift of the peak temperatures with increasing aging time in samples of an A1-5.06wt.%Zn-0.94wt.%Mg alloy aged at 40 or 70°C ( 0 = 3 °Cmin-1). Hirano and Takagi [3] and Asano and Hirano [4] interpreted the doublet character of their peaks as due to the overlap of a broad low temperature endothermic peak with a subsequent exothermic peak (e.g. peak II in Fig. l(b)). The findings on the pure ternary alloy agree with the results of the X-ray studies [6-8], i.e. GP zones gradually transform to t/' particles, the transformation rate depending on the aging temperature and time. These results indicate that the transformation rate becomes appreciable at temperatures above about 70 °C, which is probably why peak Ib becomes visible in samples aged for only 24 h above about 60 °C. We thus believe that two real peaks exist within the first endothermic peak; one represents dissolution of the GP zones and the other dissolution of the 77' particles. This is in agreement with the conclusions of Zahra and coworkers [12, 14] and Lendvai et al. [13]. Regarding the commercial aluminum alloy 7075, few studies have been done on the effect of aging temperature and time, primarily because most of the emphasis has been placed on the technologically important T651 and T7 tempers. According to a recent result of Papazian [21 ], the maximum temperature of peak I (Fig. l(a)) increases with increasing aging time, similar to what occurs in the pure ternary alloys. However, peak I is never observed to become a doublet at any aging temperature. Thus, endothermic peak I for naturally aged samples appears to shift steadily to higher temperatures if the aging temperature is increased. Superficially, this seems to support the conclusions reached by many of the investigators using calorimetry that the first endothermic peak is due to the dissolution of GP zones [16, 20-23], contradicting our contention that this endothermic peak must be due to the dissolution of q' particles. This ingredient of the controversy can be rationalized only if the microstructures of alloy 7075-T6 and naturally aged alloy 7075 evolve differently on heating during a DSC scan, even though the calorimetric behavior suggests that there is no microstructural difference. In this context, we cite a detailed kinetic analysis of
endothermic peak I by Papazian [21], who showed that the dissolution kinetics for alloy 7075 aged at 120 °C (the T6 temper) could not be described by the same parameters as the dissolution kinetics for naturally aged alloy 7075. Papazian concluded that the straightforward appearance of the thermograms of samples aged at temperatures exceeding 60 °C was deceiving, peak I being due to GP zone dissolution in naturally aged alloy 7075, but not in the samples aged at higher temperatures. The reason for the absence of the second peak in aluminum alloy 7075 is not well understood but might be associated with the presence of copper in the commercial alloy. A recent study [26] has shown that copper not only accelerates the early stage of aging of the pure A I - Z n - M g alloy but also increases the GP zone solvus temperature. Thompson [11] studied the effect of copper additions on the aging response of A1-Zn-Mg alloys using controlled additions of copper to pure ternary alloys, as well as comparing the behavior of commercial aluminum alloys 7075 and 7039. The calorimetric response of samples subjected to a large variety of heat treatments was investigated. A significant effect of copper on the aging kinetics at low temperatures (lower than 200 °C) and'short times (e.g. less than 1 day at room temperature) was found. It was generally observed that copper accelerates the aging response, and Thompson concluded that the presence of copper brought this about by accelerating the nucleation of GP zones; the effect of copper on GP zone growth was judged to be minimal. Following up this idea, it is reasonable to conclude that copper may have a similar influence on the transformation of GP zones to t/' precipitates, perhaps by reducing the critical particle diameter dc for this transformation. It is also conceivable that copper stimulates the nucleation of t/' even in the absence of GP zones. Thus the absence of the doublet in peak I in Fig. l(a) could be due to the role of copper in increasing the stability of GP zones and facilitating the nucleation of r/' at lower temperatures and shorter aging times, resulting in much closer overlap of the GP zone and t/' dissolution endotherms than observed in the pure ternary alloys, where the individual endotherms are resolved. It then remains to explain the steady shift of peak I to higher temperatures as both the aging time and the aging temperature increase. We
200
believe that this effect is closely related to the size distribution of the r/' particles. Capillarity always increases the solubility of small particles. This effect can become very important when the particles are in the nanometer size range and is quantitatively described by the well-known Gibbs-Thompson equation for a spherical particle of radius r:
where X, and X~ respectively are the solubilities of particles of radius r and of infinite radius, o is the interracial energy of the particle=matrix interface, Vm is the molar volume of the particle, and R and T have their usual meanings. The mean radius of the r/' particles in our T651 alloy is 2.5 nm [18]. Vm of the r / p h a s e is calculated to be 0.18 × 1 0 - 3 m 3 mo1-1, which is very large because the unit cell contains only one of the formula units (molecules) determined by Auld and Cousland [27]. On taking the above values and the estimate a = 50 mJ m -2, w e find that X,/X~ = 6.25 at 200 °C, which is on the high side of the r/' dissolution peak (Fig. l(a)). Considering the excellent correspondence between the r]' and matrix lattices, we believe that this value of a is quite reasonable. The solubility of r/' particles with radius 2.5 nm is hence higher than the equilibrium solubility by over a factor of 6 at 200 °C. This simple calculation, using relatively conservative values of the parameters, demonstrates the striking effect of particle size on their solubilities. This explains the increase in the temperature of the dissolution peak with increases in the aging temperature and time and agrees with the conclusion of others [4, 11, 21 ]. Exothermic peak II usually appears as a doublet for samples of alloy 7075-T6 (Fig. l(a)); it has been attributed generally to the formation of ~/, followed by r/' dissolution and ~/formation [16, 20-23]. However, our results [19] indicate that two distinct processes occur when the T651 structure is up-quenched to 240 °C within the two phase a + ~7 field (in addition to the usual dissolution and coarsening). One of them is transformation of the ~/' phase to one of the r/variants (~/2) and the other is precipitation of the r/1 variant. Thus, it is likely that this doublet is due to both the r/'--, 7/2 transformation and the precipitation of ~/1-The lower temperature peak of IIa is
the larger in magnitude of the two most likely because the q'--" r/2 transformation can occur more easily than the nucleation of r/1, particularly during a DSC experiment. Furthermore, the ~/'--' ~]z transformation is certainly an exothermic reaction (e.g. the transformation of 0' to 0 is known to be accompanied by the evolution of the heat in A1-Cu alloys [28]). Peak IIa (Fig. l(a)) usually overlaps the high temperature part of peak I [21], generally making it difficult to distinguish between the end of the first endotherm I and the beginning of the exothermic doublet II. This is probably because the q'--" r/2 transformation occurs concurrently with dissolution.
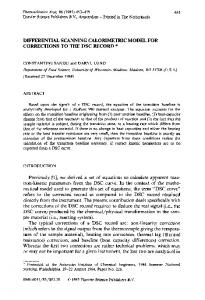
3. Effect of the retrogression and reaging treatment Papazian [23] published thermograms for alloy 7075-T651 retrogressed at temperatures ranging from 220 to 270 °C for various times. The evolution of the thermograms as a function of retrogression time is shown schematically in Fig. 2. Three principal features are noted: (1) a continuous decrease in the area of the first endothermic peak before its eventual complete disappearance; (2) the concurrent appearance of a new broad exothermic peak IV over approximately the same temperature range as peak I; (3) a concurrent decrease in the area of the exothermic peak II. Peak IV increases as I decreases and reaches its maximum value at about the same aging condition that peak I becomes negligible. Peak II I
T
/' T051
.-LJ
" ,,t/Ly I
1O0
150
13/
¸
I
I
I
200
250
300
T(°C)
Fig. 2. DSC thermograms illustrating the effect of the retrogression treatment as a function of the retrogression time at 260 °C, taken from the work of Papazian [23], Two retrogression times are represented: 1 5 s (R15) and 120s (R 120). These are superimposed on the thermogram for aluminum alloy 7075-T651.
201
decreases as I decreases (and as IV increases) and eventually evolves into endothermic peak V roughly when IV attains its maximum value (i.e. when peak I is negligible). With a further increase in the retrogression time, peak IV decreases slightly, concurrently with a small increase in peak V. It is evident that the gradual decrease in peak I with increasing retrogression time is due to the dissolution of particles during the retrogression treatment. The particles dissolving must be primarily q' rather than GP zones, because the original T6 structure does not contain significant amounts of GP zones [18, 25]. In a recent discussion, Danh et al. [24] reckoned that the dissolving particles are GP zones because the retrogression temperatures are usually below the t/' solvus temperature. However, the solubility of t/' particles is such a strong function of their size, as we have already shown, that dissolution of small ~' particles can also readily occur at temperatures well below the thermodynamic equilibrium ~/' solvus temperature. Papazian [23] suggested that the appearance of peak IV was due to the formation of precipitates (unspecified) during the DSC scan, the precipitation being made possible by the dissolution that occurred during retrogression. In his view the area under peak I first decreased, went through a minimum (becoming negligible) and then increased again (as peak V). Papazian made no distinction between peak I and peak V and suggested only that the large shift of peak I to higher temperatures was due to dissolution of the precipitates in the overaged microstructure in samples retrogressed for longer times. We feel that peaks I and V are the result of fundamentally different processes and deserve to be distinguished for the reasons discussed below. Firstly, it is highly unlikely that peak IV is caused by precipitation during the DSC scan because precipitates cannot nucleate on the one hand and dissolve on the other hand in exactly the same interval of temperature. This is simply a consequence of the fact that the driving forces for these two processes are very different. In fact the precipitation (exothermic) peak of a specific precipitate must be displaced to lower temperatures than the dissolution (endothermic) peak of the same precipitate. Since peaks I and IV evolve over the same temperature interval during the DSC scan, they cannot both be signatures for precipitation and dissolution of the same phase.
Secondly, retrogression produces a relatively small solute supersaturation and very low vacancy concentration, which differs from a normal solution treatment. The rate of nucleation of ~/' precipitates should thus be small during a DSC experiment because of the high free-energy barrier for nucleation, the low frequency factor and a long incubation time. An exothermic process possibly responsible for peak IV is the regrowth of small ~/' particles which have not completely dissolved during the retrogression treatment. We have shown [19] that such fine particles are actually present in significant quantities in the retrogressed microstructure. Since this process is kinetically favored over nucleation, the existing supersaturation of solute can dissipate preferentially through regrowth rather than through the nucleation of new particles. As the temperatures reach the range of peak IV during the DSC scan, the regrowing ~/' particles will start to transform to the more stable ~/2 precipitates, providing yet another exothermic contribution in this temperature interval. At higher temperatures still, the small quantity of very small ~/2 precipitates in what is now a bimodal distribution of q particles will dissolve. This endothermic process occurs at the relatively low temperatures of peak V, rather than at the high temperatures of peak III (Figs. 1 and 2), because of capillarity. Peaks I and V are distinctive, then, because one of them is caused by the dissolution of ~/' particles while the other is caused by the dissolution of very fine q particles (in this case the r/2 type). It is worth pointing out that the appearance of peak IV is an artifact produced by heating during the DSC experiments; that is, peak IV has nothing to do with reactions related to the microstructure of the aged alloy. In this sense the real effects occurring during the retrogression treatment are obfuscated rather than clarified by DSC. This can be better appreciated on studying the thermograms of the RRA samples, because the reaging treatment dissipates the supersaturation available for the regrowth during a DSC scan. Hence, peak IV and its effect on peak V should no longer exist. Figure 3 shows a schematic diagram of a DSC curve for the RRA structure, together with that of the T651 and T73 structures. Peak I shifts to higher temperatures in the RRA sample, which contains a significant quantity of q' precipitates [19] and becomes broader. The height of peak I
202
I
I
I
t
I
I
100
150
200
250
300
T(°C)
Fig. 3. Comparison of DSC thermograms for aluminum alloys 7075-T651 and 7075-T73 with that for the alloy retrogressed for 30 s and reaged (RRA30), taken from the work of Papazian [23].
consequently becomes smaller and the area under peak II decreases. Peak IV is absent, as expected, because of its artifact nature. The reappearance of part of peak I is an indication that the formation of r/' particles has occurred during the reaging treatment [19]. This is caused by the precipitation of new r/' particles and the regrowth of the r/' particles that survived during retrogression. The width of peak I and its shift to higher temperatures are indications that the sizes of the r/' particles are significantly larger than in the original T651 condition, as observed experimentally [19]. Peak II is absent in the RRA sample, even though the r/'-to-r/ transformation should contribute exothermically during the DSC scan. We believe that peak II is missing because the expected exothermic contribution is overwhelmed by the endothermic contribution of the r/' precipitates that dissolve on heating the sample during the DSC experiment. Finally, our microstructural results [18] can also be used to interpret the thermogram of the T73 structure. This thermogram is schematically shown in Fig. 3; peak II is absent in this case. The maximum temperature of the endothermic peak for this condition (labelled V in Fig. 3) appears at a temperature which nearly corresponds to the maximum temperature of peak I of the RRA microstructure [16]. The area under the peak is smaller than that for the RRA case. The T73 microstructure is characterized by a bimodal size distribution of q particles [18]. It contains a significant quantity of fine ~]1 particles, in addition to coarser rh, r/: and ~14 particles which are produced during the two-step T73 aging treatment. We therefore believe that peak I
actually becomes peak V because it is due to the dissolution of the /71 particles in the distribution during the DSC scan. The labelling of this peak as peak V is consistent with our interpretation that it is caused by the dissolution of very small particles of the r/phase; in retrogressed samples they are most probably '12 precipitates whereas in the T 73 microstructure they are r/1 precipitates. It is expected that the ~/' particles, which are present in minor quantities in the T73 microstructure [18], also dissolve at this time or transform to r/during heating, but their contribution to the thermogram is small. Peak II is absent in the T73 sample because the heat liberated by the ~/'--,r/ transformation is not large enough to exceed that absorbed by the dissolving r/i precipitates in the bimodal distribution. Peak V in the T73 temper is shifted to lower temperatures than in the R120 samples (cf Fig. 2) because the dissolving r/ precipitates are smaller in the T73 microstructure [18, 19], but the reaction is fundamentally the same. These discussions generally confirm the results of our microstructural studies [18, 19, 25] and provide a rationale for the results of the various DSC studies. Although we have been concerned primarily with aluminum alloy 7075, we believe that this reasoning can be extended to the pure ternary alloys with similar compositions. 4. Conclusions The results of our microstructural studies of alloy 7075 in various tempers, including RRA heat treatments, provide a sound basis for the interpretation of the results of the calorimetric investigations of this alloy, as well as pure ternary A1-Zn-Mg alloys.
Acknowledgments The authors are grateful to the Office of Naval Research for their support of this research under Contract N00014-81-K-0292. J. K. Park is also grateful to the Ministry of Science and Technology and the Korea Science and Engineering Foundation, Korea, for their partial financial :support of this research.
References 1 I.J. Polmear, J. Inst. Met., 86 ( 1958-1959) 113. 2 I.J. Polmear, J. Inst. Met., 87 (1958-1959) 24. 3 K. Hirano and Y. Takagi, J. Phys. Soc. Jpn., 10 (1955) 187.
203 4 K. Asano and K. Hirano, Trans. Jpn. Inst. Met., 9 (1968) 24. 5 L. F. Mondolfo, N. A. Gjostein and P. W. Levinson, Trans. A1ME, 206 (1956) 1378. 6 R. Graf, ~\ R. Acad. Sci., 242 (1956) 2834. 7 R. Graf, C. R. Acad. Sci., 244 (1957) 337. 8 R. Graf, J. Inst. Met., 86 ( 1957-1958) 535. 9 H. Schmalzried and V. Gerold, Z. Metallkd., 49 (1958) 291. 10 V. Gerold and H. Haberkorn, Z. Metallkd., 50 (1959) 568. 11 D. S. Thompson, in R. F. Schwenker, Jr., and E D. Garn (eds.), Thermal Analysis, Vol. 2, Academic Press, New York, 1969, p. 1147. 12 A. Zahra, C. Y. Zahra, M. Laffitte, W. Lacom and H. P. Degischer, Z. Metallkd., 70 (1979) 172. 13 J. Lendvai, G. Honyek and I. Kovacs, Scr. Metall., 13 (1979) 593. 14 W. Lacom, H. E Degischer, A. M. Zahra and C. Y. Zahra. Scr. Metall., 14 (1979) 253. 15 P.N. Adler, R. De Iasi and G. Geschwind, Metall. Trans., 3(1972)3191.
16 R. De lasi and P. N. Adler, Metall. Trans. A, 8 (1977) 1177. 17 N. C. Danh, K. Rajan and W. Wallace, Metall. Trans. A, 14 (1983) 1843. 18 J. K. Park and A. J. Ardell, Metall. Trans. A, 14 (1983) 1957. 19 J. K. Park and A. J. Ardell, Metall. Trans. A, 15 (1984) 1531. 20 D. J. Lloyd and M. C. Chaturvedi, J. Mater. Sci., 17 (1982) 1819. 21 J.M. Papazian, Metall. Trans. A, 13(1982) 761. 22 A. Baldantoni, Mater. Sci. Eng., 72 (1985) L5. 23 J.M. Papazian, Mater. Sci. Eng., 79(1986) 97. 24 N. Danh, K. Rajan and W. Wallace, Metall. Trans. A, 16 (1985) 2068. 25 J.K. Park and A. J. Ardell, Scr. Metall., 22 (1988) 1115. 26 B. H. Kim, M.Sc. Thesis', Korea Advanced Institute of Science and Technology, 1987. 27 J. H. Auld and S. McK. Cousland, J. Aust. Inst. Met., 19 (1974) 194. 28 1. J. Polmear and H. K. Hardy, J. Inst. Met., 83 (1954-1955)393.