APPLIED PHYSICS LETTERS 92, 132103 共2008兲
Correlation between microstructure, electronic properties and flicker noise in organic thin film transistors Oana D. Jurchescu,1,2,a兲 Behrang H. Hamadani,1 Hao D. Xiong,1 Sungkyu K. Park,2 Sankar Subramanian,3 Neil M. Zimmerman,4 John E. Anthony,3 Thomas N. Jackson,2 and David J. Gundlach1,a兲 1
Semiconductor Electronics Division, National Institute of Standards and Technology, Gaithersburg, Maryland 20899, USA 2 Center for Thin Film Devices and Materials Research Institute, Department of Electrical Engineering, Penn State University, University Park, Pennsylvania 16802, USA 3 Department of Chemistry, University of Kentucky, Lexington, Kentucky 40506, USA 4 Atomic Physics Division, National Institute of Standards and Technology, Gaithersburg, Maryland 20899, USA
共Received 12 October 2007; accepted 7 March 2008; published online 31 March 2008兲 We report on observations of a correlation between the microstructure of organic thin films and their electronic properties when incorporated in field-effect transistors. We present a simple method to induce enhanced grain growth in solution-processed thin film transistors by chemical modification of the source-drain contacts. This leads to improved device performance and gives a unique thin film microstructure for fundamental studies concerning the effect of structural order on the charge transport. We demonstrate that the 1 / f flicker noise is sensitive to organic semiconductor thin film microstructure changes in the transistor channel. © 2008 American Institute of Physics. 关DOI: 10.1063/1.2903508兴 Recent development in the field of organic electronics has led to improvements in understanding charge injection and transport in organic semiconductor materials.1,2 However, a reliable correlation between microscopic properties and their effect on the macroscopic electrical properties of the devices is still missing. An important effort is involved in improving the performance of soluble small molecules for which easy processing techniques are required.3 A major challenge in using organic thin film transistors 共OTFTs兲 as test structures for fundamental studies is the strong dependence of their electrical characteristics on the fabrication process. While the value of mobility is widely used as a measure of the performance of an organic semiconductor, with a few exceptions,4–6 the use of noise measurements in the determination of reliability of different devices is hardly encountered in the field of organic electronics. In this letter, we use current-voltage 共I-V兲 and 1 / f noise measurements to investigate the influence of the organic thin film microstructure on the performance of OTFTs. Fluorinated 5,11bis共triethylsilylethynyl兲 anthradithiophene 共diF-TESADT兲7 关see the chemical formula in the inset of Fig. 1共a兲兴 TFTs are particularly well suited for this type of study because thin films formed by spin casting have unique properties which give rise to large 共⬇10 m兲 grains that grow from contacts and into the channel region of the device.3 We show that device fabrication conditions determine the microstructure of the film and strongly influence the extrinsic transistor characteristics. We present observations of a correlation between thin film microstructure in the transistor channel and macroscopic properties such as mobility and low frequency noise. The devices that we investigate in this study are bottomcontact field-effect transistors 共FETs兲 关see the cross section in the inset of Fig. 1共a兲兴. We use heavily doped 具100典 silicon a兲
Author to whom correspondence should be addressed. Electronic addresses:
[email protected] and
[email protected].
wafers with 200 nm thermally grown SiO2 as the gate electrode and gate oxide, respectively. We present measurements performed on three distinct sample types. For types 1 and 2 devices, the source and drain contacts consist of 5 nm Ti/ 40 nm Au. Sample type 3 has 100 nm Au contacts. No contact treatment was applied to type 1 devices. For types 2 and 3 devices, the contacts were treated by immersing the substrates for 30 min in pentafluorobenzenethiol 共10−2 mol/ l
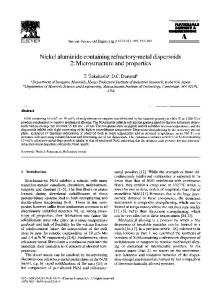
FIG. 1. Current-voltage characteristics for a diF-TESADT FET 共type 3 sample兲. The inset shows the chemical formula of the organic semiconductor used in this study. 共b兲 Normalized spectral density 共SI / I2兲 vs frequency f for the same device.
0003-6951/2008/92共13兲/132103/3/$23.00 92, 132103-1 © 2008 American Institute of Physics Downloaded 31 Mar 2008 to 129.6.136.192. Redistribution subject to AIP license or copyright; see http://apl.aip.org/apl/copyright.jsp
132103-2
Appl. Phys. Lett. 92, 132103 共2008兲
Jurchescu et al.
TABLE I. Summary of sample preparation procedures for the three types of devices investigated in this study. The mobility and the Hooge parameter ␣ for the device with L = 10 m for each type of sample are indicated along with the value of L at which the transition occurs. Sample type
共L = 10 m兲
␣ 共L = 10 m兲
L transition 共m兲
1 2 3
2.2⫻ 10−3 0.13 0.24
50 3 1.5
¯ 25 50
solution in room temperature ethanol兲 followed by sonication in ethanol.8 An extra step of hexamethyldisilazane 共HMDS兲 treatment for the oxide insulator was used for type 3. Table I summarizes the sample preparation details and the device properties. Films were spin cast at room temperature from a ⬇ 22 mg/ ml 共2 wt % 兲 solution in chlorobenzene. We performed electrical and low frequency noise measurements in a nitrogen purged probe station, at room temperature and in the dark. The low frequency noise measurements were carried out using a standard noise setup. We recorded the voltage noise power spectral density in the frequency range 1 Hz ⬍ f ⬍ 1.6 kHz at constant drain 共VDS兲 and gate 共VGS兲 voltages. Because the threshold voltage 共VT兲 typically varies from device to device, we performed the measurements for devices biased at nominally identical gate bias, VGT = VGS − VT. The drain voltage was kept constant at VDS = −4 V for all the noise measurements. Typical transistor characteristics for a diF-TESADT FET are plotted in Fig. 1共a兲. This graph shows the log共ID兲 vs VGS 共right axis兲 and 冑ID vs VGS 共left axis兲 plots in the saturation regime 共VDS = −40 V兲 for a device of sample type 3 with W / L = 270 m / 10 m and tox = 200 nm. We extracted the values of the field-effect mobilities from the slope 共冑ID / VGS兲 of the 冑ID vs VGS plots 关Fig. 1共a兲, left axis兴, in the saturation regime, by using the following expression: ID =
1W Ci共VGS − VT兲2 , 2L
共1兲
where Ci is the gate oxide capacitance per unit area. For the same devices, we measured the drain current noise power spectral density SI共f兲 and converted it to the normalized noise spectra S 共S = SI / I2兲. Figure 1共b兲 shows the normalized noise spectra at constant drain and gate voltage 共VDS = −4 V, VGT = −20 V兲, as a function of frequency, in a log-log scale, for the same 10 m device. All devices studied exhibited 1 / f noise behavior, similar with previous observations in small organic molecules TFTs.4,5 The frequency coefficient in 1 / f ␦ is 0.85⬍ ␦ ⬍ 1.1 for the devices explored in this study, confirming a 1 / f type of flicker noise, in agreement with the Hooge empirical expression of drain current noise spectral density 共SI / I2兲,9 SI ␣ , = I2 Nf
FIG. 2. 共Color online兲 共a兲 Saturation mobility vs channel length L for diF-TESADT TFTs. 共b兲 Normalized spectral density 共SI / I2兲 at f = 100 Hz for the same devices. The open circles correspond to the transition points. The inset represents a schematic view of the evolution of the normalized noise with channel length for types 2 and 3 samples, where the steplike “jump” corresponds to the transition from a highly ordered region 共HOR兲 to a poorly ordered region 共POR兲.
= 0.4⫾ 0.1 cm2 / 共V s兲, devices with only treated contacts exhibit = 0.16⫾ 0.02 cm2 / 共V s兲, and devices with no treatment exhibit = 2 ⫻ 10−3 ⫾ 1 ⫻ 10−3 cm2 / 共V s兲. We observe that the mobility decreases with increasing channel length for all samples. There is a dramatic change in the dependence of the mobility versus channel length for types 2 and 3 devices, which, as we will discuss in the details below, is associated with the changes in the thin film microstructure. In order to compare the device mobility with the output from the noise measurements, we plot the value of the noise at constant frequency, f = 100 Hz, versus channel length L in Fig. 2共b兲. The decrease in noise with L can be understood as a result of averaging the fluctuations over a larger volume.10 The evolution of the value of noise with channel length is consistent with the evolution of the mobility with L due to the identical microstructure effects. The different behavior of the mobility and the noise in types 2 and 3 devices at short versus long channel lengths correlates with the transition between two different types of microstructure within the transistor channel. Optical inspection of the channel region shows different film morphologies induced by contact treatment. Figure 3 presents optical micrographs of the three sample types investigated in this study. Sample types 2 and 3 adopt a distinct growth motif along contact edges. For sample type 2 关Figs. 3共a兲 and 3共b兲兴, the devices with channels shorter than 25 m are completely
共2兲
where ␣ is the Hooge parameter, N is the total number of free charge carriers, and f is the frequency. The TFT mobility for the three types of devices investigated in this study, as a function of channel length, is plotted in Fig. 2共a兲. At short channel lengths 共L = 5 m兲, devices with treated contacts and oxide exhibit a mobility
FIG. 3. 共Color online兲 Optical micrographs of the three types of devices investigated in this study. For devices from type 2 sample, two different channel film microstructures can be detected for large L. Downloaded 31 Mar 2008 to 129.6.136.192. Redistribution subject to AIP license or copyright; see http://apl.aip.org/apl/copyright.jsp
132103-3
Appl. Phys. Lett. 92, 132103 共2008兲
Jurchescu et al.
covered with large, highly crystalline grains 关similar to the picture shown in Fig. 3共a兲兴. We will refer to this type of regions of the thin film as highly ordered regions. Larger L devices have a different film texture in the middle of the channel 关Fig. 3共b兲兴, which we will refer to as poorly ordered region. Here, the film is not amorphous but consists of areas having different crystal orientations.5 The electrical properties of the TFTs are given by the contributions of the highly ordered and less ordered regions. As the channel length increases, the less ordered 共lower 兲 regions start to dominate the transport, and as a result, the value of the device mobility decreases 关see Fig. 2共a兲兴. The transition between the two types of channel textures is detected as a change in slope of the 共L兲 plots. The transition point mirrors the structural changes in the film, as the kink in the mobility graph coincides with the value of L where optical microscopy images indicate that the less ordered regions start to form in the middle of the channel 共L = 25 m for sample type 2兲. Optical micrographs of type 3 devices 关Fig. 3共d兲兴 show the transition between highly ordered regions and less ordered regions being shifted to L = 50 m. These devices exhibit larger grains, which lead to a larger value of mobility 关Fig. 2共a兲兴. The change in slope in the 共L兲 plot at L = 50 m correlates well with the presence of larger grains. The untreated devices 共sample type 1兲 manifest no significant growth of large grains along the contact edge 关Fig. 3共c兲兴. This absence of significant grain growth along the untreated contact edges is observed even when lower spin speeds are used to cast the films. The mobility monotonically varies with channel length L because the channel consists only of poorly ordered regions. We demonstrate that the noise measurements are very sensitive to the changes in the transistor channel, as the noise versus channel length plots of the devices with treated contacts 关see Fig. 2共b兲兴 show a dramatic increase in the value of normalized noise spectral density 共approximately one order of magnitude兲 at the the value of L for which both optical micrographs and mobility measurements indicate that the transition between the highly ordered regions and the poorly ordered regions occurs. Because of this correlation, we speculate that trapping and detrapping of the charges at the grain boundaries are the major source of noise in our devices. However, it is not necessary that noise and mobility are influenced by the same factors, rather the noise sources represent a subset of the factors that influence the mobility. There is no sufficient experimental information to unambiguously determine the exact mechanism of noise generation in these devices. If we assume that the major source of noise comes from the fluctuations in the drain current at the grain boundaries, the abrupt “steplike” transition in the noise versus channel length plots of the devices with treated contacts 关see schematical view in the inset of Fig. 2共b兲兴 can be understood as a signature of the transition from a channel with a lower number of grain boundaries 共the large grains region兲 to a channel that has large grains on the edges, poorly ordered regions in the middle, and correspondingly larger number of grain boundaries 共similar to the devices with untreated contacts兲. For this reason, the three graphs that correspond to the less ordered regions in the three types of samples collapse to the same curve. The devices that correspond to the channel lengths, where the transition between the two types of microstructure occurs, present a value of the noise spectral densities larger than that of the highly ordered devices, but lower
than that of the devices that have small grains in the middle 关see the open circles in Fig. 2共b兲兴. The differences between the values of normalized spectral densities S for short channel devices in Fig. 2共b兲 are then the result of different mobilities and carrier trap concentrations. We do not exclude the contribution of the noise that arises from the contacts, as the I-V of the high mobility devices 共low L兲 are strongly dominated by the contacts. Good benchmarks for the technological success of devices are the electronic mobility 共which needs to be maximized兲 and the Hooge parameter 共which needs to be minimized兲. By using expression 2, we can extract the Hooge parameter ␣ for the three types of samples investigated in this study. We show that devices with highly ordered channels not only present higher mobilities but also lower values of ␣, and the transition to a channel with a lower mobility corresponds to an abrupt transition to larger values of the Hooge parameter. The value of ␣ calculated by using the aforementioned approximations represents an overestimation, as it assumes that all the charges accumulated near the gate oxide interface are free and contribute to the transport. The values of ␣ for the short channel devices are ␣ = 2.9⫾ 0.5 for type 2 devices and ␣ = 1.8⫾ 0.3 for type 3 devices, similar to values obtained for TFTs on crystalline organic FETs.9 For large L devices, the presence of the less ordered regions in the center of the channel is detected as larger values of ␣ 共␣ = 29.6⫾ 4.6 for type 2 devices and ␣ = 11.8⫾ 3.1 for type 3 devices兲. The values of the Hooge parameter corresponding to the devices with untreated contacts are even higher 共␣ = 48.4⫾ 8, type 1 devices兲. As with field-effect mobility, the magnitude of ␣ is determined by the presence of the highly ordered and less ordered regions in the transistor channel. In conclusion, we demonstrate that we can control the size of the ordered domains into the organic thin film transistor channel during the fabrication process via chemical modification of the contacts using room temperature processing. We show that the degree of order in the channel is strongly reflected in the electrical properties. We present evidence that macroscopic properties such as mobility and low frequency noise are dependent on the thin film microstructure. We would like to thank Curt Richter and Lee Richter for their assistance during the preparation of this manuscript. 1
M. E. Gershenson, V. Podzorov, and A. F. Morpurgo, Rev. Mod. Phys. 78, 973 共2006兲. 2 A. Troisi and G. Orlandi, Phys. Rev. Lett. 96, 086601 共2006兲. 3 D. J. Gundlach, J. E. Royer, S. K. Park, S. Subramanian, O. D. Jurchescu, B. H. Hamadani, A. J. Moad, R. J. Kline, L. C. Teague, O. Kirillov, C. A. Richter, J. G. Kushmerick, L. J. Richter, S. R. Parkin, T. N. Jackson, and J. E. Anthony, Nat. Mater. 7, 216 共2008兲. 4 P. V. Necliudov, S. L. Rumyantsev, M. S. Shur, D. J. Gundlach, and T. N. Jackson, J. Appl. Phys. 88, 5395 共2000兲. 5 S. Martin, A. Dodabalapur, Z. Bao, B. Crone, H. E. Katz, W. Li, A. Passner, and J. A. Rogers, J. Appl. Phys. 87, 3381 共2000兲. 6 L. K. J. Vandamme, R. Feyaerts, Gy. Trefán, and C. Detcheverry, J. Appl. Phys. 91, 719 共2002兲. 7 S. Subramanian, S. K. Park, S. R. Parkin, V. Podzorov, T. N. Jackson, and J. E. Anthony, J. Am. Chem. Soc. 130, 2706 共2008兲. 8 C. C. Kuo, M. M. Payne, J. E. Anthony, and T. N. Jackson, Tech. Dig. Int. Electron Devices Meet. 2004 373. 9 F. N. Hooge, IEEE Trans. Electron Devices 41, 1926 共1994兲. 10 M. E. Levinshtein, Phys. Scr., T T69, 79 共1997兲. Downloaded 31 Mar 2008 to 129.6.136.192. Redistribution subject to AIP license or copyright; see http://apl.aip.org/apl/copyright.jsp