Website capacity determination is crucial to measurement-based .... ing (CoSL) approach in multi-tier websites to measure .... answer. If we can determine the best possible service ..... hosting the TPC-W online bookstore servlets and the.
CoSL: A Coordinated Statistical Learning Approach to Measuring the Capacity of Multi-tier Websites Jia Rao and Cheng-Zhong Xu Department of Electrical & Computer Engineering Wayne State University, Detroit, Michigan 48202 {jrao, czxu}@wayne.edu
Abstract
Understanding of server capacity is crucial for server capacity planning, configuration and QoS-aware resource management. It is known that an e-commerce server can be run in one of the three states: underloaded, saturated, and overloaded. When the server is underloaded, its throughput grows with the increase of input traffic until a saturation point is reached. The saturated throughput may not remain unchanged when the input rate continues to increase. It may drop sharply due to resource contention and algorithmic overhead for load management [1]. Knowledge about the server capacity could help measurement-based admission control in the front-end to regulate the input traffic so as to prevent the server from running in an overloaded state [15]. In the presence of classified requests, server capacity information can also be used by a back-end scheduler to calculate the portion of the capacity to be allocated to each class of requests for service differentiation and QoS provisioning [9, 18].
Website capacity determination is crucial to measurement-based access control, because it determines when to turn away excessive client requests to guarantee consistent service quality under overloaded conditions. Conventional capacity measurement approaches based on high-level performance metrics like response time and throughput may result in either resource over-provisioning or lack of responsiveness. It is because a website may have different capacities in terms of the maximum concurrent level when the characteristic of workload changes. Moreover, bottleneck in a multi-tier website may shift among tiers as client access pattern changes. In this paper, we present an online robust measurement approach based on statistical machine learning techniques. It uses a Bayesian network to correlate low level instrumentation data like system and user cpu time, available memory size, and I/O status that are collected at run-time to high level system states in each tier. A decision tree is induced over a group of coordinated Bayesian models in different tiers to identify the bottleneck dynamically when the system is overloaded. Experimental results demonstrate its accuracy and robustness in different traffic loads.
1
An industry standard approach to server capacity measurement is stress-testing using benchmarks [5]. It observes the change of server performance with the increase of the load and approximates server capacity the saturated throughput or the system throughput when the response time is observed to rise abruptly. In [1], the authors proposed a S-client approach to generate excessive workload efficiently for measuring the capacity of web servers. In [5], the authors focused on the construction of benchmarks for measuring the basic capacities of streaming servers. In [9], the authors suggested to measure the capacity of a database server in terms of execution units. They used the method of incremental steps [12] to find out the capacity that provides the maximum throughput.
Introduction
Service quality is a multidimensional concept [21]. An important measure in a multi-tier server is response time — the time from the server receives a client request to the time when the response is delivered. It is the processing time incurred by the request, plus its waiting time in the front-end when the server is heavily loaded. Server capacity is often measured by the number of requests (or transactions) per second that a server can handle without dramatically compromising service quality due to server overload.
Response time is an intuitive measure of system performance. It is a good online indicator to the change of server load for requests of similar sizes. However, requests of e-commerce services often have very different processing times and the times also tend to change 1
with server load condition. As a result, request-specific response time becomes an ill-defined performance measure in stress-testing of server capacity. There were studies on the use of mean response time to characterize the server load change in statistics. Welsh and Culler showed that 90th-95th percentile response time should represent the shape of response time curve more accurately, in comparison with average or maximum time [19]. However, choosing an optimal value for the target response time is not trivial. In [16], Mogul presented a case that a misconfiguration of the response time threshold could possibly cause the system to enter a live-lock state. In practice, the threshold is often set conservatively. For example, Blanquer et al. [14] set a threshold to be half of the most restrictive request response time guarantee for the admission controller to regular the incoming traffic rate. Such a conservative estimation of the server capacity by setting a low threshold value equals to the method of resource over-provisioning. In [9], Elinikety et al. suggested measurement-based admission control based on offline estimate of server capacity and online estimated execution time of admitted servlet request(s). They assumed a non-preemptive shortest job first scheduling policy, which makes it possible to estimate system utilization by admitted servlets. In a multi-tier e-commerce website, request processing involves multiple system components in different tiers. Saturation of the system in the processing of one type of requests may not necessarily mean it cannot handle other requests. Bottleneck may also shift dynamically. Response-time based server capacity measurement provides little insight into constrained resources. These motivated us to develop a robust approach to measuring website capacity, based on low level system running statistics like CPU utilization, memory usage, I/O traffic, etc. There are a large set of such system state parameters that can be monitored in realtime. Together, they reflect aggregated effects of the requests in concurrent execution. Questions are how to define a small group of relevant parameters to characterize the system load condition accurately, how to map them onto a high level system overload/underload status, and more importantly how to identify bottleneck resource when the system becomes overloaded. In this paper, we present a coordinated statistical learning (CoSL) approach in multi-tier websites to measure system capacity in real-time. It includes a statistical learning model to characterize the running state of each tier and a coordinated decision-making layer for bottleneck identification. The approach is robust in the sense that it is insensitive to the dynamics of input traffic and free of tuning parameters. We evalu-
ated the approach in a two-tier Tomcast/MySQL website using TPC-W benchmark. Experimental results demonstrated its estimation accuracy, responsiveness and capability of bottleneck identification. The rest of the paper is organized as follows. Section 2 briefly describes the dynamics of a multi-tier website. Section 3 presents limitations of conventional responsetime based approaches for measuring capacity. Section 4 gives the coordinated statistical learning approach. Section 5 and Section 6 give the evaluation method and experimental results. Related work is presented in Section 7. Section 8 concludes this paper.
2
Dynamics of a Multi-tier Website
In this section, we give a brief overview of the working of a typical multi-tier e-commerce website with Java servlet and relational database implementation. The description provides background for further discussion in the following sections. For simplicity, we focus our discussion on an implementation with Tomcat servlet engine as the application server and with MySQL as the backend database system. The workings of many other implementations of the servlet engine such as Websphere and Weblogic, and relational database like PostgreSQL are similar in principle. Our discussion will focus on the aspects of how the requests are processed by different system components or tiers, and thus simplifying the aspects of connection establishment process between the client and the website. A conventional multi-tier e-commerce website accepts HTTP requests from clients who issue those requests by using a web browser to access the website. Once a client requests an URL by clicking on a link in the webpage, a TCP connection is established and the request is sent through the connection to the server, then the client waits to read the response from the server. Figure 1 shows the work-flow of how the website processes a single request. In our case, we use Tomcat as both the web server and the application server. There are mainly four phases in the processing of one request: (1) HTTP connection establishment; (2) Application server processing; (3) Database connection establishment; (4) Database request processing. The process of a request is synchronous throughout the whole 4 phases, i.e. one phase is not finished without the completion of subsequent phases. The employment of multi-thread processing model in both application and database servers enables a website to process multiple requests simultaneously. In the application server, when multiple requests arrive, each request will be assigned a processing thread; and all these threads will be executing their
servlet JDBC
Figure 1. Workflow of a multi-tier website processing one http request. corresponding servlets simultaneously. In Tomcat, there are three configuration parameters related to the number of threads available: minSpareThreads, maxThreads, maxSpareThreads. When started the server, minSpareThreads number of threads will be created to form a thread pool. As more requests coming, Tomcat will create new threads until the upper bound of maxThreads number of thread is reached. The operation of creating new threads are memory intensive and may have performance impacts on the requests that are being processed. If there are more requests coming, they will be put into a queue, and after a timeout they will be dropped. If there are fewer requests coming, the unused threads in the pool will be killed until maxSpareThreads. Each application server maintains a pool of connections to the database. Upon receiving a database request, it will select one already existing connection from the pool. If all connections are consumed, new requests will be queued in the application server until timeout happens. In the database server, SQLs from different servlets are not necessarily executed in the same order as they arrive at the database. The final execution of queries on the database is a batch of interleaved SQLs from different servlets. However, the SQL queries from the same servlet will be guaranteed to be processed in order, because communication between application and database server is synchronous.
3
Multi-tier Website Capacity: Definition and Measurement
In general, a transaction processing system has a saturation point (upper bound) of the throughput the system could produce, as its load increases. After the “upper bound” is reached, the system throughput will either drop because of thrashing or maintain at a saturation level, but with decreased service quality [12].
In order to fully utilize the system, the admission controller will have to apply the control before the system reaches this saturation bound. In practice, admission control is often applied well before the system capacity is reached so that the system would provide more than enough resources to admitted requests for them to meet their service quality requirements [14]. However, in this over-provisioning approach, system resources tends to be under-utilized for most of the time, and more importantly “how much more resource is enough” is often determined empirically, and is never an easy question with a quantitative answer. If we can determine the best possible service quality a system configuration could produce when it reaches its capacity, we can then make more efficient use of the underlying resources without violation of service quality requirements. Therefore, measuring the system capacity accurately is crucial for system administrator to set efficient and effective online admission control policies. Conventional approaches normally involves two stages: (1) through offline stress testing, identify the maximum load a system can afford,in terms of how many clients’ traffic the server can sustain, when it is producing the “upper bound” throughput; (2) as the system reaches its capacity, one or a set of online system performance metrics are selected, often request response time, as the indicator of current system capacity. In the following, we will first present an observation about throughput dynamics against different traffic patterns due to the stress testing. We will then discuss the pitfalls of using response time as system capacity indicator for the second stage.
3.1
Throughput Metric
In a traditional transaction processing system that serves uniform load traffic, when the system reaches its throughput saturation point, the number of clients being served can be used to indicate the current system
TPC−W throughput curve 110
Table 1. Request composition in TPC-W. Shopping 80% 20%
Ordering 50% 50%
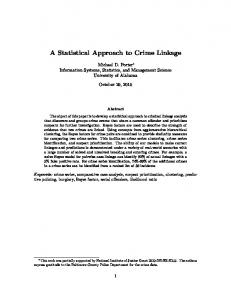
load. However, this is not the case in a multi-tier website because of its non-uniform traffic load. It is known that different types of requests require recourses on different tiers. That is, same amount of user traffic can impose different load onto the system. Therefore, the number of clients the server can serve depends on the characteristics of traffic. In order to evaluate the effects of traffic patterns on the system throughput, we conducted experiments in a typical Tomcat/MySQL website setting, using TPC-W benchmark (www.tpc.org/tpcw), an online bookstore synthetic load as input. (Please see Section 5 for details of the testbed setting.) In TPC-W, there are three types of traffic mixes: Browsing, Shopping and Ordering, with different request profiles. Table 1 summarizes the profile of each mix. Figure 2 shows the throughput curve of these three mixes as the number of concurrent clients increases. From the figure, we can see that for the ordering mix the throughput increases almost linearly until system reached its capacity at the peak throughput of 100 web interactions per second. At this point, there are approximately 800 clients being served concurrently. As for browsing and shopping mixes, the peak throughput are much lower. The maximum number of concurrent clients are 80 and 180 when the system reaches the throughput saturation value of around 10 and 20 web interactions per second respectively. After analyzing the implementation details of each servlet, we found that browsing related requests tend to put more pressure on the backend database server. The browsing mix contains more of this type of requests, while the ordering mix contains the least. This explains why different traffic mix led to very different throughput saturation points on the system. Due to the presence of different system throughput saturation points, there is no way to define a clear cut line about the server capacity in terms of the number of clients the server can support.
3.2
Response Time Metric
Measurement-based admission control requires to determine an online system performance metric to represent the current system load, for a given system capacity. Request response time is an intuitive system load indicator. However, this approach has pitfalls in multi-tier e-commerce websites: (1) It’s not robust enough to accommodate to the change of traffic; (2)
100 90 Web interactions per sencond
Browsing request Ordering request
Browsing 95% 5%
Browsing mix Shopping mix Ordering mix
80 70 60 50 40 30 20 10 0
0
200
400
600 800 Number of Clients
1000
1200
Figure 2. Throughput curve of a website in different traffic mix.
It can’t reflect bottleneck shifting among underlying tiers; (3) It can’t serve as an accurate enough reference to the system capacity. In the TPC-W benchmark, there are 14 types of requests from simple ”Home” and ”Order Inquiry” to more complicated ”Best Sellers” and ”Admin Confirm”. Figure 3 shows their execution times under different load conditions. Each data in the figure is the 90th percentile of time, because it represents the shape of response time more accurately than average and maximum time, as shown in [19]. From this figure, we can see that under the same system load, requests processing time varies to a very large degree. For instance, with a load of 100 clients, the “Order Inquiry” request took less than 10ms, while the request “Best Seller” cost more than 1000 ms. The request execution time varies so much that traffic flows of different request types will affect the maximum throughput the system can produce. Figure 4 shows the change of response times in Browsing and Ordering mixes, as the system load increases. If response time is used by the admission controller to identify overload, it is not easy to set an accurate system capacity threshold. Recall from Figure 2, we know the system capacity is 800 concurrent clients in an ordering mix and 90 clients in a browsing mix. According to Figure 4, the correspondingly 90th percentile of average response time is 1.125s and 8.559s, respectively. It would be impossible for system administrators to use either of the response times as the control threshold. Choosing the smaller one may reject browsing requests prematurely; and choosing the larger one may accept excessive ordering requests. In addition, the request execution time includes the sum of time a request spent on all system tiers. It gives no further information as to on which tier it spent
Execution Time (ms)
10000
1000
100 200 300 400 500 600
100
10
clients clients clients clients clients clients
1
Admin Confirm
Admin Request
Best Sellers
Buy Confirm
Buy Request
Customer Regist
Home
New Products
Order Display
Order Inquiry
Product Detail
Search Request
Search Results
Shopping Cart
Figure 3. Type specific execution time with different number of clients. Final prediction
most of its time. Since different types of requests put pressure on different tiers of the system, it is possible that, under heavy load, the system’s resource bottleneck shifts from one tier to another in the face of a changed traffic mix. Using request response time as system load indicator masks the underlying system load dynamics, and hinders the efficiency of admission control.
4
Prediction
Coordinated Learning Architecture
CoSL is hierarchical in structure. At the bottom is a traffic model for each tier that correlates a group of server low level performance metrics a to high level system state. At the top is a decision strategy engine that coordinates results from the models using either predefined rules or patterns learned from previous data to generate a final classification result. Figure 5 shows the CoSL architecture. Dedicated models provide useful information about the bottleneck resources on each tier. Although the models may not directly point to the bottleneck resource, they can help administrator narrow the search spaces. We will discuss this in detail in Section 5. More importantly, the multiple learning model structures are robust in the presence of workload changes. Recall that the models are induced from different traffic loads. Given an incoming traffic, not all the models will generate accurate results. The decision
Prediction Prediction
dependencies
Traffic specific model
Coordinated Statistical Learning approach
In this section, we propose a coordinated statistical learning (CoSL) approach to capture the correlation between system low level metrics and high level system load status. It assumes a Bayesian learning model at each tier to define a small group of relevant system parameters and correlate them to the load condition of each server. The models at different tiers are coordinated to identify bottleneck dynamically.
4.1
Coordinated Decision Strategy
Traffic specific model
Prediction dependencies
dependencies
Traffic specific model
Traffic specific model
Application server
Database server
Application server runtime statistics
Database server run-time statistics
Figure 5. The architecture of CoSL.
strategy engine process the combination of the predictions, and output a final result that is the most likely one. In addition, decomposing run-time statistics into multiple tiers reduces the time complexity of model induction. Suppose we have P servers in a multitier system, and each server reports n metrics for learning the model. The training set is composed of N instances. Inducing a single Tree-Augmented Bayesian Network (TAN) for the whole system requires O(P 2 n2 N ) time [10]. If using multiple models in each tier, the time complexity reduces to O(P n2 N ). In modern multi-tier servers, P can be large because the system may have many tiers and each tier is often implemented as a server farm. The CoSL architecture makes it possible to online measurement and measurement-based admission control.
4.2
Bayesian Network Models and TAN
Bayesian networks is a powerful tool to represent joint probability distributions over sets of random vari-
60
30 90th percentile response time average response time
50
25
40
20
Response time(s)
Response time(s)
90th percentile response time average response time
30
20
15
10 X: 90 Y: 8.559
10
5 X: 800 Y: 1.125
0
0
20
40
60
80 100 120 Number of Clients
140
160
180
0
0
200
(a) Browsing mix
400
600 800 Number of Clients
1000
1200
(b) Ordering mix
Figure 4. 90th percentile and average response time in different traffic mixes. ables [17]. Given the values of a set of random attribute variables, the Bayesian network maps the instance to a class value. The objective of this study is to learn such Bayesian networks that map a combination of system level metrics values to high level states, e.g. overload or underload. A Bayesian network is made up two components: a directed acyclic graph Bs and a set of conditional probability tables Bp . Let U ={A1 ,...,An } be a set of attribute variables, in which Ai can be one of the system metrics, like CPU utilization. A class variable C can be added into U , we get U ∗ ={A1 ,...,An ,C}. Instantiating each of the variables results in an instance. The training set can be defined as D={u∗1 ,...,u∗N }. Thus, given D, a training set learning a Bayesian network is to find a probability distribution P (U ) = P (C) ·
n Y
P (ai |Πai ),
i=1
associated with the network Bs that best matches D, where Πai is the set of parents of ai in Bs . The induced network encodes conditional independence statements assuming that each attribute variable is independent of its non-descendants in Bs given the state of its parents. Thus, a classification can be performed by applying Bayes rules on Bp to predict the class with the highest probability only using the local conditional distributions. TAN [10] is an important class of Bayesian networks that allow the generated Bs to represent correlations between attribute variables. Past studies [6, 7, 22] demonstrated the effectiveness of the model in the design of computer systems. There are two elements crucial to the accuracy of the TAN: • What attributes should be included in the network;
• What scoring function should be employed to evaluate the networks. There are many scoring functions with different characteristics. In this study, we choose BDeu [11] scoring function because it produces best prediction results for our training set. The property of the scoring function and why it fits our training set well is beyond the scope of this paper. The attribute selection problem is crucial, because using all the metrics collected is not efficient. Inclusion of irrelevant metrics may even affect the accuracy of the induced model. We conducted feature selection as a filter to the training set. Feature selection is to select the most relevant metrics correlated to high level class, based on a concept of information gain. We used information gain to evaluate the relevance between the attribute and the class. Information gain is the reduction of entropy about the classification of a test class based on observation of a particular variable. It is the amount by which you reduce the uncertainty about the target class using a particular variable. The information gain between the target class and a variable can be calculated as follows: Inf oGain(C, Ai ) = H(C) − H(C|Ai ) X X X =− p(c) log2 p(c) + p(ai , c) log p(c|ai ), c∈C
ai ∈Ai c∈C
where H(C) is the entropy of class variable and H(C|Ai ) is the conditional entropy of class variable given the attribute variable Ai . We use their information gain to rank the metrics in our training sets. The top metrics will be added to the Bayesian network, until doing so will not increase the accuracy of the network. After selecting a subset of metrics highly correlated to the high level class, we use the method Construct-TAN in [10] to induce TAN models as Bayesian network classifiers.
Table 2. Metrics selected in bottleneck servers. APP OR dentunusd kbbuffers kbcached %util %iowait %idle DB BR ldavg-1 runq-sz %idle %user
5
Metrics meaning Number of unused cache entries in the directory cache Amount of memory used as buffers by the kernel Amount of memory used to cache data by the kernel Percentage of CPU time when I/O requests were issued to the device Percentage of CPU idle time due to an outstanding disk I/O request Percentage of time that the CPU were idle System load average for the last minute number of processes waiting for run time Percentage of time that the CPU were idle Percentage of CPU utilization that occurred while executing at the user level
Evaluation Methodology
In this section, we present our experiment settings, workload generation, and methodology for build up the learning models, using the Rice implementation of the TPC-W benchmark.
5.1
Experiment Settings
Our testbed consisted of a client PC, an application server and a database server. The application server hosting the TPC-W online bookstore servlets and the client PC were configured with a Pentium 4 2.0 GHz processor and 512 MB RAM. The database server was configured with a Pentium D processor with Dual core 2.80 GHz and 1 GB RAM. All the devices were interconnected by a fast Ethernet network. The network was dedicated to our experiments, which eliminated any possible network factors for experiment results. The machines used in our experiments ran Fedora Core 6 Linux with the Linux kernel 2.6.18. We used Apache Tomcat version 5.5.20 as the application server. For the database server, MySQL version standard 5.0.27 was used. We used Sysstat version 7.0.3 to collect 64 system level metrics related to CPU, memory, disk, network on both servers every second. Note that the servers can be very busy when overloaded, and Sysstat failed to get CPU circles sometimes. In order to record data as accurate as possible, the command sar which actually reports system information and its back-end counterpart sadc were re-niced to a high priority. We ran experiments with and without this modification, and found that the performance of the servers was not affected. WEKA (www.cs.waikato.ac.nz/ml/weka) data mining software was used to preprocess training data and induce Bayesian models. In the experiments, we aimed at capturing the underlying characteristics of the servers when overloaded.
We increased Java heap size, maxThreads limit in Tomcat servlet engine, the maximum number of open file descriptor limit in Linux, and adjusted a number of other system configuration parameters so as to ensure no software mis-configuration or bottleneck existed. By doing so, we eliminated all other factors, except the contention of server hardware resource, for a server overload condition. The value of maximum connections to database was set to be 500.
5.2
TPC-W and Workload Generation
The TPC-W specification defines 14 different types of requests (14 servlets in its implementation) for an online bookstore service. It also defines three traffic mixes: Browsing, Ordering and Shopping, as shown in Table 1. We assumed the database contain 10,000 items and 288,000 customers, which corresponds to 350 MB of data. In order to simulate the state that a real server system would have after running for a period of time, we exercised with moderate ordering mix, and increased the size of the database to 600 MB. The prediction accuracy of a Bayesian network relies on the size and the representation of the training set. We designed two different workloads to train the system: steady and spike. We collected system level runtime statistics on each tier every second. The average statistics over a 10-second interval combined with its corresponding high level state formed an instance in a training set. Data from both steady and spike training sets were merged into one. Browsing and Ordering mix were used for both workloads, while Shopping mix was reserved for testing. The workload generator provided by the TPC-W implementation was used for the experiments. We varied the load generated by changing the number of emulated browsers(EB). Steady workload. In this experiment, we fixed the number of emulated clients in each run and gradually increased the load by increasing the number of EBs from one run to the next. When the server ca-
pacity was reached, we continued to increase the load to a level of 1100 concurrent clients. Each run lasted for 800s with a 100s ramp-up followed by a 600s sampling period and 100s ramp-down time. Only the data from the 600s sampling time was used for training. Recall that for different traffic mixes, the peak throughput and maximum concurrent levels are quite different. Thus we used different incremental steps for browsing and ordering mix. For ordering mix, we added 100 concurrent clients after each run. For browsing mix, we used a small increment, 10 clients, between the two runs until capacity was reached. After the capacity, we used the same increment step as ordering mix. Browsing mix started from 10 EBs and ordering mix began with 100 EBs. Both traffic mix ended with 1100 concurrent clients. Spike workload. Real Internet traffic sometimes has an extreme burst in a short period of time and the website can behave differently under such a spike. The spike workload was designed to simulate this scenario. It consisted of two components: a baseline load and a spike load. The baseline load run 1400s and the spike load comes at the 300th second, lasting for 400s. We used different baseline loads for browsing and ordering mix in order to overload only one tier each time. 200 and 600 ordering clients were running as baseline load for browsing and ordering spike workload respectively. The ordering spike was set to a 1000 ordering client burst, and the browsing spike contained 400 browsing clients.
5.3
Bayesian Model Induction
In the experiments we used Sysstat utility to collect system level statistics on both application and database servers. The data was taken in the sampling interval of 1 second. We labeled the instances as follows: all the instances before the capacity in a steady workload were labeled 0 (underload) and the ones after capacity (including the capacity) were labeled 1 (overload). For spike workload, the instances from the 300th second to the end of the spike were labeled 1. A spike ends when the throughput goes back to the level before the spike. In our design, each server is associated with its own Bayesian models for different traffic mixes. The training sets for different servers and different mixes were preprocessed by discretizing with equal frequency. We chose subsets of the total 64 metrics as the random variables that appeared in each Bayesian model. To learn the Bayesian models, a ten-fold cross validation using the TAN local search algorithm and BDeu scoring function was performed in each training set. Altogether we got four models: APP OR, DB OR, APP BR, DB BR, which represent 4 combinations of application (APP)
and database (DB) server models for ordering (OR) and browsing (BR) mixes. The induced model aims to reveal the information about the bottleneck resources. We tested on the system and found the bottleneck to be application server memory for ordering mix, and database CPU for for browsing mix. Table 2 lists the metrics selected by the APP OR model and DB BR models. Take the APP OR model as an example to see the information the model revealed. There are six metrics selected by the APP OR. Among them, %iowait and %util reflect the amount of time CPU spends on waiting disk I/O requests. By examining the trace file of Sysstat, we see high %iowait and correspondingly low processor %idle time during overload. For the application server, because there is no disk intensive process, the cause should be a shortage of physical memory. When the number of requests exceeds the application server capacity, the working set of the workload cannot be effectively held within physical memory. As a result, memory thrashing occurs, which causes significant throughput drop. Figure 8 shows the structure and probability of the learned Bayesian network for application server with ordering mix. From the figure , we can see that whenever there comes an ordering spike, given the %util metric lies in the range of (91.6%, 98.9%], the probability that the CPU has a very small %idle time(in the range of [0, 0.495%]) is high, say 95.5%. Given the number of unused cache entries in the directory cache (dentunusd) is in the range of [0, 3580], the probability that %util in range (91.6%, 98.9%] is 72.5%. Based on the structure, the Bayesian network tells us, for an ordering spike, a possible reason for the CPU having very little idle time is because CPU is waiting for the response from I/O devices. In meantime, the server showed a small number of unused cache entries in its directory cache. It is mainly due to the presence of excessive file system access which is also attributed to server overload.
6
Experimental Results
In this section, we present experimental results of the CoSL approach with respect to its accuracy, responsiveness and capability of bottleneck identification.
6.1
Accuracy
Accuracy of a model is defined as the percentage of instances that are correctly classified. An accurate model should identify the status of overload as long as the spike comes and do not call false alarm when system
Overload
Table 3. Prediction results of induced models in transient spikes.
Capacity 19.9% [0, 3580]
dentunusd
kbcached
72.5%
(91.6%, 98.9%] kbbuffers
%util
95.5%
%iowait %idle
Instances ... 178 179 180 181 182 183 184 ...
Labeled State ... no no yes yes yes yes yes ...
Predicted Yes/No Prob. ... 0.009/0.991 0.006/0.994 0.979/0.021 0.999/0.001 0.743/0.257 0.649/0.351 0.999/0.001 ...
[0, 0.495%]
Figure 8. Bayesian network for APP OR model.
has moderate loads. We evaluated the accuracy of the induced models with four workloads. Figure 6 shows the accuracy of these methods under different traffic patterns. From the figure, we can see that although Bayesian Network(BN) does not always perform better than other metrics, it has a consistent prediction accuracy throughout the four tests. BN discussed here is the model from the bottleneck tier according to the traffic, the BN in the first bar is the APP OR model. For comparison, Figure 6 also includes results due to individual metrics and high level response time. The CPU usage metric performed well in browsing spike and normal ordering cases. Recall that database CPU is the bottleneck for browsing mix, this is why single CPU metric is enough to identify a browsing spike. However, using only CPU usage is not able to distinguish a browsing spike and moderate browsing load because browsing mix contains long requests consuming much database CPU. This is why CPU usage has a bad performance in moderate browsing load test. The SOCKET metric refers to the total number of sockets opened in the corresponding server. It indirectly reflects the load level on each tier. However, when server is overloaded, a larger number of clients quit and leave the sockets they opened on the servers unreleased. That is why the SOCKET metric performed well in normal cases like NORMAL OR, while had a poor performance in spike test SPIKE BR. As for the response time, we tested two threshold values: the value from a ordering mix and the value from a browsing mix. According to Figure 2, threshold were set to 1.125s and 8.559s, respectively. If the threshold is set as ordering mix threshold, the system
will prematurely reject many long requests in browsing mix. This explains why ordering response time threshold led to worse results in the normal browsing workload. In contrast, the response threshold from browsing mix may not call false alarm often. However it is less responsive to the spike. In both spike tests, it resulted in a lower accuracy than ordering response time and BN. In summary, the BN model is able to provide accurate prediction of system state across all traffic patterns.
6.2
Responsiveness
The objective of this experiment is to compare the induced Bayesian models with response time based measurement in terms of their responsiveness when spike load occurs. Response time is composed of request processing time and waiting time in each tier. It reflects the round trip time of the requests in the last time window. When there comes an extreme spike, the execution queue in each tier can be filled in a short period of time. However the response time metric is not able to count the effect caused by the requests waiting in the queue. In contrast, our CoSL Bayesian model predicts overload state based on lower level system metrics, including waiting queue lengths at each system component. Figure 7 shows the changes of the response time during a transient spike. In this experiment, we added the extreme browsing spikes at the 1800th and 5400th seconds. To avoid transient variation, we plotted the 90th percentile response time in a 10-second interval. From the microscopic view of the time frame from 1780 to 1900 (the range in the x-axis is from 178 to 190), we can see that the spike at time of 1800 would not be observed in 2 intervals (20 seconds). Even at the 1820th second, the response time was reasonably good and below the browsing response time threshold.
4
BN CPU SOCKET RSP−OR RSP−BR 100 90 80 70 60 50 40
2
10 90th percentile response time (s)
Percentage of correctly classified instance
10
0
10
30
−2
10
20 10
−4
10
30
0
20 10 0
178
−6
10 SPIKE_OR
SPIKE_BR
NORMAL_OR
NORMAL_BR
Figure 6. Prediction accuracy due to different models. In contrast, the induced Bayesian model is more responsive to the spike. Table 3 lists the predicted state (yes/no) probability of the DB BR model. The actual labeled states are also included. Based on the data from the 180th interval (1800th second), the model found that there is a high probability (0.979) that the server is overloaded and predicted the high level state as “yes” (“overloaded”). Therefore, our CoSL approach based on low level statistics is more responsive to the spikes.
6.3
delay x=182 spike y=2.91 x=180
Bottleneck Identification
In this subsection, we demonstrate how an administrator can make use of the models. Table 4 lists the prediction accuracies of different models in different workloads. Note that the table contains the predictions for the shopping mix, which is not included in training sets. The DB BR model is able to detect the shopping spike and works well with moderate shopping load. Note that DB BR model has a good prediction accuracy for shopping mix. It is because the shopping mix is close to a browsing mix in request composition profile. The CoSL model is robust in that whenever facing a new traffic, the model which is more similar to the traffic is likely to generate an accurate result. As a whole, the final result will be a combination of individual results; it is in-sensitive to the dynamics of workload. The “0” or “1” is the prediction generated by individual models and the percentage is the accuracy of the model in this case. For example, the value 1(96%) in the first row and first column means 96% of the instances during a ordering spike will be predicted as 1(overload). A question mark(?) means that we are uncertain what prediction will the model produce. It is important to set an optimized threshold for the certainty of the predictions. A small value results in com-
0
150
300
180
450
182
600 time(10s)
184
186
750
188
900
190 1050
1200
Figure 7. Response times in transient spike.
app_or =0
=1 overload
db_br =0 underload
=1 overload
Figure 9. Decision tree-based classification.
Table 4. Prediction accuracy of induced Bayesian models. Test set spike or norm or small or spike br norm br small br spike sh norm sh
APP OR 1(96%) 0(95%) 0(99%) ?(85%) 0(100%) 0(100%) ?(68%) 0(100%)
DB OR ?(62%) 0(98%) 0(99%) ?(21%) 0(95%) 0(100%) ?(44%) ?(83%)
APP BR ?(59%) ?(19%) ?(33%) ?(79%) ?(75%) 0(97%) ?(76%) 0(100%)
DB BR 0(99%) 0(99%) 0(99%) 1(95%) 0(96%) 0(100%) 1(96%) 0(98%)
plicated policies, while a large value may suffer from poor prediction accuracy. In our experiments, we empirically set the threshold of the certainty as 90%. We enumerated all the possible values whenever there is a question mark and got the training set. A decision tree was learned from the training set using the Iterative Dichotomiser 3 algorithm (ID3). The tree structure is illustrated in Figure 9. The decision tree alerts administrators that whenever the APP OR model has a prediction of 1, the multi-tier server is most likely to be overloaded. If the APP OR model
says 0 and the DB BR model reports 1, the system is most likely to accept too many browsing requests and the bottleneck resides in the database tier.
7
Related work
Server capacity determination is crucial to the problem of resource planning and quality of service(QoS) guarantee in Internet servers. However, few of previous work has directly addressed the problem of measuring the capacity for multi-tier websites. Early work [1] focused on how to generate synthetic workload that is able to exceed the server capacity. Only the single tier HTTP web server’s capacity was studied. The work in [5] defined benchmarks for measuring the basic capacities of streaming servers. Our focus is on measuring the capacity of multi-tier e-commerce websites. There are many work in the areas of admission control, overload control, QoS guarantee for web servers; see [21] for a comprehensive review. Determining the capacity of servers is an integral component of measurement-based admission control. An admission controller should know when to turn away excessive requests; the overload control mechanism should be invoked whenever the server capacity is reached. Many past work employed a single rule of thumb to measure server capacity. Some use application level metric as threshold for performing admission control, such as the length of the web server request queue [13], or the incoming traffic density [2, 3]. Application level data structures do not necessary reflect the actual load in the server; a small number of heavy requests could cause server overload. Others monitor server system level metrics, such as CPU utilization and memory usage as a indicator of overload [8, 4]. However, in multitier websites, bottleneck resources may change due to the dynamics of workload and it is difficult to set the threshold value. Our approach defines a group of relevant metrics and correlate them to high level system overload state without assuming any threshold value. More recent approaches have taken end-to-end performance metrics such as request response time, to identify overload [19, 14, 9]. In [19], the authors suggested to employ SEDA (Staged Event-Driven Architecture) as the fundamental structure of admission control in Internet services. At each stage, response time controller performs admission control if target response time is violated. In this design, it is hard to set the value of parameters in response time controller and there is no optimal guarantee. A conservative way in setting the response time target make admission control easier. In [14], half of the most restrictive request response time guarantee is used as the threshold for controlling the incoming request rate. In
[9], the measurement-based admission control approach was based on the execution time of servlets (requests). However, they assumed a non-preemptive shortest job first scheduling policy in the database server. As a result, the servlets would have predictable processing time, independent of the server load condition. It makes it possible to estimate system utilization by admitted servlets. Most of application servers are run in a processor sharing policy. In such servers, the processing time of a request is affected by other requests in concurrent execution. Even with a time-based server capacity estimate, request response time can no longer be used as a reference to calculate server utilization. Our work is closely related to [6, 22, 7, 20] in that they use similar statistical models to capture underlying server characteristics. Cohen et al. proposed to use a TAN model to generate system signatures for the purpose of performance problem diagnosis [6, 7]. The model accuracy was improved in [22] by maintaining an ensemble of models. However, their work is different from us in objectives and methods. They were to develop correlation information in a busy server rather than a overloaded system. In [20], the authors used low level system metrics to maximize throughput by reconfiguring hardware under different traffic rather than overload prevention. All of them used a single model for the whole website. In contrast, we use multiple models for multi-tiers. The prediction results from the models are combined together to identify server capacity as well as the bottleneck tier.
8
Conclusion
In this paper. we propose a robust coordinated statistical learning approach (CoSL) to measuring the capacity of multi-tier websites. It uses a Bayesian network model to correlate instrumentation data to system states in each tier. A decision tree is induced over the group of Bayesian models to identify the bottleneck tier dynamically when the system is overloaded. The approach is robust in the sense that it is insensitive to the change of input traffic and free of tuning parameters. The CoSL could be extended to websites in server farm organizations.
Acknowledgements The authors thank Dr. Song Jiang and other group members for their comments and suggestions about this work. The authors are also grateful to the anonymous reviewers for their constructive comments. This research was supported in part by U.S. NSF grants ACI-0203592, CCF-0611750, DMS-0624849,
CNS-0702488, CRI-0708232, and NASA grant 03OBPR-01-0049.
References [1] G. Banga and P. Druschel. Measuring the capacity of a web server. In Proceedings of USENIX Symposium on Internet Technologies and Systems(USITS), 1997. [2] H. Chen and P. Mohapatra. Session-based overload control in qos-aware web servers. In Proceedings of INFOCOM, 2002. [3] X. Chen, P. Mohapatra, and H. Chen. An admission control scheme for predictable server response time for web accesses. In Proceedings of international conference on World Wide Web(WWW), pages 545–554, 2001. [4] L. Cherkasova and P. Phaal. Session based admission control: a mechanism for improving the performance of an overloaded web server. Technical Report HPL-98-119, HP Labs, 1998. [5] L. Cherkasova and L. Staley. Measuring the capacity of a streaming media server in a utility data center environment. In ACM Multimedia, pages 299–302, 2002. [6] I. Cohen, J. S. Chase, M. Goldszmidt, T. Kelly, and J. Symons. Correlating instrumentation data to system states: A building block for automated diagnosis and control. In Proceedings of Symposium on Operating Systems Design and Implementation(OSDI), pages 231–244, 2004. [7] I. Cohen, S. Zhang, M. Goldszmidt, J. Symons, T. Kelly, and A. Fox. Capturing, indexing, clustering, and retrieving system history. In Proceedings of ACM Symposium on Operating Systems Principles(SOSP), pages 105–118, 2005. [8] Y. Diao, N. Gandhi, J. L. H. S. Parekh, and D. M. Tilbury. Using mimo feedback control to enforce policies for interrelated metrics with application to the apache web server. In Proceedings of Network Operations and Management Symposium(NOMS), pages 219–234, 2002. [9] S. Elnikety, E. M. Nahum, J. M. Tracey, and W. Zwaenepoel. A method for transparent admission control and request scheduling in e-commerce web sites. In Proceedings of international conference on World Wide Web(WWW), pages 276–286, 2004. [10] N. Friedman, D. Geiger, and M. Goldszmidt. Bayesian network classifiers. Machine Learning, 29(2-3):131–163, 1997.
[11] D. Heckerman, D. Geiger, and D. Chickering. Learning bayesian networks: The combination of knowledge and statistical data. Machine Learning, 20(2):197–243, 1995. [12] H.-U. Heiss and R. Wagner. Adaptive load control in transaction processing systems. In Proceedings of International Conference on Very Large Data Bases(VLDB), pages 47–54. Morgan Kaufmann, 1991. [13] R. Iyer, V. Tewari, and K. Kant. Overload control mechanisms for web servers. In Proc. of Workshop on Performance and QoS of Next Generation Networks, 2000. [14] J.M.Blanquer, A.Batchelli, K.Schauser, and R.Wolsk. Quorum: Flexible quality of service for internet services. In G. M. Lohman, A. Sernadas, and R. Camps, editors, Symposium on Networked Systems Design and Implementation (NSDI), 2005. [15] A. Kamra, V. Misra, and E. M. Nahum. Yaksha: a self-tuning controller for managing the performance of 3-tiered web sites. In Proceedings of International Workshop on Quality of Service(IWQoS), pages 47–56, 2004. [16] J. C. Mogul. Emergent(mis) behavior vs. complex software systems. In ACMSIGOPS Operating System Review, 2006. [17] J. Pearl. Probabilistic Reasoning in Intelligent Systems: Networks of Plausible Inference. Morgan Kaufmann Pub., San Francisco, CA, USA, 1988. [18] J. Wei and C.-Z. Xu. eQoS: Provisioning of client-perceived end-to-end qos guarantees in web servers. IEEE Transactions on Computers, 55(12):153–1556, Dec. 2006. [19] M. Welsh and D. E. Culler. Adaptive overload control for busy internet servers. In Proceedings of USENIX Symposium on Internet Technologies and Systems(USITS), 2003. [20] J. Wildstrom, P. Stone, E. Witchel, and M. Dahlin. Machine learning for on-line hardware reconfiguration. In Proceedings of International Joint Conferences on Artificial Intelligence(IJCAI), pages 1113–1118, 2007. [21] C.-Z. Xu. Scalable and Secure Internet Services and Architecture. Chapman and Hall/CRC Press, 2005. [22] S. Zhang, I. Cohen, M. Goldszmidt, J. Symons, and A. Fox. Ensembles of models for automated diagnosis of system performance problems. In Proceedings of International Conference on Dependable Systems and Networks(DSN), pages 644–653, 2005.