2013 IEEE 4th Control and System Graduate Research Colloquium, 19 - 20 Aug. 2013, Shah Alam, Malaysia
Cross Validation Approach in Qualification of Observed Gravity Data Saiful Aman Hj Sulaiman, Kamaluddin Hj Talib, Mat Akhir Md Wazir & Othman Mohd Yusof Center of Study Surveying Science and Geomatics Faculty of Architecture, Planning and Surveying Universiti Teknologi MARA, MALAYSIA Shah Alam, MALAYSIA
[email protected]
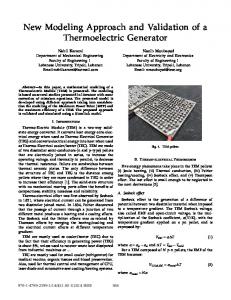
authorized government agency that is responsible for retaining all geodetic information for the country. Currently, all the gravity data collected by DSMM is related to the International Gravity Standardization Net 1971 (ISGN71). In addition, the physical and geometrical geodetic information is always referenced to the Geodetic Reference System 1980 (GRS80). Each gravity data point consists of a point number, geographical latitude and longitude, height (mainly related to mean sea level) and gravity value. Figure 1 shows the geographical distribution of gravity data points around Peninsular Malaysia.
Abstract— The compilation of observed gravity data has to go through a vetting process to ensure that all the data to be used is errorless. The quality of gravity data affects the accuracy and reliability of the geoid that will be established. In this study, cross validation approach was proposed in order to qualify the existing observed gravity data. Therefore, the efficiency of the cross validation approach is scrutinized during detection and removal of outliers. Finally, new improvements are developed in the observed gravity database. Keywords- Geopotential Model, Geoid, Cross Validation, Outliers & Gravity Anomalies
I.
The gravity data obtained from DSMM was collected since 1988 by using LaCoste & Romberg gravimeters. The gravity data is mainly located along accessible roads. These data points are divided into 3 main classes known as 1st, 2nd and 3rd order. The accuracy of the gravity data is in the range of 0.030 - 0.100 mGal.
INTRODUCTION
A geoid is an equal potential surface of the Earth's gravity field that theoretically coincides with mean sea level. Due to irregularities of mass density inside the Earth, geoid height is undulated with respect to the geodetic reference ellipsoid.
.
The most fundamental formula in computing geoid height is Stokes's formula [1]. When using this formula, the quality and quantity of input gravity data play a very significant role in the production of an accurate and precise geoid height. However, to achieve centimeter level accuracy, gravity data spacing must be within 2 - 3 km [2]. Currently, limited gravity data is available on Peninsular Malaysia. In addition, the existing gravity data was collected and compiled in1954 [3], and may be not be consistent because of different techniques of observation and equipment. In order to produce precise geoid height models using this data, it is important to eliminate the obvious error contained in the existing gravity databases.
1st Order
In this study, a cross validation approach is used in identifying and removing the errors in the existing gravity databases. Finally, a new gravity anomaly database is proposed and developed. II.
2nd Order 3rd Order
LOCAL GRAVITY OBSERVATION DATA
The gravity data used in this study was obtained from the Department of Survey and Mapping Malaysia (DSMM), the
978-1-4799-0552-2/13/$31.00 ©2013 IEEE
Figure 1 Geographical distribution of gravity data points around Peninsular Malaysia (Courtesy from DSMM)
168
2013 IEEE 4th Control and System Graduate Research Colloquium, 19 - 20 Aug. 2013, Shah Alam, Malaysia
The gravity data coverage in Peninsular Malaysia is more or less satisfactory except in the central regioon, where the area is difficult to access and hilly. The total gravvity data within the study area is approximately more than 3500 3 points. The quality and quantity of the gravity data directly d affect the accuracy of subsequent geoids
III.
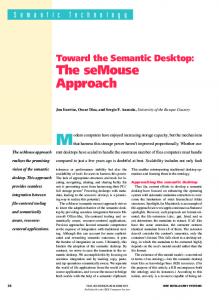
• Interpolate the removeed point based on the surrounding data. e by comparing the existing • Finally, compute the errors and predicted values at the same s position. Interpolation technique is also a used in the cross validation process. Therefore, proper inteerpolation must be used in order to assess the quality of the datta. There are various techniques available such as kriging, innverse distance weighting and nearest neighbour. Howeveer, in this study, kriging interpolation technique is used in the cross validation process
ROACH CROSS VALIDATION APPR
As mentioned above, quality and quuantity of gravity anomaly data are the main contributions too geoid accuracy. Therefore, before any computation is donee using Peninsular Malaysia gravity data, obvious errors need too be eliminated. The most common approach in dettecting errors in observed gravity anomaly is by direct com mparison with the free-air anomaly derived from a Global Geeopotential Model (GGM). The most suitable global geopottential model for detecting errors would be a combined solutioon such as EIGEN -6C [4], EGM2008 [5] or GIF48 [6]. EGM M2008 is the most suitable combined GGM that can be used foor this comparison. This choice is based on previous investigattions done by [7]. The combined GGM solution already inclludes the medium wavelength information of the Earth's gravity g field. To produce more realistic and reliable resultts, the effects of topography should be considered because topographic data contains short wavelength information that iss not comprised in the GGM. The most reliable, effective and accurate approach for reducing topographic effects is Residual Terrain Modelling (RTM) [8]. Finally the reduced gravity anom maly is produced: ி ி ߂݃ௗ௨ௗ ൌ ߂݃ி െ ߂݃ோ்ெ െ ߂݃ீீ ெ
Figure 2. Schematic diagram forr detecting and cleaning outliers using cross validattion approach
(1) IV.
where ߂݃ி is computed land or marine free f air anomaly, ி ோ்ெ ߂݃ is Residual Terrain Model effects andd ߂݃ீீெ is the free air anomaly derived from Combined GG GM.
RESULTT AND ANALYSIS
In this study, a total number of 3414 observed gravity data points from the DSMM databbase were converted to gravity anomaly. Free-air gravity anoomaly derived from EGM2008 was also extracted at the saame positions as the observed gravity data. Figure 3 showss the graphs of observed and derived gravity anomaly. How wever, it is hard to identify the errors from this figure alone. Therefore, Table 1 shows the statistical information about thhe gravity anomalies computed from surface gravity data andd the gravity anomalies derived from selected global geopottential models on the Earth's surface, as well as the diffeerences between both types of gravity anomalies. From this table, it is clearly shown that some of the points contaiin errors, the largest being 110.375mGal. However, this is just preliminary statistical information about errors in thee observed gravity data. It is not strong enough to declare the obvious o difference is caused by outliers.
With advantages in displaying informaation in three (3) dimensions, visual inspection is the simplest approach that can be used in detecting outliers. Thus, the residual map of reduced gravity anomaly should be producced. From the 3D surface residual map, suspicious observationns can be identified when some of the map surface suddenly has h a deep hole or steep spike. This method is simple but veryy time consuming when dealing with huge datasets and large am mounts of outliers. Therefore, using a cross validation approoach can help in reducing time needed for identifying and removing r outliers. Figure 2, presents the schematic diagram for detecting and cleaning outliers using cross validation approoach. The theory of cross validation was first introduced by [9]. Generally, the main objective of this approaach is to assess the quality of gridding techniques. Therefore, this t technique can also be used for assessing spatial variation [10] as well as a guide for data sampling. There are three (3) main steps in a cross validation v process. This process is performed repeatedly for thhe entirety of the data. The process can be simplified as follow ws: • Remove the required point to be preedicted.
169
2013 IEEE 4th Control and System Graduate Research Colloquium, 19 - 20 Aug. 2013, Shah Alam, Malaysia Table 2. Statistical analysis for gravity anomaly after reduction of residual terrain model and global geopotential model. No. of Data
Table 1 Statistical analysis for surface gravity anomaly and selected global geopotential model gravity anomaly on the geoid surface as well as their differences (mGal) Max
Mean
RMS
dg_surf
3224
-62.104
198.08
16.206
18.826
dg_egm2008
3224
115.936
21.632
16.917
differences
3224
-32.986 103.034
110.375
-5.426
12.527
Mean
RMS
3224
-45.883
143.138
-8.394
17.966
dg_surf_rtm
3224
-44.798
105.316
24.600
11.263
3224
-42.819
83.363
30.027
11.028
A total number of 3224 data points went through a process of cross validation. The procedure of cross validation was previously explained, and the results obtained from this cross validation process can be seen in Figure 5. The resulting residual histogram was determined from the cross validation results of gravity anomalies after residual terrain model reduction with EGM2008, while the statistical analysis can be seen in Table 2. By drawing a histogram, the absolute value of differences between predicted and reduced observed gravity anomalies can easily be identified. Outliers can be detected on the histogram by looking for any sharp changes in the slopes. That value can be used and set as a tolerance or acceptance value in detecting outliers. [11], [12]. Any residual value that falls below the tolerance or acceptance value is considered as true.
Figure 3 1' x 1' grid of gravity anomalies computed and derived from observed (left) and EGM2008 (right)
Min
Max
dg_rtm
dg_surf_rtm_ egm2008
No. of Data
Min
In order to identify and eliminate errors in the observed gravity database, the procedure in figure 4 must be followed. In order to produce more reliable results, the application of proper terrain correction must also be applied properly. In this study, the Residual Terrain Model was computed by using TC routine in the GRAVSOFT computer program with a constant of mass density of 2.67 g/m3 (Forsberg, 1984). Figure 4 illustrates the gravity anomaly surface after residual terrain model reduction with and without selected global geopotential models. While Table 2 shows the statistical information about the same process.
Figure 5 Histogram of absolute value of residual after cross validation
Figure 4 Surface representation of the residual terrain model (top) and gravity anomaly after residual terrain reduction without GGM (bottom left) and with EGM2008 (bottom right)
170
2013 IEEE 4th Control and System Graduate Research Colloquium, 19 - 20 Aug. 2013, Shah Alam, Malaysia
REFERENCES Table 3 Statistical Analysis of reduced gravity anomaly after cross validation Filename dg_surf_rtm_egm 2008
[1] [2]
No. of Data 3224
Min
Max
Mean
RMS
-114.968
44.745
2.989
19.713
[3]
Predicted Residual = (PredictedReduced Observed)
3224
-78.525
57.907
0.031
6.136
[4]
Based on the histogram in Figure 5, the residual value drops sharply at 20 mGal. Therefore, in this study, any residual value more than ±20 mGal is considered as an outlier, and needs to be removed. Based on the tolerance value, a total number of 56, or 1.7%, of the recorded data from reduced gravity anomalies with EGM2008 were found to exceed the limit. Table 4 provides the statistical information on the accuracy of the cleaned gravity data that will be used in further computations of geoid height.
[5]
[6]
Table 4 Statistic accuracy of cleaned gravity anomaly data after removing outliers using cross validation approach Filename
No. of
Min
Max
Mean
RMS
-32.986
115.936
21.489
16.744
[7]
Data dg_surf_rtm_egm08
3168
[8]
[9]
V.
CONCLUSION
[10]
In this paper, a new land observed gravity anomaly database has been developed, which helps towards the determination of a precise and high resolution geoid model for Peninsular Malaysia. The existing observed land gravity data was filtered, and has removed outliers by using a cross validation approach. The removal of an observation as erroneous depends on any sharp changes in the slope of the residual histogram. In this study ±20 mGal was used as a rejection limit. Any observed gravity data with residual more than the rejection limit was classified as an outlier. Finally, this study showed that the accuracy of gravity anomaly data significantly improves after using a cross validation approach.
[11]
[12]
ACKNOWLEDGMENT The authors would like to thank Geodesy Section, Department Survey and Mapping Malaysia (DSMM) for providing the gravity observation data for whole Peninsular Malaysia. Thanks are also due to all my colleagues who assisted to contributed in processing the all gravity observation data and last but not least the unknown reviewers are gratefully acknowledged.
171
B. Hofmann-Wellenhof and H. Moritz, Physical Geodesy. SpringerWein New York, 2005, p. 404. R. Forsberg, “Development of a Nordic cm-geoid with basics of geoid determination.,” In Nordic Geodesy Towards the 21st Century. Lecture Notes for Autumn School , Nordic Geodetic Commission (Harsson , B. G. , ed.), pp. 67–88. Statens kartverk , Geodetic Publication, 2001. The Department of Survey and Mapping Malaysia, “Status of Surveying and Mapping in Malaysia,” in Nineteenth United Nations Regional Cartographic Conference for Asia and the Pacific. Item 6(a) of the provisional agenda Conference papers: country reports, 2012. C. Förste, S. Bruinsma, R. Shako, J. Marty, O. Abrikosov, C. Dahle, J. Lemoine, R. Biancale, F. Barthelmes, R. König, and G. Balmino, “A new combined global gravity field model including GOCE Data used for EIGEN-6C / S,” in European Geoscience Union, General Assembly 2011, 2011, no. April. N. K. Pavlis, S. A. Holmes, S. C. Kenyon, and J. K. Factor, “An Earth Gravitational Model to Degree 2160 : EGM2008,” in European Geosciences Union, General Assembly 2008, 2008, vol. 10, p. 7962. J. C. Ries, S. Bettadpur, S. Poole, and T. Richter, “Mean Background Gravity Processing Mean Gravity Field from Space and Ground,” in GRACE Science Team Meeting, 2011. S. A. H. Sulaiman, K. H. Talib, M. A. M. Wazir, and O. M. Yusof, “Comparison of gravity anomalies from terrestrial gravity and recent geopotential models over WestMalaysia,” System Engineering and Technology (ICSET), 2011 IEEE International Conference on. pp. 183–187, 2011. R. Forsberg, “A study of terrain reductions, density anomalies and geophysical inversion methods in gravity field modelling,” Scientific Report No.5 The Ohio State University, p. 129, 1984. S. Geisser and W. F. Eddy, “A Predictive Approach to Model Selection,” Journal of the American Statistical Association, vol. 74, no. 365, pp. 153–160, Mar. 1979. H. Zhang and Y. Wang, “Kriging and cross- validation for massive spatial data,” Environmetrics, vol. 21, no. 3–4, pp. 290–304, Sep. 2010. R. Kiamehr, “Qualification and refinement of the gravity database based on cross-validation approach — A case study of Iran,” Acta Geodaetica et Geophysica Hungarica, vol. 42, no. 3, pp. 285–295, Sep. 2007. A. Abdalla, “Determination of a gravimetric geoid model of Sudan using the KTH method,” Royal Institute of Technology (KTH), 2009.