dress its properties and limitations, a system archi- tecture to ..... where tickets for drinks are sold, will eventually show up at the ... location or in a cloud service.
Crowd textures as proximity graphs Claudio Martella1 , Aart van Halteren1 , Maarten van Steen1 , Claudine Conrado2 , Jie Li3 1
The Network Institute, VU University Amsterdam 2 Thales Research & Technology, Delft 3 Technical University Delft
Abstract
attention is also being given to the study of crowds and crowd dynamics. The term “crowd dynamics” is used to refer to patterns of crowd movement, and more precisely to ’the coordinated movement of a large number of individuals to which a semantically relevant meaning can be attributed, depending on the respective application’ [3]. Examples include a queue of people, the formation of uni-directional “lanes” in bi-directional pedestrian flows, the intersection of these lanes, or a group of people at a specific location. We use the phrase texture of a crowd to express the spatio-temporal relationships resulting from the interdependencies in the social fabric of a group of people. At this stage we may not yet fully understand what potential insights can be derived from crowd textures, but in any case it enables the study of emergent spatio-temporal and social behavior of people in a crowd. For example, it allows one to question to what extent a group is dispersed in a crowd. Discovering and investigating the texture of a crowd is at the heart of research in crowd management. As a prerequisite, it is essential to adequately represent texture. A common approach is to simply place camera’s and collect their images and videos. There are a few drawbacks: the computational cost of video analysis limits the scale at which experiments can be run, cameras can be affected by complications such as occlusion and incomplete coverage, and privacy issues can emerge when the footage is recorded from real-world events. As an alternative, on-body sensors can be used. Such sensors can collect rich information about the individual behavior of each subject. We believe
We are only starting to understand how people behave when they are part of a crowd. This article presents a novel approach for the study and management of crowds. The approach comprises of a device to be worn by individuals, an infrastructure to collect the information from the devices, a set of algorithms for recognizing crowd dynamics, and a set of feedback strategies to intervene in the crowd. A fundamental element of our approach is to consider crowds in terms of their texture. The crowd texture is represented through the proximity graph, a data-structure that captures the spatial closeness relationship between individuals over time. We address its properties and limitations, a system architecture to measure and process it, and a few examples of insights that can be obtained from analyzing it.
Introduction We may be witnessing the dawn of a radical change in the social sciences. With the availability of a vast amount of online data through Online Social Networks, and the usage of wearable sensing and computing devices, scientists no longer need to rely only on self-reported data on social behavior. The availability of these digital traces now form an important asset for the field of Computational Social Science [1] which investigates complex social systems through quantitative modeling. Research in this field has so far focused mainly on the analysis of online social networks and of patterns emerging from face-to-face interactions [2]. More recently, 1
a better understanding of crowd dynamics can be achieved by sensing from within the crowd instead of from an external observation point, as the sensing is based directly on the crowd: the individuals forming the crowd. An example of this approach can be found in [3] where accelerometers are used to recognize groups of people walking together. A crowd is more than just a sum of individuals and collective behavior results from a continuous interaction and mutual influence between each individual and those nearby. The literature presents a vast number of examples of such behaviors as exhibited by animals such as swarms of insects, flocks of birds and schools of fish, and there is evidence of herding behavior also in humans [4]. Such networks of influence are fundamental for the emergence of collective behavior and are based both on the spatial relationship between the individuals as well as their social relationships. In this paper, we address the representation of the texture of a crowd through a (dynamic) proximity graph 1 . The proximity graph provides a computational representation of a crowd over time, it allows the analysis of the crowd texture it represents, and it provides a way to compute the effects of interventions into the crowd. Modeling relationships between individuals through a graph is not new. Social graphs represent social relationships between individuals through edges. Also, on-body sensors have been used to actually measure social graphs [2, 5]. Finally, since a few years various groups have been dedicated to gathering data on the mobility of people. However, using a spatio-temporal graph to represent the texture of a crowd has not been done before, and we are not aware of any attempts to do so at the scale of (tens of) thousands of people. Besides its intended scale, the novelty of the proposed approach lays in the content of the proximity graph and the semantic interpretation of an edge. At a specific moment in time, an edge merely represents that two individuals were close to each other. Measurements over prolonged periods will reveal social groups (as we will discuss in this paper), spatial structures (like lanes, clogging, and so on), but also the changes in the texture that result from targeted
interventions (like displaying announcements on a large public display). The main contribution of this paper is introducing the concept of crowd textures and their representation with proximity graphs. The remainder of this paper is organized as follows. We connect the local spatio-temporal nature of crowds and crowd dynamics to the concept of crowd texture. We then introduce the proximity graph as a representation of crowd textures, along with analytic examples. We describe a system architecture for an instrument to extract a series of proximity graphs from a crowd, analyze it, and communicate feedback to the crowd. We present an analysis of the proximity graphs we collected during a real-world experiment through a wearable device. We conclude by discussing possible extensions to the presented work.
Crowds and Crowd Dynamics
A generally accepted definition of a crowd is that it is a sizable number of individuals gathered together at a specific location with a sufficient density distribution, for a measurable amount of time and for a specific purpose. Moreover, the individuals in a crowd generally act in a coherent manner, sharing a social identity and common goals, interests and behavior, in spite of coming together in a typically unfamiliar situation. Crowd behavioral patterns emerge from individual human interactions, which typically have a strong local character: individuals in a crowd influence one another, and this influence is stronger between nearby individuals. In fact, several models of crowd dynamics - which give rise to large-scale emergent behavioral patterns - do take into account local interactions between individuals, as well as the related measures of crowd density. For example, the social force model and its extension for panicking pedestrians [6] considers physical forces between individuals (as well as forces between individuals and the environment). The forces depend on the dynamic spatial relationships among close individuals (more specifically, their distance). This model can be simulated to show most of the coordinated and uncoordinated behavioral patterns mentioned above. 1 Our definition of proximity graph should not be conFrom these continuous interactions, reflected in fused with that of a Relative Neighborhood Graph, although the two share some of their properties. the crowd texture, behavioral patterns in crowd 2
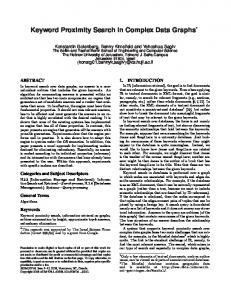
(a) Detection of a congestion
(b) Detection of flows
(c) Detection of social groups
Figure 1: Examples of analyses to perform on the proximity graph dynamics can clearly emerge. Therefore, by measuring the crowd texture, substantial information about the underlying crowd dynamics can be gathered. However, in order to be useful, this information needs to be put in the context in which the crowd exists. The contexts can be diverse, e.g. a football stadium, a train station, a music festival or a scientific conference. A pattern such as clogging, for instance, may occur in all these diverse contexts as it depends on environmental constraints such as the existence of narrow passages. In a music festival or stadium, clogging may occur at the entrance or exit of the festival site or stadium. Finally, in a train station, clogging may occur at the entrance to the station hall or entrance to a train, or at the access to stairs/escalators. The same measured crowd texture will clearly mean different things in different situations, with corresponding different risk level assessments and different feedback strategies to intervene in the crowd.
physical proximity, within a chosen distance. Each edge represents only the Boolean relationship without capturing the actual distance. Time is generally discretized into small slots. If and only if two individuals were detected to be in each other’s proximity during a time slot, their associated vertices will be joined by an edge for that slot. A proximity graph is therefore dynamic; we speak of a proximity graph at time t as a (proximity graph) snapshot at t. Note that a proximity graph is naturally represented by a time series of proximity-graph snapshots. Although a proximity graph contains spatial information, it does not rely on absolute positioning data. It is the global representation of the texture of a crowd constructed from the local perspective of individuals within that crowd. A proximity graph incorporates information to support the modeling of crowd dynamics where the individual behavior is defined only on relative neighborhood information. Basic models of flocking behavior are of this kind, as they are controlled by the following simple rules [7]. (1) Separation: avoid crowding neighbors (short range repulsion), (2) Alignment: steer towards average heading of neighbors, (3) Cohesion: steer towards average position of neighbors (short range attraction) . Each of the three rules can be applied by a member of the crowd based only on local information, namely its neighbors’ states, and no global view or absolute
The Proximity Graph A static proximity graph is a representation of the texture of a crowd at a specific moment in time. In its basic form, each vertex corresponds to an individual. Two vertices are joined by an edge if the two individuals they stand for happened to be in 3
spatial reference points are necessary. This type of modeling has been successfully applied to human herding behavior as well [4]. The above set of rules has been extended in different ways since its introduction to incorporate emotions, leadership etc.
Analyzing the proximity graphs We now introduce a few examples of categories of analyses that could be performed on proximity graphs, which correspond to the contexts mentioned in the previous section. Fig. 1a presents a scenario where a crowd is exiting a stadium. As each individual approaches the exit, the local density increases given the physical bottleneck imposed by the gate. In the proximity graph, the local density is represented for each vertex by its degree, the number of incident edges (depicted in the figure for a particular vertex with thicker lines). Recognizing a congestion requires measuring the gradient of the average density of a crowd as it approaches the exit. Fig. 1b presents a scenario at a train station where a pedestrian flow is forming on a platform. There are two groups of individuals: on the left there is a stationary group waiting for a train, on the right there is another group that has just stepped out of another train and is heading towards the exit. The detection of the pedestrian groups is based on the transience of edges. In a time interval, the transience of edges, and their repetition, determines the degree to which neighborhoods remain the same. Intra-group edges present a relative stability. Instead, inter-group edges, depicted in red in the figure, are characterized by a short-living nature. By filtering out these edges, it is possible to detect the two connected components representing the two groups. Fig. 1c presents a scenario at a music festival. This type of event is usually attended by groups of socially related individuals that tend to stick together during its course. Nonetheless, groups might occasionally split e.g. to reach the bar, the rest room, or due to the density in front of the stage. In the figure, we picture a moment where a crowd stands in front of a stage. The edges represent the current proximity between the individuals, and the thickness represents the accumulated time spent close to each other over the whole period. Edges representing past proximity have not been drawn.
Figure 2: Example of the dependency of the proximity graph on contextual information In fact, they are not valid to describe the current crowd texture, but are used to compute the accumulated time. The detection of social groups requires preserving only the edges that present a longlasting time interval when compared to the others. Each vertex is annotated with a group label it has been assigned to. Note that vertices that are far apart can still belong to the same group as some of its members might have currently and temporarily split.
The awareness of the context Up to this point, we have considered vertices corresponding only to individuals. However, the proximity graph can be extended to represent other types of objects as well, e.g. a door, an ATM, or a food stand. This type of extension allows for a semantic and contextual interpretation of the observed behavior. In fact, different interpretations can be applied to the same crowd texture, depending on the context where the observation took place. Fig. 2 presents an example of how the same proximity graph can be interpreted differently. Knowing it was collected in front of an ATM, the left-most graph can be interpreted as a queue. Instead, the same graph can represent an orchestra, knowing that the context was a stage (in this case the rightmost vertex in the graph corresponds to the conductor while the other vertices correspond to the musicians). Location awareness allows for the disambiguation of the meaning a proximity graph can assume. The concept of awareness can be generalized through annotations. An annotation to a vertex 4
is a key-value pair that describes a specific property of the object represented by that vertex, e.g. gender, age, exit number, gate capacity, GPS coordinate, staff role, etc. Annotations contribute to awareness as they allow to picture more precisely the observed texture and support informed decision-making. For example, through an annotated graph it is possible to recognize at what specific exit a congestion has formed, if children are involved, or whether stewards are already around the area for support. Also, static vertices with GPS coordinates annotations can act as absolute positioning reference points when necessary. A consequence of the relative nature of the proximity graph is that movement cannot be attributed to vertices. An edge “breaks” when at least one of the two individuals involved in the relationship moves away. As the result of these actions is the same, determining which one occurred is not possible. Going back to the platform example in Fig. 1b, recognizing the short-living edges, depicted in red, allows for the detection of relative movement between the two groups. Again, it is not possible to determine for each group whether it is moving or not. Extending the graph with static vertices spread along the platform provides a solution to the problem. In fact, the vertices belonging to the moving groups would create short-living edges with these static vertices allowing inference of movement. The temporal information encoded in the proximity graph allows for more than the description of crowd dynamics. As proximity can be a byproduct of social interaction, socially related individuals tend to spend more time close to each other than strangers. This principle is at the basis of the example depicted in Fig. 1c. For example, in [8] the authors were able to analyze the social ties within organizations by looking at low-frequency proximity information. In general, knowing how much time two or more individuals have spent close to each other, with possible addition of contextual information about location, enables the inference of the type of social relation incurring between them. Temporal information also enables the inference of consequentiality. Imagine the festival scenario depicted in Fig. 1c. Suppose we observe individual A conversing first with B and later with C. If, later on, we would note A, B and C conversing together, we could imagine that B and C were introduced by
Figure 3: Experimental device used for capturing the proximity graph A. In the same way, we could predict that an individual who was observed in proximity to a counter, where tickets for drinks are sold, will eventually show up at the bar. Similarly, the temporal dimension of face-to-face interactions has also been investigated to study the spreading patterns of epidemic diseases in different types of social events, e.g. a conference or a museum [5].
An Instrument We identify the following requirements for an instrument to measure and analyze the proximity graphs presented thus far. (1) It is composed of a device that is wearable by an individual, and (2) that is detectable, within a chosen distance range, to measure proximity. (3) The information measured by the devices is extracted and collected through an infrastructure. (4) The collected proximity graph is analyzed by a processing system looking for patterns, and (5) feedback is transmitted from the system to the individuals. One notable way to implement our sensing device is an application running on a mobile phone. Mobile phones are widely diffused across the population, and already ship with both high computing power, e.g. dual-core processors, and a broad range of sensors, e.g. accelerometers, microphones, cameras etc. On the other hand, with the decrease in price and size of wearable technology, another way 5
of implementing our device is through a smart chipcard, such as those currently used for public transport tickets or for badges on the working places (the same technology can be easily integrated into a festival bracelet as well). Fig. 3 shows the device we currently use for our experiments with the proximity graph. We return to its description shortly.
guarantee higher scalability. Typically, such networks make use of special devices, usually called sinks, that receive data from on-body devices to subsequently store that data at a central repository. Sinks are spread around the event location to achieve high coverage. The on-body devices can reach the sinks by using a high transmission range, or through dissemination protocols, e.g. gossiping and routing. The sinks bridge the ad hoc wireless network with the network where the central repository and the processing systems are situated. The central repository and the processing system can be deployed to one or multiple servers at the event location or in a cloud service. We connect the devices through an ad hoc wireless network, as it matches the given constraints while enabling both the transmission of detection messages and the exchange of information between the devices. Also, it allows for the communication with the external network for processing and feedback. While data streams from the devices to the central repository, the global view of the proximity graph gets constantly updated. Periodically, the processing system analyses the proximity graph, examining the crowd texture for known patterns. Recognition of crowd dynamics is a classification problem that requires statistical analysis of the metrics of the graph, either at vertex, group, or global level. The temporal information in the proximity graph is exploited by analyzing snapshots, defined by time intervals whose duration depends on the analysis being performed. Graph algorithms are potentially computationally expensive, introducing additional latency between the measurement and the recognition of patterns. This requires a system with sufficient computational power to analyze a proximity graph within the required time constraints. Once the information is extracted from the proximity graph, it can be presented for feedback. The feedback can be sent to the crowd managers or directly to the crowd, either through the devices or through fixed infrastructure, e.g. screens, speakers, etc. While feedback can reach the control room and the infrastructure over the reliable network, devices can be reached via the ad hoc wireless network. In the same way information is extracted and collected from the devices, dissemination protocols allow feedback to reach specific individuals,
Sensing technologies As far as detectability is concerned, multiple technologies have been investigated in the past. Infrared, ultrasound and radio-frequency sensors, e.g. RFIDs and Bluetooth, have been utilized to track face-to-face interactions and co-location. The general approach to detection requires the assignment of a unique identifier to each device. The ID is periodically transmitted to nearby devices over the communication medium, and the reception of such a message constitutes a detection. Various aspects influence the functionality of proximity detection, and determine the vertices’ neighborhoods. The range, direction, and angle of the transmission cone bias the type of interaction being recorded. For example, face-to-face interaction is tracked through a transmission range within about 2 and 4 meters, a frontal direction, and a narrow cone of about 20 degrees, e.g. via an infrared sensor. Conversely, co-location is measured through long-range omnidirectional transmission, e.g. via Bluetooth. The theory of Proxemics guides the choice of transmission range depending on type of social behavior that one wants to measure. Measuring a crowd texture poses a set of constraints to the detection strategy: omnidirectionality to maximize the recall of nearby devices, short-range transmission to detect only close-by devices, and high-frequency to grasp instantaneous changes to the texture.
System architecture As neighborhood information needs to be extracted and collected from the devices, they need to be connected to a network that allows them to reach a central repository. The mobility and the high density, which characterize a crowded environment, make centralized networks, such as cellular networks and WiFi, unsuitable for this utilization. In contrast, decentralized ad hoc wireless networks provide the flexibility to design problem-specific protocols that 6
(a) Centralized processing chain
(b) Decentralized processing chain
Figure 4: Block diagrams for the processing chain groups or the whole crowd. The intervention strat- centric local view of the graph. Following this apegy defines the information, the destinations, and proach, nearby devices can exchange their neighthe techniques used to give feedback to the crowd. borhoods right after the measurement step, and analyze their local view of the graph autonomously, without relying on a global view of the graph conA processing chain tained in the central repository. This autonomy deWe present now a processing chain that incorpo- creases the interval between the moment the state rates all the components presented above into a of the crowd is measured, and the moment feedback loop. The processing loop is presented in Fig. 4a. can be generated. This alternative is presented in Each individual wears a device with a proximity Fig. 4b. However, a third possibility is available: a sensor capable of detecting the other devices within hybrid system where the devices locally aggregate a chosen distance range. The devices share a com- and process proximity information, and only these munication medium that enables transfer of infor- aggregated views are later collected and processed mation. The loop starts with the measurement of centrally. This latter approach provides both dethe individual’s neighborhood through the device’s creased latency in feedback generation and central sensor. Once the neighborhoods are measured, the monitoring of the crowd. Moreover , it minimizes next step consists in the collection of the neighbor- the overhead of data extraction from the devices, hoods from the devices to a central repository, to as only aggregated information is transmitted. compose the global view of the proximity graph. Afterwards, the proximity graph can be analyzed by a processing system to recognize crowd dynam- Real-World Experiment ics. Possibly, feedback is computed, and sent to the managers or to the crowd. At this point, the new To give a flavour of what can be achieved following state of the crowd can be measured and the loop our approach, in this section we describe an examcan start again. ple application based on a real-world experiment we Fig. 5 shows a possible future instantiation. Peo- conducted at an ICT conference. The conference ple at a train station are assumed to have proximity was divided into 7 tracks, each focusing on a spesensors, for example, embedded into their smart- cific ICT topic, such as High-Performance Computphones, allowing for the detection of a proximity ing, Software Engineering, Security, etc. Of the 250 graph. The analysis of the situation in the train attending individuals, 139 were wearing one of our and on the platform may be used to subsequently devices as a name tag throughout the whole day. inform people where to board, or to leave the train. We asked each of the participants for their main Note that centralization is not strictly necessary track of interest, as a hint to community memberto the instrument. As individual behavior depends ship (note that the groups were not balanced, as for on local context represented by the individuals and example one had only four individuals participatthe objects in close proximity, the analysis algo- ing in the experiment). Table 1 shows the distriburithm can often be expressed based on a vertex- tion of the participants across the tracks. The de7
Figure 5: How to sense and use the texture of a crowd at a train station. The density inside the train and on the platform is used to guide the individuals towards the less crowded coaches. vice, depicted in Fig, 3, has an Atmel ATXMega128 CPU with 8k of RAM, 128k of flash memory, and a Nordic nRF24L01+ wireless radio. To communicate, the devices create an ad hoc wireless network through an energy-efficient MAC protocol designed for mobile social networks [9]. Through this network, every second each device transmits its ID to the devices nearby, within some 2-3 meters of distance, allowing for its detection.
second, hence comprising only short-range detections. We captured these long-range transmissions through the “sinks” we installed in the main hall of the event location. We used this data to visualize at the event the evolution of the proximity graphs in real time. Long-range transmissions were not used to detect proximity.
Although we recorded proximity information during the whole conference, we concentrate here The devices log detections on the on-board stor- on the two hours between 12:00 and 14:00, when age unit along with their timestamps. At the end the poster session and the lunch break took place. of the event we downloaded these logs from the de- During this time, all the participants gathered in vices for offline analyses. The devices were also the main hall. Our goal was to investigate to what broadcasting a second type of transmission. Be- extent during this time the participants stayed close tween two short-range transmissions, a long-range to people they share interests with, as indicated by transmission was broadcast up to about 20 me- their main track of interest. To perform this analters. This second broadcast contained the list of ysis, we aggregated the series of proximity-graph IDs received by each device during the previous snapshots into a single undirected static graph, for 8
Participants In LCC Correct Detections
Track 1
Track 2
Track 3
Track 4
Track 5
Track 6
Track 7
27 15 0.53
9 7 1.0
19 13 0.62
4 3 0.0
26 20 0.74
10 4 0.0
27 22 0.77
Table 1: Sample statistics and results of the analysis. Additional 17 participants were part of the organization and were not labelled with one of the main tracks. which we decided to join two vertices by an edge if the two corresponding individuals had been in physical proximity for at least 600 seconds during the two hours. Each edge has a weight that accounts for the total number of seconds the two individuals have spent in physical proximity. On the largest connected component (LCC) of this graph, we ran a state-of-the-art community-detection algorithm [10].
The unreliability of the wireless communication and of the devices causes misdetections, meaning that detections are missed or erroneously added. Typical examples of these causes are “collisions,” interferences of other sources of radio-frequencies (such as WiFi spots), the shielding of the human body, data corruption due to faults in the device, etc. For this reason, to extract the proximity graphs used in our analysis we pre-processed the logs with a density-based clustering algorithm. The algorithms exploits the “bursty” nature of the collected data to reconstruct part of the missed detections and filter out noise. Our simulations show that this filtering phase greatly increases the sensitivity of the instrument [11].
The analysis we performed is analogous to the detection of social groups presented earlier. The community-detection algorithm assigns vertices to communities trying to maximize modularity. Graphs with high modularity tend to have dense connections between vertices within communities and sparse connections between vertices across different communities. Intuitively, it groups together vertices that are interconnected and have spent long time together. Fig. 6 shows the results of the analysis. Vertices are colored according to the community they have been assigned to by the algorithm, and labelled according to the main topic of interest. The clustering tends to assign vertices with the same label to the same community, supporting our hypothesis and showing the validity of the data extracted through the instrument. Note that the algorithm does not make use of the noted information about interests, but only of the topology of the graph. One should not consider the main track of interest as ground truth. In fact, many of the individuals indicated their interest as one of out of more possible ones. Moreover, as the participants came from a number of universities and departments, they tended to socialize also according to different criteria, for example, with people with whom they shared affiliation. Finally, the nature of poster sessions and banquets stimulate people to spend time in proximity to people belonging to different communities. We leave a deeper and more sophisticated analysis of the experiment for future work.
Discussion The local nature of individual behavior in crowds also affects the analysis of crowd dynamics through other modalities. In [3], the authors propose a processing chain for the recognition of crowd behavior from mobile sensors with pattern analysis and graph clustering. Subjects wear on-body sensors, and move collectively. Activity patterns are then extracted from the sensors for individual behavior recognition, e.g. from accelerometer data. Afterwards, a pairwise correlation of this information between each pair of individuals is computed, forming what they call a disparity matrix. Finally, this information is transformed into a graph by performing multidimensional scaling. In the obtained graph, each vertex corresponds to a subject. The neighboring nodes have similar behavioral characteristics, and are thus more likely to participate in the same dynamics. By performing a graph clustering algorithm, they are able to predict that the subjects corresponding to the vertices belonging to the same cluster participated in the same group. By exploiting the information contained in the proximity 9
Figure 6: Community detection at an ICT conference. Colors indicate the detected communities, labels indicate the main topic of interest of the individuals, edge thickness indicates the total amount of time the individuals have spent in physical proximity. The vertices have been positioned through a spring-embedding algorithm. The algorithm takes into account only the topology of the graph, hence the layout is not related to location information within the main hall. We have labelled each community with the label that appears most frequent in it, and the value expresses the percentage of vertices with that label appearing in their community. graph, only the behavioral data between neighboring vertices could be compared, reducing the cost of an expensive step of the processing chain. The proximity graph is a representation of the crowd texture that can be used either to directly recognize crowd dynamics, or to support recognition through other modalities. The mutual influence between individuals is an interesting aspect of social behavior, as it can be used to guide a crowd by targeting a subset of the individuals through feedback information about the current state. Although during the last few years, we are starting to better understand crowd dynamics, less is known about how to influence a crowd. The proximity graph is a representation of a crowd and it allows to compute interventions towards a desired behavior. Consider the following (admit10
tedly still speculative) examples of simple interventions on crowds as presented previously in their scenarios. The example in Fig. 1a could represent a bottleneck at the entrance of a stadium. This is a typical situation where people get pushed, and in the most dramatic conditions also walked over. This behavior often finds its origins in the absence of information. The individuals at the back of the crowd cannot see the high density at the entrance, or the presence of a congestion, and may start to push. A screen on top of the gate, visible for all the individuals, could depict with colors the density in the front. The example in Fig. 1b could represent a platform in a train station. A common situation in such a scenario is that people getting out of the train tend to head towards the closest exit. Uneven usage of exits could be avoided by feeding back information about less crowded exits. Finally, the example in Fig. 1c could represent groups of visitors to a festival. Such events are usually visited by groups of friends. It is common that people lose contact with some members of their group. Once the groups are detected, each member of the same group can be guided towards the same exit, so that they can find each other there. These are just a few examples of the many possibilities that emerge once the texture of a crowd is captured in a proximity graph. Our approach has great potential to accelerate the emerging field of Computational Social Science. In particular, the capability of sensing the crowd from within, without any requirement for location information or centralization, in respect of the privacy of the individuals in the crowd. Moreover, it allows to compute timely insights about the state of the crowd, and communicate feedback to ensure safety and comfort.
References [1] D. Lazer, A. Pentland, L. Adamic, S. Aral, A. L. Barabasi, D. Brewer, N. Christakis, N. Contractor, J. Fowler, M. Gutmann, T. Jebara, G. King, M. Macy, D. Roy, and M. Van Alstyne. Social science: Computational social science. Science, 323(5915):721–723, February 2009. [2] T. Choudhury and A. Pentland. Sensing and modeling human networks using the sociometer. In Proceedings of the 7th IEEE International Symposium on Wearable
Computers, ISWC ’03, pages 216–. IEEE Computer Society, 2003. [3] D. Roggen, M. Wirz, D. Helbing, and G. Tr¨ oster. Recognition of crowd behavior from mobile sensors with pattern analysis and graph clustering methods. Networks and Heterogeneous Media, 2011. [4] J. R. G. Dyer, A. Johansson, D. Helbing, I. D. Couzin, and J. Krause. Leadership, consensus decision making and collective behaviour in humans. Philosophical Transactions of the Royal Society B: Biological Sciences, 364(1518):781–789, March 2009. [5] L. Isella, J. Stehl´ e, A. Barrat, C. Cattuto, J. F. Pinton, and W. Van den Broeck. What’s in a crowd? analysis of face-to-face behavioral networks. CoRR, abs/1006.1260, 2010. [6] D. Helbing and A. Johansson. Pedestrian, crowd and evacuation dynamics. In R. A. Meyers, editor, Encyclopedia of Complexity and Systems Science, pages 6476– 6495. Springer, 2009. [7] C. W. Reynolds. Flocks, herds and schools: A distributed behavioral model. SIGGRAPH Comput. Graph., 21(4):25–34, August 1987. [8] D. Olgu´ın, B. N. Waber, T. Kim, A. Mohan, K. Ara, and A. Pentland. Sensible organizations: Technology and methodology for automatically measuring organizational behavior. IEEE TRANSACTIONS ON SYSTEMS, MAN, AND CYBERNETICS-PART B: CYBERNETICS, pages 43–55, 2009. [9] Matthew Dobson, Spyros Voulgaris, and Maarten van Steen. Merging ultra-low duty cycle networks. In Proceedings of the 2011 IEEE/IFIP 41st International Conference on Dependable Systems&Networks, DSN ’11, pages 538–549, Washington, DC, USA, 2011. IEEE Computer Society. [10] J. Reichardt and S. Bornholdt. Statistical mechanics of community detection. Phys Rev E Stat Nonlin Soft Matter Phys, 74(1 Pt 2), July 2006. [11] Claudio Martella, Matthew Dobson, Aart van Halteren, and Maarten van Steen. From Proximity Sensing to Spatio-Temporal Social Graphs. Technical Report EWiDS-WP3-130410-01, VU University Amsterdam, April 2013.
11