OF SPOKEN DIALOGUE SYSTEMS: THE MIT EXPERIENCE1. James Glass, Joseph ... Laboratory for Computer Science. Massachusetts Institute of ... be interpreted on a per- utterance basis, but which are measured over the course of a di-.
DATA COLLECTION AND PERFORMANCE EVALUATION OF SPOKEN DIALOGUE SYSTEMS: THE MIT EXPERIENCE1 James Glass, Joseph Polifroni, Stephanie Seneff, and Victor Zue Spoken Language Systems Group Laboratory for Computer Science Massachusetts Institute of Technology Cambridge, Massachusetts 02139, USA ABSTRACT In this paper we report our efforts in data collection and performance evaluation in support of spoken dialogue system development. We describe two understanding metrics called query density and concept efficiency which can be interpreted on a perutterance basis, but which are measured over the course of a dialogue. We also describe the evaluation infrastructure we have developed to support off-line data processing using our GALAXY client-server architecture [8]. We show how we have used these metrics and mechanisms as part of the development of a spoken dialogue system for air-travel information.
1.
INTRODUCTION
Although perhaps not as glamorous as the human language technology components they support, effective data collection and performance evaluation methods play an important role in the successful development of any spoken dialogue system. Just as researchers have observed that there is no data like more data, it is a certainty that there is no data like that which matches the acoustic and linguistic conditions under which a system will be ultimately deployed. Similarly, effective evaluation metrics can pinpoint weak or missing technologies, and can not only evaluate individual components or utterances, but can measure the overall system-level performance within the larger context of a complete user dialogue. In this paper we report on our recent experiences in data collection and performance evaluation in the context of developing spoken dialogue systems. For just over three years, our group at MIT has been deploying mixed-initiative spoken dialogue systems on toll-free telephone numbers in North America. Our motivation was to perform a wider-scale data collection than we were able to do within our laboratory environment. In this regard we have been quite successful: our JUPITER weather information domain received 570,000 queries from 87,000 calls in a three-year period since it was first made available [10]. These data have been invaluable in improving the performance of our speech recognition and understanding components. They have also helped highlight important research areas we had neglected such as confidence scoring [3, 5] and robust performance on non-native speakers [4]. Just as our data collection methodology has evolved, so have our means for analyzing system-level performance. Specifically, we have developed the infrastructure to evaluate the impact of 1 This research was supported by DARPA under contract N66001-99-1-8904, monitored through Naval Command, Control, and Ocean Surveillance Center.
system modifications on previously collected dialogues, while maintaining the correct discourse context at all times. We have moved beyond keyword or concept understanding error rates of individual utterances, to measuring performance at the overall dialogue level. To do this, we have created two new measures which can quantify how effectively a user can provide novel information to a system, and how efficiently the system can understand information concepts from a user. The query density measures the mean number of new concepts introduced per user query, while the concept efficiency tabulates the average number of turns it took for a concept to be successfully understood. In addition to being useful for quantifying longitudinal improvements in a particular system, we also believe these measures may be useful for comparing different mixed-initiative systems. In the following sections we first briefly describe our data collection experiences. This is followed by some details of the evaluation metrics we have developed, the infrastructure we have created for off-line performance evaluations, and some experimental results for our recent MERCURY air-travel domain.
2.
DATA COLLECTION
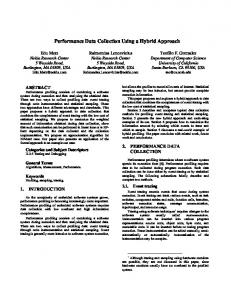
Developing conversational interfaces is a classic chicken and egg problem. In order to develop the system capabilities, one needs to have a large corpus of data for system development, training and evaluation. In order to collect data that reflect actual usage, one needs to have a system that users can speak to. Figure 1 illustrates a typical cycle of system development. For a new domain or language, one must first develop some limited natural language capabilities, thus enabling an “experimenter-in-the-loop,” or wizard-of-oz, data collection paradigm, in which an experimenter types the spoken sentences to the system, after removing spontaneous speech artifacts. This process has the advantage of eliminating potential recognition errors. The resulting data are then used for the development and training of the speech recognition and natural language components. As these components begin to mature, it becomes feasible to collect more data using the “system-in-the-loop,” or wizardless, paradigm, which is both more realistic and more cost effective. Performance evaluation using newly collected data will facilitate system refinement. The means and scale of data collection for system development and evaluation have evolved considerably over the last decade. At MIT, for example, the VOYAGER urban navigation system was developed in 1989 by recruiting 100 subjects to come to our laboratory and ask a series of questions to a wizard-based system [1]. In contrast, with the data collected for JUPITER [10],
Limited NL Capabilities Speech Recognition Data Collection (Wizard)
Data Collection (Wizardless ) Expanded NL Capabilities Performance Evaluation
System Refinement
Figure 1: Illustration of data collection procedures.
there are large differences in the number of queries, the number of users, and the range of issues which the data provide. By using a system-in-the-loop form of data collection, system development and evaluation become iterative procedures, and there is a much better match between training and testing conditions. Before we made the JUPITER system publicly accessible through a toll-free number, the word error rate (WER) was about 10% for laboratory collected data. During the first week of public data collection however, the WER tripled. As more data were collected, we were able to build better lexical, language, and acoustic models. As a result, the WER continued to decrease over time. This negative correlation suggests that making the system available to real users is a crucial aspect of system development. One may rightfully argue that only commercially deployed systems capable of providing robust and scalable solutions can truly be considered real. To be sure, a laboratory prototype is quite different from a commercially deployed system. Nevertheless, we believe a research strategy that incorporates as much realism as possible early into the system’s research and development life cycle is far more preferable to one that attempts to develop the underlying technologies in a concocted scenario. At the very least, a research prototype capable of providing real and useful information, made available to a wide range of users, offers a valuable mechanism for collecting data that will benefit the development of both types of systems.
3.
EVALUATION METRICS
One of the issues which faces developers of spoken dialogue systems is selecting evaluation metrics to quantify performance improvements. Most of the metrics we have explored have focused on speech recognition and understanding, since these tend to be more amenable to automatic evaluation methods where it is possible to decide what a correct answer is. Language generation and speech synthesis analyses tend to be more subjective.
3.1.
Utterance-Based Metrics
The simplest understanding metrics have tended to focus around individual utterances. WER and sentence error rate (SER) are
relatively easy to compute, although several phenomena can complicate an automatic evaluation (e.g., cross talk, mumbling, partial words). Natural language understanding evaluation can also be performed by comparing some form of meaning representation with a reference. Although it has been difficult to establish wide-scale agreement in the underlying semantic representation, we, as do others, measure a form of concept error rate (CER) based on domain-dependent key-words. For our work, CER is computed on a set of keyword-value pairs that are automatically generated for each utterance with a parsable orthographic transcription. The keyword-value pairs form a kind of “E-form” which captures the salient semantic concepts in an utterance using the format KEYWORD: VALUE [6]. For example, the utterance, “Will it rain tomorrow in Boston” would be paraphrased into the string “ TOPIC: rain; DATE: tomorrow; CITY: Boston” for evaluation. The recognition hypothesis “Will it rain tomorrow in Austin” would produce a similar paraphrase, with one substitution, on the CITY key. The keyword-value pairs in the E-form are generated automatically by our language generation component using a special template for this purpose. The CER is analogous to WER and is computed by summing concept insertions, deletions, and substitutions, and dividing that number by the total number of concepts generated from the parsed utterances. An utterance is considered to be completely understood if all the keyword-value pairs between the hypothesis and reference agree. This is measured by the understanding error rate (UER), which is analogous to SER.
3.2.
Dialogue-Based Metrics
The CER and UER metrics are applied on a per-utterance basis, and do not evaluate the effectiveness of an overall dialogue. We do not currently use these metrics to evaluate our discourse component (e.g., resolve pronouns, expand fragments, etc). Instead, we rely on two other metrics to measure the collective performance of the recognition, understanding, discourse, and dialogue components. These metrics quantify how effectively a user can provide new information to a system (the “query density”), and how efficiently the system can absorb information from a user (“concept efficiency”). Query density, QD, measures the mean number of new concepts introduced per user query, QD
=
1 N
XN d
d i=1
N
u (i) ; q (i)
N
where Nd is the number of dialogues, Nq (i) is the total number of user queries in the ith dialogue, and Nu (i) is the number of unique concepts understood by the system in the ith dialogue. A concept in a dialogue is not counted in Nu if the system had already understood it from a previous utterance, and is only counted when it is correctly understood by the system. Thus, a concept that is never understood will not contribute to Nu . Concept efficiency, C E , quantifies the average number of turns (expressed as a reciprocal) necessary for each concept to be understood by the system, CE
=
XN d
Nu (i) ; d i=1 Nc (i)
1 N
where Nc (i) is the total number of concepts in the ith dialogue.
Reference
Hypothesis
A
A
A
A
�
State � A � A
Increment
c
N ;N
c
N
Table 1: Action table for incrementing counts for Nu , and Nc . Actions depend on whether concept A is present, or not present (A�) in the reference, hypothesis, or in the dialogue state representations. No actions are taken under other conditions.
A concept is counted whenever it was uttered by the user and was not already understood by the system. Since, Nc (i) � Nu (i), then 0 � C E � 1. To illustrate, consider a simple dialogue where a user says “I’d like to book a flight from Seattle to Chicago on December twenty seventh.” Given a mis-understanding of the date by the system, the user follows up with “I said December twenty seventh,” which was then correctly understood. In this example, there were two queries (Nq = 2), with three unique concepts (Nu = 3) involving a source, destination, and date, and a total of four concepts (Nc = 4), since the source and destination each took one turn to be understood correctly, but the date took two turns. Thus, the query density is 1.5, and the concept efficiency is 0.75. Table 1 displays the action table used for determining when to increment counts for Nu and Nc . These are based on monitoring concepts derived from the reference transcriptions. Increments only take place when an input concept, A, is not present (i.e., A�) in the internal dialogue state, meaning that it had not been previously understood by the system. When this condition occurs, Nc is incremented, to indicate that the user was trying to convey a concept to the system. If the concept is also understood by the system (i.e. the hypothesis representation also contains concept A), then Nu is also incremented. We believe the QD metric is useful for quantifying the behavior of individual dialogue systems, as well as for making crosssystem comparisons. The higher the density, the more effectively a user is able to communicate concepts to the system. Dialogues which prompt for specific concepts one-by-one may have lower QDs, as will those which contain more confirmations, or misrecognitions. The CE is also a useful diagnostic metric, as it is an indicator of recognition or understanding errors. The higher the efficiency, the fewer times a user had to repeat a concept.
4.
Language Language Generation Generation
u
EVALUATION INFRASTRUCTURE
The spoken dialogue systems we develop employ a client/server architecture we have developed called GALAXY, which is being used as part of the DARPA COMMUNICATOR program [8]. As illustrated in Figure 2, in this architecture a programmable hub routes traffic among various human language technology components. Since the interactions among the components can be quite complicated, we have tried to develop a mechanism to duplicate on-line behavior for both system development (e.g., new speech recognition or language understanding components) and off-line performance evaluation. This allows all components to interact in a consistent manner. As shown in Figure 2, we believe we have achieved this goal by developing two new servers: a “Batchmode” server and an “Evaluate” server.
Evaluate Evaluate
Batchmode Batchmode Server Server
Dialogue Dialogue Manager Manager
Hub
Database Database
Discourse Discourse Resolution Resolution
Speech Speech Recognition Recognition Language Language Understanding Understanding
Figure 2: A GALAXY COMMUNICATOR configuration showing the batchmode and evaluation servers for off-line performance evaluation.
The batchmode server is used to generate inputs to a system during off-line processing (as opposed to an on-line system, which would deploy an audio- and/or GUI-server instead). The batchmode server can be used to simulate the behavior of a system during actual data collection, or can be used in conjunction with the evaluation server to quantify the performance of pre-recorded data. The batchmode server can generate inputs from an existing log file (which was generated by the system at the time the interaction actually took place), or can directly process waveforms, orthographic transcriptions, word graphs, semantic frames, etc., and pass them to the appropriate server via the hub. The evaluation server is used to gather performance statistics for an off-line evaluation. The server can measure both word- and concept-level error rates, and can be used to measure the QD and CE metrics described in the previous section. To compute the QD and CE metrics, we reprocess a log file after the orthographic transcription has been provided for the user queries. As illustrated in Figure 3, both the recognizer hypothesis and the original orthography are run through the system utterance by utterance, with the discourse and dialogue states being maintained exclusively by the recognizer branch. If the database content remains unchanged from when the dialogue originally occurred, then system responses derived in this way would be identical to those originally produced by the system. However, all of our systems make use of continually updated, dynamic data sources. It is therefore virtually impossible to guarantee that the system responses which occur during a subsequent evaluation will be the same as the original ones. Thus, it is possible that dialogues could become incoherent during an evaluation. The only way to prevent this would be to freeze a version of the database used at the time, or store the answers retrieved during the dialogues. Another problem has to do with the use of time expressions in user queries. If the database is static, it is usually just a matter of resetting the reference date of the dialogue so that relative expressions (e.g., “tomorrow”) can be correctly understood. Where the data are dynamic, and time-sensitive (e.g., short-range weather forecasts, flight schedule and fare information) the solution is more complex. In the case of MERCURY for example
N-best List
Parse and Select
Discourse
Dialogue Management Received Eform
Log File
Context
Compare & Tabulate Intended Eform
Orthography
Parse
Discourse
Dialogue Management
Figure 3: A flow graph illustrating the procedure for synchronizing discourse context during an off-line log-file evaluation. (described in the next section), we shift all dates in the dialogue to make all references to time occur in the future.
5.
EXPERIMENTS
Given our successful experience with collecting JUPITER data via a toll-free phone line, we have recently deployed a flight information system, called MERCURY, which allows users to plan air travel worldwide. Like JUPITER, MERCURY tries to be less constraining than systems which take more control. To date, we have collected approximately 11,000 utterances from 1,000 telephone calls. For our experiments we evaluate a set of 44 calls made in a one week period in July 2000, containing 648 utterances. It is interesting to observe that these data average 5.3 words/utt, which is very similar to our measurement of 5.2 words/utt for JUPITER. These systems appear to elicit more words from users compared to others [11]. Table 2 provides a breakdown of MERCURY performance on the 44 sessions in our test set. The “All” condition reports results for the utterance-based and dialogue-based metrics we have described in this paper for all 648 utterances. We then subdivide these data into three categories. “Accepted” utterances were those in which the reference orthography and recognition hypothesis were both parsable by our understanding component. “No Hyp” utterances were the ones in which the recognition hypothesis failed to parse, while “No Ref” utterances were the cases where the reference orthography could not be parsed. CER and UER were not available for the “No Ref” condition because we could not automatically produce a set of reference concepts. QD and CE are only reported for the “All” condition because they are intended to quantify the dialogue as a whole. The WER on the accepted MERCURY utterances is similar to our performance in JUPITER [10]. The CER and overall UER are higher however, which we attribute to the fact that MERCURY is in its early development stages, and because the air-travel domain is inherently more challenging than weather, both in terms of number of concepts, and the complexity of the interaction. We plan to make QD and CE part of our regular evaluations.
6.
CONCLUSIONS AND FUTURE WORK
In this paper we have described our data collection and performance evaluation infrastructure in support of our spoken dialogue system development. We have described and reported results for query density and concept efficiency metrics, which quantify the behavior of a system over the course of a dialogue.
Condition All Accepted No Hyp. No Ref.
# Utts. 648 551 21 76
WER 21.5 12.7 47.9 48.9
CER 24.4 22.5 88.5 N/A
UER 42.3 N/A
QD 1.47 N/A N/A N/A
CE 0.92 N/A N/A N/A
Table 2: Evaluation results for a set of recent MERCURY data. Although the understanding metrics were evaluated on a single system, we believe they could be used to perform comparisons between different systems operating in the same domain. To do this, it would be necessary to define a common inventory of concepts, which we believe should be feasible for many domains. We believe that the concept efficiency metric should be related to user frustration. In order to show this, we will need to make use of evaluation frameworks such as PARADISE [9], which can correlate system measurements with user satisfaction, in order to better quantify these effects. In order to address this issue, we have begun to collect questionnaire data from users after they speak to our systems. We plan to expand our evaluation infrastructure to make use of these data in future evaluations. Acknowledgments This research has benefited from the contributions of many researchers in our group, including Scott Cyphers, Lee Hetherington, T.J. Hazen, and Nikko Str¨om.
7.
REFERENCES
1. J. Glass, G. Flammia, D. Goodine, M. Phillips, J. Polifroni, S. Sakai, S. Seneff, and V. Zue, “Multilingual Spoken-Language Understanding in the MIT Voyager System,” Speech Communication, 17, 1–18, 1995. 2. J. Glass, T. J. Hazen, and L. Hetherington, “Real-time telephonebased speech recognition in the JUPITER domain,” Proc. ICASSP, 61–64, Phoenix, 1999. 3. T. Hazen, T. Burianek, J. Polifroni, and S. Seneff, “Integrating recognition confidence scoring with language understanding and dialogue modeling,” these proceedings. 4. K. Livescu and J. Glass, “Lexical modeling of non-native speech for automatic speech recognition,” Proc. ICASSP, 1842–1845, Istanbul, 2000. 5. C. Pao, P. Schmid, and J. Glass, “Confidence scoring for speech understanding,” Proc. ICSLP, 815–818, Sydney, 1998. 6. J. Polifroni, S. Seneff, J. Glass, and T.J. Hazen, “Evaluation Methodology for a Telephone-based Conversational System,” Proc. LREC, 43–50, Granada, 1998. 7. J. Polifroni and S. Seneff, “G ALAXY- II as an architecture for spoken dialogue evaluation,” Proc. LREC, 725–730, Athens, 2000. 8. S. Seneff, E. Hurley, R. Lau, C. Pao, P. Schmid, and V. Zue, “G ALAXY- II: A reference architecture for conversational system development,” Proc. ICSLP, 931–934, Sydney, 1998. 9. M. Walker, D. Litman, C. Kamm, and A. Abella, “PARADISE: A General Framework for Evaluating Spoken Dialogue Agents,” Proc. ACL/EACL, 271–280, 1997. 10. V. Zue, S. Seneff, J. Glass, J. Polifroni, C. Pao, T. Hazen, and L. Hetherington, “J UPITER: A telephone-based conversational interface for weather information,” Proc. SAP, 88(1), 85–96, 2000. 11. V. Zue, and J. Glass, “Conversational Interfaces: Advances and Challenges,” to appear, IEEE Proceedings, 2000.