Performance Data Collection: Hybrid Approach Edu Metz, Raimondas Lencevicius Nokia Research Center 5 Wayside Road, Burlington, MA 01803, USA
[email protected] [email protected]
1.
Introduction
As the complexity of embedded software systems grows, performance profiling becomes more and more important. Performance profiling of embedded software systems requires data collection with low overhead and high information completeness. Performance profiling consists of monitoring a software system during execution and then analyzing the obtained data. There are two ways to collect profiling data: either event tracing through code instrumentation or statistical sampling. Event tracing may be more intrusive but allows the profiler to record all events of interest. Statistical sampling may be less intrusive to software system execution, but cannot provide complete execution information. Our position is that data collection on embedded software systems should be performed using a hybrid approach that combines the completeness of event tracing with the low cost of statistical sampling. The following sections expand this position.
2.
Performance Data Collection
Performance profiling determines where a software system spends its execution time. Performance profiling requires data collection during program execution. Such data collection can be done either by event tracing or by statistical sampling. Let us consider the implications of using these two methods.
2.1.
Event tracing
Event tracing records events that occur during system execution. Event tracing can track various events, such as task switches, component entries and exits, function calls, branches, software execution states, message communication, input/output, and resource usage. Tracing requires changes to the software system usually called instrumentation. Instrumentation can be inserted into various program representations: source code, object code, byte code, and executable code. Time
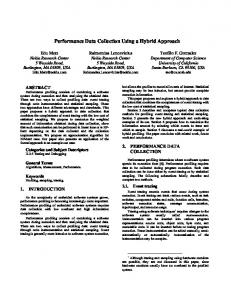
wise, it can be inserted before program execution or during it. Adding trace instrumentation can be done manually, semi-automatically or automatically. Automatization of the instrumentation may be complex. Full discussion on complexities of automatic vs. manual instrumentation goes beyond the scope of this paper. It is sufficient to say that the instrumentation may be a burden-some task, especially if some manual work is needed. Since an occurrence of any event creates a record, event tracing is characterized by the completeness of knowledge: if an event was recorded, it did occur; if it was not recorded, it did not occur. As we will see, this does not hold for statistical sampling. Performance engineers can also learn exactly when each event occurred since every record is time stamped. This allows a complete analysis of event relationships in time, for example, the measurement of precise time distance between any two events. A performance engineer using an event trace can reconstruct the dynamic behavior of a software system. For example, consider energy consumption by a mobile device [4]. To map the software execution to the power consumed, a performance engineer needs to know exactly when a peripheral is started and stopped. The information from event tracing directly maps software execution and power consumption (Figure 1 shows the measured power consumption as a function of time and peripheral device activations/deactivations mapped onto the same timeline). There are a number of difficulties in using event tracing. Users have to spend time instrumenting the software system. Event traces affect the performance of the software system distorting its execution [8]. Not only does event tracing take some time, adding traces changes the behavior of the software system because of additional memory accesses and input/output [6]. In real-time software systems, the instrumentation overhead can cause real-time constraint violations. Therefore, it is important to limit the intrusion by minimizing the instrumentation overhead [5]. One way to achieve this is by reducing the number of events traced. However, performance engineers have to choose carefully, since omitting events from tracing also
I (A)
reduces the amount of information available. For example, if only “on” and “off” events are traced in a peripheral, it is no longer possible to detect and map the peripheral’s different “on” modes to differences in the system’s power consumption. In choosing the instrumentation granularity it is important to address the trade-off between the amount of event information required and the performance impact of the trace instrumentation. This may be hard even for an experienced performance engineer.
t (s)
Device 1
Device 2
Device 3
Measured
Figure 1. Device activations mapped to power consumption For small routines, event tracing may not yield an accurate time comparison with larger routines. A small routine may suffer much higher relative overhead than a larger routine. If this is ignored, a great deal of effort may be wasted optimizing routines that are not real performance bottlenecks. The data volume associated with event tracing can be very large: more than megabyte per second traced. This can cause a problem in devices that do not have large and fast storage or external network interfaces.
2.2.
Statistical sampling
Statistical sampling relies on intermittent access to the software system to record its current state. Sampling can record various information: program counter (execution location), function call stack, scheduled or blocked tasks, active peripherals and so on. Sampling can be done strictly periodically or with certain randomness. The simplest forms of sampling do not require any software modifications. A sampler simply copies the content of some processor registers to memory. In more complex sampling, the software system may need to be interrupted to record the needed information. In both of these cases, a performance engineer would usually spend much less time to achieve sampling than to instrument the software system for tracing.
The overhead of sampling may be orders below the overhead of tracing. For example, branch tracing may require overheads of over a factor of 10, function tracing may require overheads up to a factor of 2, while sampling at up to thousand samples a second may have an overhead of less than 1% [1]. (This estimation assumes a 100Mhz processor and 1000 cycles of work per sample, which is enough to read the address of the currently executed instruction and save this information. Using symbol information generated at compile time, the profiler can later correlate the recorded sample with the source code.) At such frequencies, sampling produces much less data than event tracing—a positive in storagelimited devices. With advantages presented above, sampling is a perfect tool for gathering the performance data in systems where the low overhead is crucial. For example, sampling the execution of software in a mobile device executing real-time tasks may be the only way to obtain information about long-running functions without causing the software to miss real-time deadlines due to tracing overhead. However, sampling also has downsides. The sampling frequency determines the granularity of the gathered information. In addition, the duration for which the software system executes directly relates to the number of samples collected. A sampling profiler requires software systems to execute over a reasonable period of time to ensure accuracy [7]. The goals of a performance engineer may require high sampling frequency that negates the low overhead and small data production of sampling. Sampling yields only a statistical measure of the software’s execution patterns. It does not provide completely precise numbers: if an event does not occur in a sampling log, there is no guarantee that it did not occur in execution. Therefore sampling may not be useful for situations that need to track exact numbers of events, for example, a singleton message to a task or an exact relationship between requests and acknowledgements. In periodic real-time systems, the sampling interval needs to be randomized to avoid sampling the same periodic software entity at every sampling point. Sampling may not be able to detect frequently executed routines whose execution times are smaller than the sampling frequency. In addition, manual trace instrumentation usually tracks application-specific events that could be difficult to capture by sampling. For example, detecting a transition from a single-person voice call to a conference call may require event tracing. Sampling is not a good approach when event causality is analyzed. Although it may extract a function call stack at the sample time, it cannot track all function calls or message exchanges. A performance engineer
who needs a complete message sequence chart or component interaction graph might be better off choosing event tracing.
3.
Hybrid Data Collection
Let us summarize the previous section. Event tracing yields the most detailed and complete system execution data. However, it takes time to instrument software, tracing has a high overhead and may change the behavior of the software system [6]. Statistical sampling is simple to use and less intrusive to software system execution, but does not provide causality relationships and exact data. Embedded software systems, such as mobile devices, have real-time constraints and therefore require performance profiling methods with low overheads. On the other hand, performance analysis of such devices often involves causality relationships and precision requirements. For example, a performance engineer needs to know exactly when a task starts processing a message in a multiplayer game that changes the game environment, since this may point to the cause of performance bottleneck evidenced by numerous file accesses. Often neither event tracing nor statistical sampling can satisfy such conflicting requirements. The problem is further compounded by the fact that test runs are not entirely deterministic in mobile devices due to interactions with other systems such as mobile network elements. Therefore, performance data cannot be collected during multiple test runs, but instead needs to be collected during a single test run. To collect performance data of embedded software systems with low overhead and adequate completeness, we propose to use a middleweight approach which is a hybrid of heavyweight event tracing and lightweight statistical sampling. Only a subset of all events is traced, providing limited completeness and causality information. Additional information is obtained through sampling. To apply our method, a performance engineer has to determine which part of the performance data should be collected with event tracing and which with statistical sampling. The following subsections describe these choices using a couple of examples.
3.1.
Processor time profiling
When the goal of a performance engineer is to determine which software components and subsystems spend most time running on a processor, statistical sampling can provide most information. It can reveal the approximate amount of time spent in a component, such as a task, module or function. Event tracing can supplement this information in a couple of areas. First, it can precisely identify switches of very high level components, such as tasks. Second, it can demonstrate the
component execution causality by tracking message exchanges. For example, consider the synchronization between tasks A and B in Figure 2. After sending message m1, task A enters a wait state where it waits for a state synchronization callback m2 from task B before continuing its execution. Here, event tracing can record and timestamp the sending of messages m1 and m2, while sampling can provide more in depth performance data during time intervals [t1, t2], [t2, t3], [t3, t4]. Just sampling is not enough to provide the crucial synchronization information. t1
t2
t3
t4
t (s)
Task A
Task A m1
m2
Task B
Figure 2: Task state synchronization Profiling system interrupts requires event tracing as well. Even though the intrusion cost of tracing interrupts is high, sampling cannot be used here, because the execution times of interrupt handlers are much smaller than the sampling frequency.
3.2.
Resource usage and energy profiling
In mobile devices power consumption varies depending on the peripherals used. During the system execution, software accesses peripherals. These accesses need to be recorded to determine when a peripheral is used. In resource usage and energy profiling, complete information about active and inactive peripherals is required. Event tracing needs to be used to track state transitions of Bluetooth, GPS or infrared subsystems. The intrusion cost of recording “on” and “off” events of peripherals is low since they occur infrequently. Statistical sampling can complement event tracing by providing information that is too expensive to obtain using event tracing. For example, the processor power management puts the processor in a low power sleep mode when no software is scheduled to run. Unlike Bluetooth mode changes, the processor’s transition to the sleep state may be too frequent and too expensive to track via instrumentation. Statistical sampling can reveal the processor’s idle state with enough accuracy as long as the context switch time is an order of magnitude larger than the sampling frequency. Another opportunity for sampling is presented by devices with multiple active modes. As mentioned in section 2.1, the overhead of tracing every state transition of a peripheral may be too high. While tracing could
provide information about major “on” and “off” states, sampling could complement this information with infrequent samples of secondary states allowing more precise system mapping than achieved with just tracing.
3.3.
Hybrid approach discussion
The proposed hybrid approach for performance data acquisition in embedded software systems has the potential to limit the data collection overhead while providing partial completeness and causality. It is important to understand the requirements for performance data acquisition, which are domain and application specific. In different domains event tracing, statistical sampling, or our hybrid approach may provide the best solution. Our hybrid approach is sensitive to the choice of which performance data to collect using event tracing and which by statistical sampling. A couple of heuristics would be to trace infrequent events and nondeterministic events that provide causality information. However, further research is needed on how to make these choices. The hybrid approach also yields the following benefits: • Can provide useful profiling results in shorter execution runs than can be provided by pure statistical sampling. • Can be used to profile events that occur infrequently. • Limits the profiling data volume, which makes storing, transfer and post processing easier. Performance engineers are more likely to make use of profilers if they are easy to use. • Allows reconstructing the dynamic behavior of a software system. The proposed hybrid approach also has some limitations: • Unless engineered intelligently, our hybrid approach could still inherit the drawbacks of both event tracing and statistical sampling. • Trace instrumentation is still required, which may alter the behavior of the original software system. • It yields two separate sets of profiling data. These two sources of information need to be combined and synchronized during post-mortem analysis. Certain information could be reconstructed from statistical samples gathered during an execution. Events that deterministically precede events captured in a sample could be added to the performance data. This direction needs to be explored in future research.
4.
Related Work
Several tools exist for performance profiling of software systems. Many of these are sampling based profilers [1]. Some tools, such as Intel’s Vtune [9],
provide event tracing capabilities in addition to statistical sampling. However, the user cannot simultaneously use event tracing and statistical sampling during a single test run. Hollingsworth et all [2] developed a hybrid data collection approach that uses event tracing to record state transitions in counter and timer data structures. These structures are then sampled periodically to collect performance data. Our hybrid approach uses event tracing to record a subset of all events of interest. The remainder of events is recorded through statistical sampling.
5.
Conclusion
This paper describes a hybrid approach to the performance data collection. The hybrid approach involves striking a balance between event tracing and statistical sampling, combining the completeness of event tracing with low cost of statistical sampling. In addition, the proposed approach limits the profiling data volume. Useful profiling results can be obtained with relatively short execution runs. We have described the use of a hybrid data collection approach for software execution time and resource consumption analyses. We believe that such an approach should be incorporated in future profilers. It is likely that other dynamic analysis domains would also benefit from incorporating both complete and sampling based data collection.
6.
References
[1] J. Anderson , L. Berc, J. Dean, S. Ghemawat, M. Henzinger, S. Leung, R. Sites, M. Vandevoorde, C. Waldspurger, W. Weihl, Continuous Profiling: Where Have All the Cycles Gone?, Proceedings of the 16th ACM Symposium on Operating Systems Principles, 1997 [2] M. Arnold, B. Ryder, A Framework for Reducing the Cost of Instrumented Code, Proceedings of the Conference on Programming Language Design and Implementation (PLDI), 2001, pp. 168-179. [3] J. Hollingsworth, B. Miller, J. Cargille, Dynamic Program Instrumentation for Scalable Performance Tools, Proceedings of the Scalable High Performance Computing Conference, 1994 [4] R. Lencevicius, E. Metz, A. Ran; Software Validation using Power Profiles, Proceedings of the 20th IASTED International Conference on Applied Informatics (AI 2002), Feb 2002. [5] E. Metz, R. Lencevicius, Efficient Instrumentation for Performance Profiling, Proceedings of the 1st Workshop on Dynamic Analysis, 2003, pp. 143–148.
[6] D. Stewart, Measuring Execution Time and Real-Time Performance, Embedded Systems Conference (ESC), 2001. [7] K. Subramaniam, M. Thazhuthaveetil, Effectiveness of Sampling Based Software Profilers, 1st International Conference on Reliability and Quality Assurance, 1994, pp. 1–5. [8] J. Vetter, D. Reed, Managing Performance Analysis with Dynamic Statistical Projection Pursuit, Proceedings of the 1999 ACM/IEEE Conference on Supercomputing, 1999. [9] Vtune Performance Analyzer, March 2004. http://www.intel.com/software/products/vtune/