Institute of Physics Publishing doi:10.1088/1742-6596/16/1/070
Journal of Physics: Conference Series 16 (2005) 510–520 SciDAC 2005
Data management on the fusion computational pipeline 1
3
1, 2
1
5
2
S. Klasky , M. Beck , V. Bhat , E. Feibush , B. Ludäscher , M. Parashar , A. Shoshani4, D. Silver2, M. Vouk6 1
Plasma Physics Laboratory, Princeton University, NJ {sklasky,efeibush,vbhat}@pppl.gov 2 Electrical and Comp Engr. Rutgers University, NJ
[email protected] 3 Computer Science Dept, University of Tennessee, TN {atchley, mbeck}@cs.utk.edu 4 Lawrence Berkeley Laboratory, Berkeley, CA
[email protected] 5 Computer Science, U.C. Davis, CA
[email protected] 6 Computer Science, N.C. State, NC
[email protected]
Abstract. Fusion energy science, like other science areas in DOE, is becoming increasingly data intensive and network distributed. We discuss data management techniques that are essential for scientists making discoveries from their simulations and experiments, with special focus on the techniques and support that Fusion Simulation Project (FSP) scientists may need. However, the discussion applies to a broader audience since most of the fusion SciDAC’s, and FSP proposals include a strong data management component. Simulations on ultra scale computing platforms imply an ability to efficiently integrate and network heterogeneous components (computational, storage, networks, codes, etc.), and to move large amounts of data over large distances. We discuss the workflow categories needed to support such research as well as the automation and other aspects that can allow an FSP scientist to focus on the science and spend less time tending information technology.
1. Introduction From March 2004 – June 2004, the DOE held workshops, headed by Richard Mount, to discuss the ASCR/MICS strategic plan for data management [18]. By the end of the workshop it was clear that the data management requirements for several application domains were similar in at least three application areas: simulations (such as fusion and combustion and astrophysics), observation/experimental-driven applications (high-energy physics, fusion), and information-intensive applications (such as chemistry, biology, and nanoscience). This paper focuses on several data management issues that are necessary for our funded Fusion Simulation Project (FSP). It is important to note that the Office of Energy Science (OFES) has a strong data management program for current experiments. However, when this data management system was applied to a “real 3D ” simulation, it proved to be inadequate, not just in its speed, but also in its inflexibility to handle the needs of simulation scientists. The time is ripe for OFES to join in collaborative efforts with other DOE data management researchers and design a system, which will be scalable to a FSP and ultimately to the needs of ITER. Simulations are typically executed in batch mode, they are long running, and the computational resources they use are located at just a few supercomputing centers. To accelerate the discovery process for simulations, a new generation of comprehensive data management solutions will be required, which span all areas of data management and visualization. The Center for Plasma Edge Simulation is going to build a new integrated predictive plasma edge simulation framework. This framework will be applicable to existing magnetic fusion facilities and to next-generation burning plasma experiments such as ITER. The multi-scale nature of this problem occurs partly because the microturbulence and neoclassical physics time scale must be studied kinetically, using the XGC-ET code, while the faster and larger scale MHD modes are more efficiently studied using a fluid code, M3D [33]. These codes will be loosely coupled1, and therefore we must 1
Coupling can be defined in many ways. It can be synchronous and asynchronous. It also spans several orders of magnitude. For the purposes of this paper we can think of several categories a) microsecond coupling (e.g., tight computational coupling on shared memory and high-performance clusters), b) millisecond couplings (e.g., among internet distributed clients and computational nodes), c) seconds to minutes (synchronous and asynchronous analyses involving high end applications and human interactions), and d) hours to days (e.g., large volume of backup data or asynchronous interactions)
© 2005 IOP Publishing Ltd
510
511
focus on large data sets generated from these codes, and the transfer of this data to the collaborators in this project. This project is ambitious in both the physics and the enabling sciences. Over twenty scientists will be working on different aspects, and good data management techniques will be essential. The key feature of the data management techniques that we will use in the FSP is that they will be driven by the demands of the applications. It is crucial to devise a data management system that is easy for the physicists to use and easy to incorporate into their codes and workflows. In order for this project to be successful, scientific discovery must be accelerated by using leadership class computational solutions and state-of-the-art enabling technologies, e.g., those that reduce overhead of the information technology and provide automation of workflows. There are two major steps in our discovery system: 1. During the simulation stage where information must be immediately (often synchronously) processed and displayed to enable the user to control the simulation. 2. During the Validation and Verification stage where users will compare the data from this simulation to other simulations and/or experimental data. Below we describe the scientific investigation process commonly used by fusion simulation scientists to do their science. We then describe the core data management technologies that will be used in our Fusion Simulation Process. Finally, we will describe the challenges faced in this project. 2. The Scientific Investigation Process A fundamental goal of a simulation scientist is to analyze and understand information generated from a combination of simulation codes and empirical data, and have these processes lead to an increased understanding of the problem being simulated. One can describe the scientific investigation process in terms of seven conceptual stages. These same stages can be identified across a wide range of disciplines and provide a useful framework for identifying data management challenges [18]. Formulation of a hypothesis for explanation of this phenomenon (Idea Stage) leads to formulation of requirements for testing it in the Implementation Stage. Regression tests are developed to ensure that the modifications do not violate the prior developments. Changes need to be tracked and captured in metadata for accountability, backtracking and reproducibility. Implementation often intermixes with the Validation/Verification (V&V) Stage. V&V requires scientists to analyze and interpret results, e.g., through data transformations, data mining and visualization. This introduces the Interpretation Stage. During the Pre-production Stage scientists run parameter surveys and/or sensitivity analyses to define the regime of interest and/or define correct scaling. This stage is intermixed with the Interpretation Stage. These two stages combined often provide some insight into whether the hypothesis under investigation makes sense. Accumulation of bulk raw data happens in the Production Stage, when scientists run production experiments and simulations and perform massive observations. The data acquired during this phase is generally large and growing. Production and interpretation are intermixed as part of the original hypothesis testing. The Assimilation Stage is the final step of the scientific process. Results from all of previous steps are assimilated and reformulation of the original hypothesis may be needed. The final output is the dissemination of the knowledge through peerreviewed papers, presentations and, increasingly, publication of some portion of the data itself. The process can be captured in one or more workflows. We believe that a significant fraction of the scientists’ time is spent on interpretation of their data through data analysis and visualization. As the data grows, some steps may become prohibitively slow, especially if there is a technology overhead. The challenge is to develop appropriate analysis and visualization tools, and automate data acquisition and manipulation workflows, that increase total scientific productivity.
512
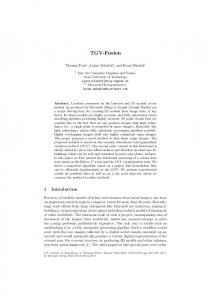
Figure 1. Illustration of FSP workflow 3. Adaptive and Automated Workflows The FSP is a sufficiently complex problem, that classic composition and manual execution of its workflows represents a serious overhead. Advanced workflow automation is needed. One of the proposed FSP workflows is illustrated in Figure 1. The top part of the diagram shows interactions among the simulation components running the XGC-ET and the M3D codes. These codes generate large volumes of data that are archived by the workflow agents. The bottom part shows analysis components that are invoked automatically by the workflow engine at specific time steps, and that feed into the Integrated Data Analysis and Visualization Environment (IDAVE) portal. Summaries of the monitored information and the dynamic analyses are also sent to a portal. This information is used by the scientists to track workflows progress over the Internet. We now discuss the requirements for the FSP workflow support framework. 3.1. Workflow Automation. Coupling scientific simulations in the manner envisioned in FSP requires coordination of several simulations, running on different distributed computing resources, and includes reliable movement of data between tightly-coupled components, but also over wide area networks. Also needed is the orchestration of intermediate analysis tasks and the automation of dynamic steering of the simulation. These requirements warrant a scientific workflow system that can setup, run, control, monitor, and track this process. Scientific workflows have unique requirements distinct from business workflows. Perhaps the most relevant for a FSP is the requirement to run tasks based on some step granularity, and to stream the data generated by these steps between components. This is essential for running time-stepped simulations. Other important requirements include triggering an action every so many steps (such as “checkpoints” that need to be transferred to another computer, archived, or analyzed), and triggering an alarm or automatically adjusting the parameters of a simulation based on dynamic analysis of data generated by time steps. It is also essential that the workflow system is flexible enough to allow the plug-in of existing components, such as simulation programs written by scientists, or specialized analysis components, in a standardized fashion. Finally, because real workflows can be quite complex it is essential that a scientific workflow system supports workflows that can be composed from other
513
(sub-) workflows. Since many scientific workflows run for a long time, another important requirement is to monitor and track the progress of the workflow, and to produce alarms if the progress is stalled or flawed. There are a number of general requirements for scientific workflows, [e.g., [26][27][24][23][22][19][20]. Some principal scientific workflow requirements include: • User Interface: Intuitive design, execution, and monitoring environment for end user • Re-use: Component reusability and exchangeability; in particular, ability to dynamically add new process nodes and data sets to a workflow (e.g., using “plug-ins” for Web services and data), or change existing ones • Data transforms: Extensive and flexible data format transformation support to mediate between consecutive processing steps and between the data sources and data sinks (a.k.a. workflow “shims” or adapters) • Interaction and Batch Modes: Support for user interaction (including process steering) during process execution. Ability to monitor an automated processes in real-time, to “background” it and retrieve results later, stop/resume options with long-term state memory, etc. • Streaming: Support for pipelined concurrent execution of fine & course-grained (loosely coupled) workflows • Location transparency: Support for both local and distributed computation and data access • Interoperability: Ability to incorporate (“wrap”) external applications, e.g. for data access, analysis, visualization, and to interoperate with other component-oriented frameworks and systems. • Workflow complexity: Ability to handle nested workflows, different computation models, data/control flow • Optimization: Ability to collect cost and performance data, and based on these, predict cost and performance of workflows execution plans. Plan efficiency depends on host resources, bandwidth, data transport mechanisms (e.g., SABUL, FastTCP, SRB, etc.) chosen for a particular workflow connection, etc. • Dependability and Scalability: Workflow engine and resources need to be reliable and scalable; so mechanisms for fault-tolerance, recoverability, and parallel execution of workflows are needed • Verification and Validation: Ability to verify and validate constructed workflows, imported workflows, and results obtained through an automated workflow There are several scientific workflow support systems today, many of them evolving [22][28][32][31]. The Scientific Data Management (SDM) Center has identified a framework called Ptolemy [9] that, with appropriate additions SDM and collaborating projects are developing, provides a robust and well suited environment for scientific workflows. In the resulting Kepler system [27], workflow components (legacy or new) are plugged in as “actors”. Simple actor pipelines and complex workflows (with nested subworkflows and loops) can be graphically defined. Workflow execution is orchestrated by one or more “directors”, defining appropriate execution models (process network, synchronous dataflow, discrete event, etc.) Specific actors have been developed for repetitive execution of steps, command-line initiation of tasks, file staging and file caching, large scale data movement, and notification. Notifications are triggered by conditions in the tasks, and perform an action, such posting a message to a website, sending an email, etc. The Kepler system has been successfully applied by the SDM Center staff to several applications in the fields of astrophysics, fusion, and computational biology and chemistry [BGS+05], and to ecoinformatics and geoinformatics applications by other projects contributing to Kepler [29][30]. For FSP workflows, we will extend Kepler, e.g. with actors for moving data specifically from large machines such as Seaborg (the IBM SP at NERSC) running XGC code to the cluster running the M3D code. While large data movement elements already exist as part of the Kepler/SPA library [26], FSP synchronization needs may require some customization. Similarly, FSP workflows require data archival to mass storage (e.g. HPSS). We may take advantage of the Storage Resource Management (SRM) technology available at the SDM center or reuse existing Kepler/SRB actors. Actors can also
514
be used to invoke software that analyzes intermediate results, e.g. to classify puncture plots or to invoke a monitoring and/or visualization component and display the results on a target system. 3.2. Interactive and Autonomic Control of Workflows and Simulations The scale, complexity and dynamic nature of the FSP coupled with similar scale and complexity of emerging parallel/distributed execution environments requires that these applications be accessed, monitored and controlled during execution. This is necessary to ensure correct and efficient execution of the simulations, as the choice of algorithms and parameters often depends on the current state/requirements of the application and the state of the system, which are not known a priori. For example, simulation component behaviors, their compositions and the simulation workflows can no longer be statically defined. Further, their performance characteristics can no longer be derived from a small synthetic run, as they depend on the state of the simulations and the underlying system. Algorithms that worked well at the beginning of the simulation may become suboptimal as the solution deviates from the space the algorithm was optimized for or as the execution context changes. This requirement presents a new set of deployment and runtime management challenges. We are investigating programming and runtime management solutions to support the development and deployment of applications (i.e., simulations elements, their interactions and the workflows) that can be externally monitored and interactively or autonomically controlled. Further, we are also investigating programming and runtime systems that can support efficient and scalable implementations of these autonomic simulations. This includes designing control networks to allow computational elements to be accessed and managed externally, both interactively and using automated policies, to support runtime monitoring, dynamic data injection and simulation control. This research is built on our current and prior research efforts and software projects including AutoMate/Accord[11][12], and Discover/DIOS [13]. 3.3. Collaborative Runtime Monitoring with Elvis Scientists desire to monitor a long running simulation in case they want to stop it before completion. Stopping an errant run conserves compute and human time. It is useful to monitor at any time and from several locations. Providing the information over the Internet facilitates frequent monitoring. A scientist can check a run from an Internet browser at work, home, or while traveling. Monitoring is typically performed on a laptop or desktop computer on an office or home network. A simulation can produce more data than can be monitored. In the FSP, the XGC code will compute profile data that is input to the M3D code. The data is produced incrementally as the XGC runs and represents the area and variables of interest. A subset of the total output is stored in a portal for monitoring. Several scientists at different locations will be interested in an Edge Dynamics run. Monitoring over the Internet makes the data instantly available to multiple locations. This enables a basic level of data sharing among users. The Elvis system [4], based on the Scivis system [7], provides more advanced collaboration by implementing a collaborative whiteboard so users can interactively annotate, highlight, and graphically explore the shared data. This improves collaboration and communication between remote users. Development has started to make Elvis available for Keplercontrolled workflows. 4. Efficient Data Access /Movement The key to the success of any workflow scheme is the ability to move data, so we will focus on data access/data transfer issues in some detail. The efficiency of data access is greatly affected by two factors: 1) the network path between the point of access (a storage resource or buffer) and the system to or from which the data is read or written, and 2) the ability to move data when it is available, rather than only at certain predefined points in a computation (most commonly at the beginning and end). We will describe two mechanisms which address these issues: 1) Logistical Networking, which provides a uniform and ubiquitous model of storage managed on servers known as “depots” that are located throughout the network, and 2) Data Streaming techniques that overlap data access and transfer with computation and that move data directly from the application to storage locations close to its ultimate destination [8].
515
4.1. Logistical Networking To achieve the kind of global deployment scalability some high-end applications require for data management, Logistical Networking (LN) uses a highly generic, best effort storage service, called the Internet Backplane Protocol (IBP). The design of IBP is shaped by analogy with the design of IP in order to produce a common storage service with similar characteristics. Though it has been implemented as an overlay on TCP/IP, it represents the foundational layer of the “network storage stack” [1]. Just as IP datagram service is a more abstract service based on link-layer packet delivery, so is IBP a more abstract service based on blocks of data (on disk, memory, tape or other media) that are managed as “byte arrays.” By masking the details of the local disk storage — fixed block size, different failure modes, local addressing schemes — this byte array abstraction allows a uniform IBP model to be applied to storage resources generally. The use of IP networking to access IBP storage resources creates a globally accessible storage service. As the case of IP shows, however, in order to scale globally the service guarantees that IBP offers must be weakened, i.e. it must present a “best effort” storage service. First and Applications foremost, this means that, by default, IBP storage allocations are time limited. Logistical File System When the lease on an IBP allocation expires, the storage resource can be reused and all data structures associated with it can be deleted. Additionally Logistical Tools an IBP allocation can be refused by a storage resource in response to overL-BONE exNode allocation, much as routers can drop packets; such “admission decisions” can IBP be based on both size and duration. Forcing time limits puts transience into Local Access storage allocation, giving it some of the fluidity of datagram delivery. More importantly, it makes network storage far more sharable, and therefore easier Physical Access to scale up. The semantics of IBP storage allocation also assume that an IBP storage resource can be transiently unavailable. Since the user of remote storage resources depends on so many uncontrolled, remote variables, it may be necessary to assume that storage can be permanently lost. In all cases such weak semantics mean that the level of service must be characterized statistically. 4.2. PPPL Data Streaming Interactive data analysis/remote visualization has been studied over a long period of time. Wide area networks, however, exhibit high latencies and widely varying throughput, which hampers remote analysis and visualization as well as overall scientific throughput. These latencies and varying throughput make interactive visualization impractical because reading and displaying the data can take tens of seconds to several minutes for every frame. Also, for high performance simulation components, analysis and visualization routines normally require a lower order of processors (M) compared to the actual simulation runs (N where M