Jan 16, 2015 - Email addresses: fedor.chernogorov[at]magister.fi, fedor.chernogorov[at]jyu.fi (Fedor. Chernogorov) ... campaign with conventional drive tests. ... One of the first attempts to automate the problem of sleeping cell detection has.
Data Mining Approach to Detection of Random Access Sleeping Cell Failures in Cellular Mobile Networks Fedor Chernogorova,b,∗, Sergey Chernovb , Kimmo Brigattib , Tapani Ristaniemib
arXiv:1501.03935v1 [cs.NI] 16 Jan 2015
b Department
a Magister Solution Ltd., Jyv¨ askyl¨ a, Finland of Mathematical Information Technology, University of Jyv¨ askyl¨ a, Finland
1. Introduction Modern cellular mobile networks have become diverse and complex in their nature. On one hand, networks simultaneously operate multiple Radio Access Technologies (RATs), and inside each there several releases which might be used in different geographical areas of the network. On the other hand, cellular systems become more heterogeneous due to growing deployment of femto and pico cells on top of macro layer. A roadmap towards 5G networks implies coexistence of different technologies, various cell sizes, device types, and appearance of new applications and behavior patterns. As a result, quality of provided service and reduction of operational expenditures of the networks are becoming critical aspects of competition between mobile network operators. Earlier, e.g. in 2G networks, it was sufficient to provide good coverage with support of basic call and text message services. Nowadays, users demand for high speed, low delay data transmissions with minimum amount of failures and outages. To comply with the new quality needs operators have to be very efficient in running their networks. This situation poses additional technological challenges for developers of modern mobile networks and researchers in the area of network optimization and intelligent performance monitoring. One of the main accepted approaches designed for network efficiency improvement is the concept of self-organization which relies on automation based on closed loop sensing. This idea has been initially appeared as a set of requirements in Next Generation Mobile Networks (NGMN) alliance [1], [2]. In addition, more thorough description of different use cases of Self-Organizing Network (SON) has been prepared within FP7 SOCRATES project [3]. As a result, 3rd Generation Partnership Program (3GPP), involved in development of standards of LTE mobile networks, has included SON use cases to standardization work [4]. There are three categories of SON: self- configuration, self-optimization and self-healing [5]. Initial steps of network setup and deployment are covered with selfconfiguration. When network is configured and operates, self- optimization is used for automatic tuning of network parameters. This functionality is based on performance ∗ Please
address correspondence to Fedor Chernogorov Email addresses: fedor.chernogorov[at]magister.fi, fedor.chernogorov[at]jyu.fi (Fedor Chernogorov), sergey.a.chernov[at]jyu.fi (Sergey Chernov), kimmobrigatti[at]gmail.com (Kimmo Brigatti), tapani.e.ristaniemi[at]jyu.fi (Tapani Ristaniemi)
1
monitoring and serves to achievement of high network efficacy. In turn self-healing is designed to ensure robust operation of mobile network by handling emerging failures. Its responsibility is to automatically detect that problem has appeared and then to trigger healing action [6, 7]. Our work is related to the first function of self-healing - detection of network failures and it complies with 3GPP use case called “cell outage detection” [7]. The solution suggested for detection of the investigated network problem is directly related to self-healing, as it makes possible identification of a non-trivial network failure in automatic and timely way. Further steps could be root cause diagnosis and recovery of the detected malfunction(-s). Wireless network performance management includes three main components: data collection, analysis and results interpretation. Data gathering can be done either by averaging cell-level statistics - collection of the Key Performance Indicators (KPIs). Another traditional approach for collecting more detailed performance data is measurement campaign with conventional drive tests. After that it is up to operator how to analyze collected statistics. Common way is to analyze averaged cell level data and apply KPI thresholds. Root cause analysis is done manually in majority of cases. Obviously there is a room for more intelligent approaches to detection and diagnosis of network failures, e.g. with data mining and anomaly detection techniques. This would provide possibility to automate performance monitoring task furthermore. Yet another way to alleviate improvement of network performance accepted in 3GPP in addition to SON, is functionality named Minimization of Drive Testing (MDT) [8]. MDT implies automatic collection and reporting of network measurements along with location information made by User Equipments (UEs), as it is described in Section 3. Collected data is then reported to the serving cell which in turn sends it to MDT server [9]. Thus, creation of a detailed UE specific performance database is enabled with MDT. The major problem of traditional performance analysis approaches is that there are a lot of different variations in KPIs caused by highly dynamic nature of cellular networks - of users, variable load, etc. For that reason it is hard to say which network behavior is normal and which is not. In addition, some failures can be explicit, i.e. direct alarm is triggered upon occurrence, while other failures are latent. The latter kind of problems is much more challenging from detection perspective, and because of that they are also referred to as “sleeping cells”. Appearance of sleeping cell can be caused by different kinds of malfunctions, but common characteristic of such failure is that no alarm is triggered when it happens. For the network operator it is a challenging task to do timely and accurate detection of sleeping cells. More elaborate description of the sleeping cell problem is presented in Section 2. One of the first attempts to automate the problem of sleeping cell detection has been made in [10, 11]. In that work statistical methods of network monitoring have been proposed. The suggested way implied creation of profiles of normal and abnormal behavior of cell load. No direct relation to particular technology like GSM or LTE has been discussed. Probably this is one of the reasons why there is no mentioning regarding the type of the failure which led to appearance of the sleeping cell. Later on similar, though more sophisticated, statistical profiling approach has been proposed for LTE systems in [12] and further developed to a complete performance monitoring framework [13]. It is important to note that different types of fault root causes have been investigated, though it is hard to say whether they belong to sleeping cell type or not. Authors suggest a full scale system for detection and diagnosis of faults, which is 2
a strong advantaged. However, one of the main drawbacks of the suggested statistical profiling approach is that creation of corresponding profiles takes substantial amount of time, e.g. hours or even days. This results in delayed detection and affects Quality of user Experience (QoE). To overcome this problem data mining and anomaly detection methods have been used in different studies. One of the first works where classification has been applied to sleeping cell detection is described in [14]. Authors suggest a method for detection of sleeping cells, caused by transmitted signal strength problem, on the basis of neighbor cell list information. Non-trivial pre- processing of the input data allowed to achieve fair classification accuracy, especially in case of high network load. However, the proposed anomaly detection system is prone to have relatively high false rate, which is very expensive in terms of operational expenses. This work has not been specific to LTE networks, and moreover particular reason of failure was not specified. In our studies of sleeping cell detection problem, we concentrated on application of anomaly detection techniques to datasets collected with immediate MDT functionality. In our first works cell outage detection caused by signal strength problems were studied. For that purpose we used diffusion maps algorithm for dimensionality reduction and kmeans for clustering to MDT samples to normal and abnormal [15, 16]. Sleeping cell has been simulated in LTE Rel. 9 network and caused by antenna gain failure in one of the cells. To increase robustness of this solution, in the next work periodic MDT measurements have been employed for fault detection [17]. Data mining has been done with diffusion maps and K-Nearest Neighbors (K-NN) classification algorithms. The next step was investigation of another type of sleeping cell - random access channel failure, discussed more in Section 4.1. It is more sophisticated and complicated for detection, as no issues with network coverage are caused. Solution of this problem required a different approach in data processing. The first results of sequential analysis based on N-gram for detection of random access channel sleeping cell are presented in [18]. This method proved to be promising and we continued our study, and present achieved results in this article. This paper is organized as follows. In Section 2 definition if sleeping cell is provided. Section 3 outlines MDT, its main features and roadmap in 3GPP standardization. Next, in Section 4 simulation environment, assumptions and random access channel problem description is made. Section 5 concentrates on the suggested sleeping cell detection data mining framework. It includes overview of the applied anomaly detection methods: KNearest Neighbors (K-NN) anomaly outlier scores, N-gram, minor component analyses, post-processing and performance evaluation techniques. Also, interconnection between these methods is discussed. Section 6 is devoted to the actual research results - data structures on different stages of analysis are shown, and efficiency of different postprocessing methods is compared. In Section 7 we draw conclusions and give prospects for further studies of applying anomaly detection techniques in cellular mobile networks performance monitoring. 2. Sleeping Cell Problem Sleeping cell is a special kind of cell service degradation. It means malfunction resulting in network performance decrease, invisible for a network operator, but affecting user QoE. On one hand, detection of sleeping cell problem with traditional monitoring 3
systems is complicated, as in many cases KPI thresholds do not indicate the problem. On the other hand fault identification can be very sluggish, as creation of cell behavior profile requires long time, and also problem might be effective for part of users, which would mask presence of the problem for other users. Regular, less sophisticated types of failures usually produce cell level alarms to performance monitoring system of mobile network operator. In contrast, for sleeping cells degradation occurs seamlessly and no direct notification is given to the service provider. In general, any cell can be called degraded in case if it is not 100% functional, i.e. its services are suffering in terms of quality, what in turn affects user experience. Classification of sleeping cells, depending on the extent of performance degradation can be roughly divided into three groups [10, 11]. The first type of sleeping cell is call impaired. In this case certain extent of traffic is carried, but performance characteristics are slightly lower than expected. It is a very complex task to detect these kinds of problems, as dynamic nature of mobile networks leads to variations in cell load and user traffic. The second kind of degradation is crippled cell, characterized by a severely decreased capacity. The last, and clearly the most critical type of sleeping cell is a catatonic cell - kind of outage which leads to complete absence of service in the faulty area and cell does not carry any traffic. For that reason it is important to timely detect such cells and apply recovery actions. As mentioned before, sleeping cell is a complex problem. It can be caused by malfunction of different hardware or software components of the network. Depending on the failure type, different extent of performance degradation can be induced. In this study we consider sleeping cell problem caused by Random Access Channel (RACH) failure. This kind of problem can appear due to RACH misconfiguration, excessive load or software/firmware problem at the eNB side [19, 20]. RACH malfunction leads to inability of the affected cell to serve any new users, while earlier connected UEs still get served, as pilot signals are transmitted. This problem can be classified to crippled sleeping cell type, and with time it tends to become catatonic. For a network operator in many cases RACH problem would become visible only after a long observation time or even due to user complains. Thus, it is hard to overestimate importance of timely detection of RACH failures in LTE networks. In our study, to make detection of sleeping cell caused by random access failure we employ data collected with MDT functionality, discussed in the next section. 3. Study of Minimization of Drive Tests The main purpose of MDT functionality is to collect excessive network performance information in automatic manner [8]. To achieve this UEs are involved, they do measurements of KPIs, such as e.g. radio channel conditions, and then report collected values. There are different use cases when MDT reports can be employed by mobile network operators. Specification describes UE specific reports usage for improvement of network coverage, capacity, mobility robustness and end user quality of service [5]. According to the standard, MDT measurements and reporting can be done both in connected and idle RRC2 modes. In the first case it immediate MDT, in which performance 2 Radio
Resource Control.
4
Table 1: Network events triggering MDT measurements and reporting
PL PROBLEM - Physical Layer Problem [21]. RLF - Radio Link Failure [22]. RLF REESTAB. - Connection reestablishment after RLF. A2 RSRP ENTER - RSRP goes under A2 enter threshold. A2 RSRP LEAVE - RSRP goes over A2 leave threshold. A2 RSRQ ENTER - RSRQ goes over A2 enter threshold. A3 RSRP - A3 event, according to 3GPP specification. HO COMMAND - handover command received [22]. HO COMPLETE - handover complete received [22].
measurements are reported as soon as they are done, while in the second case UE stores measurements in its memory, and reporting is done at the next transition to connected state. In this study we run only connected state simulations and hence rely on immediate MDT measurements. Immediate MDT can be of two kinds: periodic and event-triggered [9]. Periodic measurements are very useful for initial network deployment coverage and capacity verification as they provide detailed map of network performance, say in terms of signal propagation or throughput. The main disadvantages of periodic measurements is that they consume too much resources of the air interface and require more energy from UE battery. On the other hand event-triggered approach provides less information regarding the network status, but can be very efficient for mobility robustness and resource savings. Due to this fact we concentrated our efforts on achieving sleeping cell detection on the basis of immediate MDT with event-triggered reporting. In Table 1 we list network events which trigger MDT measurements and reporting. Usage of event-triggered MDT is justified especially due to the fact that more and more events which trigger MDT reporting are getting standardized [23]. For example, A2 event trigger has been added to MDT specification of LTE standard in 3GPP Release 10; RLF reporting is available since 3GPP Rel. 9; RLF REESTABLISHMENT event is similar to standardized in Release 11 RRC Connection Establishment Failure (RCEF) report [23]. It is important to say that A3, HO COMMAND and HO COMPLETE events are RRC messages used for regular network operation, and their availability is not a problem. 3.1. Location Estimation and MDT One of the important features of MDT is collection of geo-location information at the measurement time moments. Accuracy and availability of location information is a big topic for cellular communications in general, and for LTE networks in particular. Starting from 3GPP Release 8 serving cell ID is used for location estimation, however big disadvantage of this method is lack of accuracy. For this reason starting from 3GPP Release 9 a wide range of location methods became available, including Enhanced Cell ID, Observed Time Difference of Arrival, Angle of Arrival, Adaptive Enhanced Cell Identity, Assisted Global Navigation Satellite System. All of these methods vary in accuracy of location estimation and response time. However, in many cases combined usage of these methods can lead to sufficiently high accuracy of geo-position estimation at the moments when UE takes measurement. 5
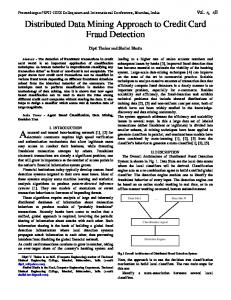
Under sufficient here we imply accuracy around 50 m. For instance in regulatory requirements for emergency services minimal location accuracy assisted by mobile terminals is 50 m for 67 % of calls and 150 m for 95 % of calls [24]. So we can assume, that at least location information with accuracy discussed above would be available in measurement reports, but in our study UE report their exact location to MDT server. 3.2. User Location Association Methods Whenever UE location is provided in MDT report there are several ways to associated it with particular cell. In this section, we discuss three methods which can be used to map specific UE measurement sample to specific cell ID: serving cell ID, dominance maps and a new approach based on target cell ID information. The key aspects which should be taken into account when selecting a location association method are accuracy and amount of information to create mapping between cell and user location. 3.2.1. Serving Cell ID Method Serving cell ID is available with MDT event-triggered report, even for early releases of LTE. However, in case of coverage hole or problems with new connection establishment, this approach can lead to mistakes in UE location association. For example, if cell is completely inaccessible, UEs would not establish connection to it, and as a result, ID of this cell will never be reported as serving in MDT. Instead, measurement samples would be assigned to neighbors of problematic cell, and they will, be marked as suspicious, not the cell, which causes actual malfunction. Hence, sleeping cell detection would be skewed. 3.2.2. Dominance Maps To avoid the above mentioned mistake in association of MDT sample with particular cell, a method called dominance map can be used. This is a map demonstrating which eNB has the strongest signal in each point of the network, i.e. which is dominating. For creation of dominance map, not only path loss, but also slow fading is taken into account. Dominance map which we used in our study is shown on Fig. 1. Cell IDs are marked with both color scale and labels on a network map. The main advantage of dominance maps is that mapping of cell ID to location coordinate of UE MDT measurement is very precise, as it is shown on Fig. 1. This results in higher accuracy of sleeping cell detection. However, the downside of this location association method is that it requires a lot of detailed input information. On one hand, it is a challenging task to create a complete dominance map, and on the other hand it is hard to acquire accurate user location information. Usage of dominance map location association method is justified by the fact that MDT would be taken into use in both 3G and LTE networks in near future. Hence, dominance maps would become more complete and accurate. Additionally, more accurate user location information is going to be available with deployment of newer releases of mobile networks. 3.2.3. Target Cell ID Method The last method for cell ID and UE report location association uses target cell ID feature. The main advantage of this approach is that it does not require serving cell ID, user GPS location or knowledge about cell dominance areas. This eases the requirements 6
DOMINANCE MAP 1150 15 1035
15
20
20
7
10
6
9 8
Y coordinate, m
0
13
805
3 13
1
115 0
0
14
10
5
12
13
8 12 16
2 19
18
14 2
18 16 7
16
12 0
345 230
18
13 4 3
11
575 460
10 6
920
690
17
6
17
4
10
15
6
20
7
10
130 260 390 520 650 780 910 104011701300 X coordinate, m
2 0
Figure 1: Wrap around Macro 21 slow faded dominance map
for MDT data collection in amount of details regarding user location. The problem of mapping on the basis of target cell ID, is that it might be useful for detection of only particular type of network problem, such random access sleeping cell. Efficiency of this method for detection of other malfunctions is subject for further verification. Different approaches for location association of anomalous cells are suggested to provide more freedom in selection of post-processing methods depending on availability of data in MDT reports and required fault detection accuracy. In description of the results (see Section 6) it is also demonstrated that combined application of different post-processing methods for sleeping cell detection can be very efficient. 4. Simulation Assumptions and Generated Data Verification of the developed data mining framework is based on large MDT measurement database generated by means of dynamic LTE system simulator. This simulator has been designed according to specifications 3GPP Releases 8, 9, 10 and partly 11. Step resolution of the simulator is one OFDM3 symbol. Methodology for mapping link level SINR to the system level is presented in [25]. Simulation scenario is created on the basis of 3GPP macro case 1 [26], which however has certain improvements. Investigated LTE network scenario is wrap-around and consists of 7 base stations with inter site distance of 500 meters. Each eNB contains 3 directed antenna sectors, resulting in 21 cells network layout. Modeling of propagation and radio link conditions includes slow and fast fading. For instance, on Fig. 1 a slow faded dominance map is presented. Users are spread randomly around the network, so that on average there are 15 UEs per cell. For UEs we use “random turn” mobility model, when probabilities of direction change and angle of turn are specified. Set of the main configuration parameters of the simulated network is shown in Table 2. 3 OFDM
- Orthogonal Frequency- Division Multiplexing
7
Table 2: General Simulation Configuration Parameters
Parameter
Value
Parameter
Value
Cellular layout
Macro 21 Wraparound
Number of cells
21
UEs per cell
15
Inter-Site tance
500 m
Link direction
Downlink
RRC mode
User distribution in the network
Uniform
Maximum TX power
Initial cell selection criterion
Strongest RSRP value
Handover margin (A3 margin)
3 dB
Handover to trigger
256 ms
Hybrid Adaptive Repeat and reQuest (HARQ)
Enabled
Slow fading standard deviation
8 dB
Slow fading resolution
5m
Simulation length
572 s ( 9.5 min)
Simulation resolution
1 time step = 71.43 µs
Network synchronicity mode
Asynchronous
Max number of UEs/cell
20
UE velocity
30 km/h
Duration of calls
Traffic model
Constant Bit Rate 320 kbps
Normal and Reference cases
Simulation without sleeping cell
Problematic case
Simulation with RACH problem in cell 1
A2 RSRP Threshold
-110
A2 RSRP Hysteresis
3
A2 RSRQ Threshold
-10
A2 RSRQ Hysteresis
2
time
DisIDLE BS
Disabled 46 dBm
4.1. Random Access Sleeping Cell Modeling As it is described above in Section 2 we investigate sleeping cell caused by RACH failure. Malfunction of RACH can lead to severe problems in network operation as it is used for connection establishment in the beginning of a call, during handover to 8
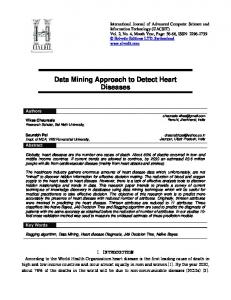
another cell or connection re-establishment after handover failure or RLF [22]. Modeling of erroneous random access behavior is done so that T304 timer is forced to be expired for only one cell which has cell ID 1. Thus, whenever UE tries to initiate random access to cell 1, this attempt would fail. Malfunction area covers around 5 % of the overall network. A set of 3 simulations has been run in the course of this study. “Normal” case did not contain random access sleeping cell. “Problematic” case contained network with RACH failure in cell 1. The last, “reference” case also did not have sleeping cell. All three of these simulations have different mobility random seeds, i.e. call start locations and UE traveling paths. 4.2. Generated Performance Data As an output from the simulations we get two kinds of data files - MDT log and dominance map information. MDT log includes a lot of variables, but in this study we employed the following ones: • MDT triggering event ID. shown in Table 1.; • UE ID; • UE location coordinates [m]; • Target cell ID. Thus, one data sample of the MDT log (i.e. one row) has fields specified above. Some authors consider origin and type of the analyzed data as a key aspect for successful analysis with anomaly detection methods [27]. From perspective of data mining, MDT triggering event ID is a categorical (nominal) and sequential data, i.e. sequences of events have meaning [28]. UE ID is also a categorical data, and partly sequential if we consider that order of UEs as they got connected has meaning. UE location coordinates is a numerical, spatial data. Target cell ID is also spatial data, but it is categorical, in contrast to location feature. As it is described in Section 3.2 dominance map is a spatial information about signal strength or radio channel condition, so it contains both numerical and spatial components. 5. Sleeping Cell Detection Framework The process of Knowledge Discovery in Databases (KDD), applicable to any data richful domain, includes the following steps [29, 28]: data cleaning, integration from different sources, feature selection and extraction, transformation, data mining, pattern evaluation and knowledge presentation. On the basis of this information we developed a data analysis framework for sleeping cell detection in LTE cellular mobile networks, shown on Figure 2. This anomaly detection data analysis framework is semi-supervised because normal input data, used for training of the transformation and data mining parts of the framework, does not contain anomalous data points. In other words, training data reveals only the notion of normal behavior, and does not tell us anything about abnormal behavior. On the other hand, in the testing phase we analyze problematic dataset which contains 9
Problematic or Reference
Normal
DATA
Sliding Window, N-gram analysis
DATA Feature selection & extraction
Sliding Window, N-gram analysis
Traning Phase
Testing Phase Transformation
Minor Component Analysis
Minor components
Training data
Projection
Training data
Testing data
Data mining
k-NN Anomaly Score Outlier Detection Algorithm
k-NN Anomaly Score Outlier Detection Algorithm Anomalous data points
Pattern evaluation
Knowledge interpretation and presentation
Post-processing methods
Sleeping cell detection histogram and heat map
Figure 2: Sleeping Cell Detection Framework
10
anomalies which should be detected. In addition we test our framework with reference dataset without any abnormal behavior to verify possibility of miss-detection. When input datasets are available the first processing step is feature selection and extraction. At this stage UE MDT event sequences are divided into sub-calls with sliding window approach, described in Section 5.1.1. After that sub-calls are processed with 2-gram analysis, presented in Section 5.1.2, and data in the new feature space is transferred to the transformation block of the framework. In the training phase, transformation to the new dimensional space is done with Minor Component Analysis (MCA), see Section 5.2.1. In the testing phase transformation is done with minor components derived earlier from the training data. As output from this stage we get training and testing datasets in lower dimensional space. Using the data from the transformation step we perform data mining based on k-NN anomaly score outlier detection algorithm, presented in Section 5.3.1. The main purpose of this step is to compare the scores of training and testing phases and from that to derive a list of anomalous sub-calls. Having the information from data mining stage we can evaluate patterns distinguished in the data with post- processing methods. In Section 5.4 we describe 4 different methods which are used to demonstrate different approaches to detection of sleeping cell and also to increase robustness of this detection. At the final stage of sleeping cell detection framework we give interpretation of the results achieved with the proposed analysis and two visual means employed for this purpose are sleeping cell detection histogram and heat map plot. Although, the framework seem to show that training and testing phases are done in parallel, in reality training phase is executed first to determine the necessary thresholds and parameters. 5.1. Feature Selection and Extraction At this step of sleeping cell detection framework, input data, be it normal, reference or problematic, is prepared for further data mining analysis. Naturally, initial event sequences reported by UEs with MDT functionality have different lengths. Number of events in sequence per UE call depends on velocity of the user, traffic distribution and network layout. To reduce or completely get rid of influence of the factors mentioned above we divide calls to sub-calls with sliding window pre-processing approach. Next, in order to be able to analyze sequences of data we convert sub-call data to a new feature space with 2-gram analysis. Both sliding window and 2-gram analysis pre- processing methods are described in this section. 5.1.1. Sliding Window Pre-processing Sliding window technique is simple and powerful approach, which is utilized for many anomaly detection applications [30]. Let’s consider the process of applying sliding window to a sequence of network events, which together constitute a call from one user. First it is necessary to select parameters for processing - sliding window size m and step n. Then we start from the beginning of the call, and take first m events - this is the first sub-call. Then we move the window by n events and again take m events, which are the second sub-call. Thus, one sequence of events is represented by several overlapping sequences of equal sizes, except for the last sub- call, which can be of different length. In case if window size is larger than step - it is overlapping sliding window, and if step is the same as window size - it is non-overlapping. We are using overlapping sliding window with 11
Table 3: Number of calls and sub-calls in analyzed data
Amount / Dataset Calls (all) Sub-calls (all) Normal sub-calls Abnormal sub-calls
Normal 2530 7230 6869 361
Problem 1940 7134 5932 1202
Reference 2540 7201 6821 380
Table 4: Example of N-gram analysis per character, N = 2.
Analyzed word performance performer
pe 1 1
er 1 2
rf 1 1
or 1 1
rm 1 1
ma 1 0
me 0 1
an 1 0
nc 1 0
ce 1 0
size of 15 events and step of 10 events, as this allows to maintain the context of the data after processing [31]. In general, the main purpose of sliding window technique is that by analyzing smaller data chunks (sub-calls) we can localize abnormal behavior more reliably and accurately than by investigating whole calls. Yet another important aspect, is that nearly all sub-calls have same number of events (size), in contrast to original UE calls, which are dependent one, e.g. velocity and network mobility parameterization. Number of calls and sub-calls for all three data sets can be seen from Table 3, e.g. training data consists of 2530 users, and after pre-processing number of sub-calls is equal to 7230. In our data average number of visited cells in original calls was 6 cells, while in sub-calls it was 3 cells. 5.1.2. N-Gram Analysis Feature selection is in many cases one of the most important steps in pre-processing procedure. In the described research we apply N-gram analysis to come up with feature matrix. N- gram analysis is widely used in sequential data processing. For instance, this method has been utilized for natural language processing and text analysis applications such as speech recognition, parsing, language recognition, spelling and more others tasks [32, 33, 34, 35, 36]. In addition N-gram has been applied in analysis of whole-genome protein sequences [37] and for computer virus detection [38]. Condensed description of this method and good insight on the application areas can be found also in [39]. N-gram is a sub-sequence of N overlapping items or units from a given original sequence. The items can be characters, letters, words or anything else. In general, the recipe is to define unit in data, and then take all possible sequences of N units. Therefore, N-gram provides a new way of representation of data by decomposing the original data to small pieces. This new representation is stored in a feature vector. The feature vector conveys values or frequencies of how often each particular N-gram subsequence happens in the original data. Here is an example of N -gram analysis application for two words: ‘performance’ and ‘performer’, N = 2, and a single unit is considered to be a character, not a word. The resulting frequency matrix after N -gram processing will be as it is shown in Table 4.
12
K-fold training process Normal dataset
K-fold validation process Problem dataset
Training 1
6
6
5
2 4
3
Reference dataset Testing
Testing 1
5
6 2
4
3
1
5
2 4
3
Figure 3: K-Fold validation approach
5.1.3. K-Fold Approach The final aim of our detection framework is to locate the problem and say what is the probability of correct detection and mis-detection of this framework. Methods described in further parts of this section are tools for detecting the problem, but in order to answer the question about statistical reliability we have to apply one simple method on the data. It is based on the idea of K-fold cross-validation technique [28], i.e. we are dividing both training and testing datasets to several non-intersecting parts and run algorithm on those parts. As it can be seen from Fig. 3 we divided UE calls to 6 chunks both in normal, problematic and reference datasets. By taking the first chunk from normal dataset for training and 6 chunks one by one from testing data we get 36 runs of our framework which form our sleeping cell detection statistics. 5.2. Transformation 5.2.1. Dimensionality Reduction with Minor Component Analysis Dimensionality reduction is an approach that represents high- dimensional data in a smaller set of derived variables - low- dimensional space. The actual aim of this approach is to make data mining process less complicated, and, therefore, to avoid ‘the curse of dimensionality’. In our study Minor Component Analysis (MCA) [40] has been selected on the basis of comparison with other dimensionality reduction methods such as Principal Component Analysis (PCA) [41] and diffusion maps [42]. MCA, similarly to PCA, extracts components of covariance matrix of the initial data set. However, in MCA only minor components are utilized for further analysis. Minor components are eigenvectors corresponding to the smallest eigenvalues of covariance matrix. The essence of MCA is to find a new representation of the initial data matrix X. It basically means that MCA proposes new coordinate system that meets some specific requirements. First of all, the origin of the proposed system of axes is displaced by the vector of mean values of X from the origin of the initial coordinate. Thus, the MCA coordinate system lies in the middle of the manifold of data. The basis vectors of the new space are referred as minor components and preserve the lowest variances of data set. Furthermore, there is one more strong property that requires minor components to be uncorrelated. In other words, MCA system of axis is comprised of orthogonal vectors or minor components. The formal and elaborate derivation of components is proposed in [41]. In a nutshell, eigenvectors corresponding to the highest and lowest eigenvalues 13
0
1
−7
10
0.8
−14
10
0.6
−21
10
0.4
−28
10
0.2 Eigenvalues GAP
−35
10
0
5
10
15
20
25
30
Model−order Selection. SORTE
Eigenvalues, [Log Scale]
10
0
Eigenvalue’ Order
Figure 4: Eigenvalue spectrum decay and SORTE scores
are referred as principal and minor components respectively. If the initial data matrix X is given, then the covariance matrix of X is Σ. It turns out that eigenvectors U corresponding to the lowest eigenvalues λ of the covariance matrix Σ form basis of the MCA coordinate system. Moreover, eigenvalues λ of matrix Σ encompass variances of the data matrix projected on the modified system of axes. Perhaps, the most straightforward way to come up with the basis of orthogonal eigenvectors is to solve singular value decomposition (SVD) of covariance matrix Σ. To use the results of MCA we need to decide how many of the least informative eigenvectors we use to create embedded space. To solve this problem we apply a method called SORTE (Second ORder sTatistic of Eigenvalues). 5.2.2. Gap Based Model-Order Selection Method: SORTE SORTE is novel gap-based model-order selection algorithm [43, 44]. In essence, SORTE breaks eigenvectors into two parts - informational and noise subspaces. As long as we are training sleeping cell detection model on normal dataset, features that describe abnormal behavior will not exist in the informative space. Therefore, embedded space is composed of the eigenvectors assigned to the noise space. The outcome of the SORTE method applied to our data is presented on Fig. 4. According to the principles of SORTE method [44] eigenvectors number 1 to 26 belong to informational subspace and eigenvectors starting from 27 onward (up to 32nd) form noise subspace. Thus, 6 eigenvectors are used as a basis of the embedded space employed for further data analysis. 5.3. Data Mining 5.3.1. K-NN Anomaly Score Ourlier Detection In order to extract abnormal instances from the testing dataset we make use of an anomaly detection algorithm. This algorithm is semi- supervized as long as training dataset is composed of only normal calls. Output from this algorithm is a set of anomaly scores for each data point, rather than classification decision, i.e. not a set of class labels. Therefore, to split testing points to normal and abnormal classes with respect to their anomaly scores it is necessary to set an additional threshold parameter T . In this study we utilize k-NN anomaly score outlier detection algorithm, which belongs to distance 14
based methods. Points with close neighbors are considered to be normal, while distant data points are treated to be anomalies. It is good to mention that, k-NN anomaly score algorithm is one of the most commonly used nearest-neighbor based anomaly detection techniques. In general, there are two approaches concerning the implementation of this algorithm; anomaly score assigned to each point is either the sum of distances to k nearest neighbors [45] or distance to k-th neighbor [46]. As long as the first method is more statistically robust, we have selected it as an outlier detection algorithm for our framework. In this way, k-NN anomaly score algorithm ranks all points with respect to the sum of distances to k nearest neighbors, which is done in the embedded space with Euclidean metric. Points having the largest anomaly scores are referred as outliers. Usually, data points having the top n% anomaly scores are identified as outliers. 5.4. Pattern Evaluation The main result of sleeping cell detection is indication of malfunctioning cell. Initial part of pattern evaluation via data post-processing is association of abnormal samples marked by the data mining algorithm with particular network elements, such as UEs and cells. To achieve this we developed 4 different post-processing techniques discussed further in this section. The essence of the methods is reflected in their names. First part describes which geo-location information has been used for mapping data samples to cells. It can be dominance map information, then method name starts with “dominance cell” label, or target cell ID feature, then method name begins with “target cell”. Also, we considered case when serving cell is used for correlating cell IDs with data samples, but results are not presented here, as they are less accurate, than for the post- processing techniques described here. The second part of the pattern evaluation method name can be either “sub-call” or “2-gram”. In the first case it denotes that sub- calls are used as processing samples (rows of the dataset), and 2- grams are used as features (columns of the dataset). In the second case, it is vice versa: 2-grams are samples, and sub-calls are features. The last part of the method name described whether only information about testing set has been used to build sleeping cell detection histogram, or a difference between training (normal) and testing (problematic or reference) sets has been employed. In the latter case method name ends with tag “deviation”. After usage of post-processing methods described in Sections 5.4.1, 5.4.2, 5.4.3, and 5.4.4, we employ amplification method discussed in Section 5.4.5. 5.4.1. Dominance Cell Sub-Call Deviation Method In our earlier study [18] we already used idea to count cells visited by anomalous users to create sleeping cell detection histogram. However, in cases when user calls have long duration, precision of this approach drops down drastically, as UE visits large number of cells. This masks presence of the sleeping cell. To overcome this problem we improved our earlier method and now calls are divided to sub-calls as described in Section 5.1.1. Another improvement is that instead of absolute number of cell visit counts we use the difference between normalized cell visits in training and testing data. It is important to note that our method is based on information about dominance maps. Count of cell visits is done so that even if user within duration of sub-call has visited same cell more 15
than once, still only one visit is counted. This is done to avoid counting ping- pong situations caused by effects of fast and slow fading in signal propagation. 5.4.2. Dominance Cell 2-Gram Deviation Method The next post-processing method for sleeping cell detection is based on count of 2gram occurrences instead of sub-calls. Even if the cell visit histogram does not reveal any problem, it is possible that independent 2-grams behave suspiciously in particular cells and that would be an indication of malfunction in the network. As in the previous method we evaluate deviation of normalized counts between training and testing datasets. Normalization is done by the total number of users in the investigated area. We count each event in the 2-gram as a separate unit, and if both events of the 2-gram have occurred in the same cell, count for this cell is incremented by 2. Geographical correspondence between cells and 2-gram counts is based on dominance maps. If inside problematic area particular 2-grams deviate from normal number of occurrences, this is considered as indication of anomalous cell behavior. Such deviation of 2-gram occurrences can be caused a malfunction or e.g. change in number of handovers or mobility related measurement reports (A3 events). 5.4.3. Dominance Cell 2-Gram Symmetry Deviation Method Symmetry analysis implies investigation of 2-grams with respect to user movement direction between two different cells. This method has also been earlier presented in [18]. Let’s assume that one event of 2-gram is located in cell A and another in cell B. Symmetry analysis compares how many occurrences of each 2-gram sequences originate from cell A and how many originate from cell B. So first, we define location of analyzed 2-gram using slow-faded dominance map. Then we evaluate the difference between symmetry in training and testing datasets. And finally receive an indication about presence of problematic cell in the network. Observation of symmetry imbalance in one of the cells becomes an evidence of malfunction. 5.4.4. Target Cell Sub-Call Method This method is based on evaluation of sub-calls in the transformed dataset. One of the main advantages of this post-processing method, is that there is no need for location information from UE MDT reports. Moreover, dominance maps are not used either. The only information needed for processing with this method is a target cell ID feature, which is present for the following MDT events: A3 measurement report, HO command, HO complete and reestablishment procedure after radio link failure, as described in Section 4.2. This feature indicates direction of UE connection change, i.e. future serving cell, if HO or RLF connection reestablishment procedures are successful. Another important difference of target cell ID method is that only testing data is used for creation of the final sleeping cell detection histogram, i.e. deviation is between training and testing is not calculated. 5.4.5. Amplification and Sleeping Cell Score Calculation Output from the post-processing methods described above is a set of values corresponding to each cell in the analyzed network. To achieve clearer indication of problematic cell presence, additional non-linear transformation is applied. We call this procedure 16
amplification which allows to emphasize problematic areas and diminish the value of normal regions in the network. Each value corresponding to cell ID is divided by the sum of values of all other cells, except for the neighboring cells. In case of faultless network behavior, values of cells’ abnormality are not affected, however in case if one or multiple cells are in malfunction, amplification procedure puts more emphasis on those cells ensuring more reliable detection. Abnormality values received after post-processing and amplification are then normalized by the cumulative abnormality value of all cells in the network. Normalization is necessary to get rid of dependency on the size of the dataset, i.e. number of calls and number of users. 5.5. Knowledge Interpretation and Presentation The final goal of overall data processing is to find and present meaningful patterns in the data in such a way that they are easily interpreted by a human. Thus, final step of sleeping cell detection framework is visualization of the results and we employ two methods for results presentation: sleeping cell detection histogram and network heat map. Sleeping cell detection histogram shows predicted abnormality of each cell in the analyzed network. Height of the bars indicates the extent of the detected abnormality of corresponding cell. This approach is very intuitive and one can easily spot individual cell or cells which can be suspected in malfunction. However, by means of sleeping cell histogram it is hard to understand that problematic cells are related and where the suspicious area is in case if the problem indication is spread among different neighboring cells. Due to this fact, we employ the network heat map method which shows by means of color code in which cells abnormal samples have been detected, so that more intensive areas, according to the color bar, indicate the most anomalous areas in the network. In addition to color, size of the spot within each cell depicts the extent of abnormality of this particular cell. The main benefit of network heat map is that mobile network topology and neighbor relations between cells are taken into consideration. 5.5.1. Performance Evaluation To evaluate performance and compare efficiency of the proposed post- processing algorithms described above we use both conventional metrics and heuristic approach. To apply metrics widely used in the world of anomaly detection we have to know the labels of data points. To achieve that we use statistics created by the 36 runs of our sleeping cell detection framework - 6 runs of each of testing set chunks for each training set chunk, as it is described in Section 5.1.3. After that for each cell we can calculate mean value and standard deviation of the sleeping cell scores. By applying the 3σ rule we decide whether each cell has been correctly classified as normal or abnormal. Goodness and applicability of this criterion is under consideration. Having the labels and the outcomes of different post-processing methods we can apply popular performance scores such as accuracy, precision, recall, F-score, True Negative Rate (TNR), False Positive Rate [47]. On the basis of these scores we can also build ROC4 curve and corresponding 4 Receiver
Operating Characteristic
17
100
80
80 Sleeping Cell Score
Sleeping Cell Score
100
60 40
40 20
20 0
60
0 1 2 3 4 5 6 7 8 9 10 11 12 13 14 15 16 17 18 19 20 Cell ID
(a) No sleeping cells
0
0 1 2 3 4 5 6 7 8 9 10 11 12 13 14 15 16 17 18 19 20 Cell ID
(b) One sleeping cell in the network
Figure 5: Ideal sleeping cell histograms
AUC5 of our sleeping cell detection algorithm. In addition to conventional methods of performance evaluation we suggest a heuristic method. The main idea hear that we know in advance how ideal solution looks like in case if there is no sleeping cell, Fig. 5a or if there is one, Fig. 5b. There are two important values which we use for evaluation of algorithm performance. The sleeping cell score of the highest bar is referred as “sleeping cell magnitude” and the sum of the standard deviations of sleeping cell scores of other bars is “cumulative standard deviation”. Thus, performance of the sleeping cell detection algorithm can be described by a point in the space “sleeping cell magnitude”-“cumulative standard deviation”. This plane contains two points of interest: in case of malfunctioning network, the ideal sleeping cell detection algorithm would have coordinate [0; 100]. On the other hand, in case of normally operating network, the ideal performance is point [0; 100/Ncells in the network ] on the plane “sleeping cell magnitude”-“cumulative standard deviation”. Therefore, if we use Euclidean distance from the corresponding point to the ideal algorithm’s point on the plane “sleeping cell magnitude”-“cumulative standard deviation” we can say something about performance of this algorithm and its relation to other algorithms’ performance. Results of application of this method for performance evaluation are presented in Section 6.4. 6. Results of Sleeping Cell Detection In this section we concentrate on the outcomes of the developed anomaly detection framework and describe its effectiveness for spotting sleeping cells. 6.1. Pre-processing and K-NN Anomaly Score Calculations The very first step of the sleeping cell detection framework is to pre-process normal dataset, following the steps described in Section 5.1. Then this data is used to train the k-NN anomaly outlier score algorithm. This is done to derive an outlier score threshold, further applied at testing stage to separate normal and abnormal behavior. Threshold is 5 Area
Under Curve
18
Normal Sub−calls Abnormal Sub−calls
1 0 −1 1.5 0.5 0.5
−5
10
−10
10
−15
10
0 0
Dimension 28
k−NN Anomaly Score, [Log Scale]
Dimension 29
2
1
Normal Sub−calls Abnormal Sub−calls 95% Threshold
0
10
3
−0.5 −0.5
−1
Dimension 27
(a) Normal training dataset in the embedded space
−20
10
0
1000
2000
3000 4000 Sub−call
5000
6000
7000
(b) Sorted outlier scores of normal training dataset
Figure 6: Normal dataset used for training of the sleeping cell detection framework
selected so that it separates 95 % of normal data points with low anomaly outlier scores from other 5 % of points, which have the highest anomaly outlier scores. This threshold equals to 0.0218 of outlier score. Shape of normal dataset in the embedded space is shown on Fig. 6a. It is important to emphasize that in normal dataset points, both above (marked with red crosses) and below (blue circles) selected threshold, are normal. Sorted anomaly outlier scores themselves are presented on Fig. 6b. The next phase of data processing with sleeping cell detection framework is testing. Testing data is pre-processed and then fed into the k-NN algorithm. There are two datasets which are used at this stage - problematic and reference. Shape of the problematic dataset in embedded space and anomaly scores are presented on Fig. 7. The main purpose of analysis of this dataset is to find anomalies and by that to detect sleeping cell. One can clearly see that in addition to dense data cloud, there are also obvious outliers which represent the most abnormal behavior of the network. From Fig. 7b we can see the separated cluster of data points above the threshold with the highest anomaly scores - these are the same outlier points. On the other hand, one can notice that there are normal points above the abnormality threshold. This means that there is certain percentage of false alarms, i.e. some good points are treated as bad. Though, there is no opposite behavior referred to as “miss-detection” - none of the anomalous points are treated as normal. Validation of our data mining framework is done with a reference dataset, which does not contain any real anomalies - network behavior is normal there, as there is no failure case simulated. The main purpose of using it as testing is to demonstrate stability of the detection framework and show that false alarm rate is low. Reference data in the embedded space and corresponding anomaly outlier scores are shown on Fig. 8. One can notice that shapes of normal (Fig. 6a) and reference (Fig. 8a) datasets in the embedded space are very similar, though of course not identical. The same observation can be made regarding distributions of anomaly scores of these two datasets. 6.2. Application of Post-Processing Methods for Sleeping Cell Detection After training and testing phases sub-calls in testing data with anomaly score values above the selected threshold of 0.0218 are marked as abnormal. As a next step it is 19
Normal Sub−calls Abnormal Sub−calls
1 0 −1 1.5 0.5 0.5
k−NN Anomaly Score, [Log Scale]
Dimension 29
2
1
Normal Sub−calls Abnormal Sub−calls 95% Threshold
0
10
3
−5
10
−10
10
−15
10
0 0 −0.5
Dimension 28
−20
−0.5 −1
10
0
1000
2000
Dimension 27
(a) Problem testing dataset in the embedded space
3000 4000 Sub−call
5000
6000
7000
(b) Sorted outlier scores of problem testing dataset
Figure 7: Problematic dataset used at the testing phase of the sleeping cell detection framework
Normal Sub−calls Abnormal Sub−calls
1 0 −1 1.5 0.5 0.5
−5
10
−10
10
−15
10
0 0
Dimension 28
k−NN Anomaly Score, [Log Scale]
Dimension 29
2
1
Normal Sub−calls Abnormal Sub−calls 95% Threshold
0
10
3
−20
−0.5 −0.5
−1
10
Dimension 27
(a) Reference testing dataset in the embedded space
0
1000
2000
3000 4000 Sub−call
5000
6000
7000
(b) Sorted outlier scores of reference testing dataset
Figure 8: Reference dataset used at the testing phase of the sleeping cell detection framework
20
50 40
original amplified mean mean + std mean + 2 * std mean + 3 * std
60 Sleeping Cell Score
Sleeping Cell Score
60
30 20 10 0
50 40
original amplified mean mean + std mean + 2 * std mean + 3 * std
30 20 10 0
0 1 2 3 4 5 6 7 8 9 10 11 12 13 14 15 16 17 18 19 20 Cell ID
(a) Problematic dataset sleeping cell detection histogram
0 1 2 3 4 5 6 7 8 9 10 11 12 13 14 15 16 17 18 19 20 Cell ID
(b) Reference dataset sleeping cell detection histogram
Figure 9: Results of sleeping cell detection for Dominance Cell Sub-Call Deviation method
necessary to convert this information to knowledge about location of malfunctioning cell or cells. To achieve this we apply 4 different post-processing methods, which are thoroughly described in Section 5.4. In this section we will see how successful each method of sleeping cell detection is, when applied to problematic data. 6.2.1. Detection based on Dominance Cell Sub-Call Deviation In our earlier study post-processing based on visits deviation for sleeping cell detection has already been employed, as it is shown in [18]. However, one problem of this approach has been recognized. In case if duration of analyzed user calls is long, then corresponding number of visited cells is large, especially for fast UEs. Hence, even if we mark this call as abnormal it is very hard to say which cell was causing the detected anomalous behavior. To overcome this problem we introduced a new pre-processing method - sliding window approach, described in 5.1.1. The main benefit of that method is that majority of sub-calls have fixed length, which is short enough to pinpoint problematic cell in abnormal sub-call. Another improvement, if compared to our earlier work is that now we operate with cell anomaly counts normalized by total number of sub- calls. This allows to compare number of anomalies in training and testing data, i.e. to use deviation measure. These cell specific deviations are then used to create bar plot called sleeping cell detection histogram, presented on Fig. 9a. It can be seen that abnormal sub-calls are encountered more frequently in the area of dominance of cell 1, which has the highest values of anomaly deviation. One can see that there are 2 types of bars - colorful (in this case blue) and grey. The second variant implies additional post-processing step amplification, which to some extent takes into consideration network topology, as it is described in Section 5.4.5. In addition to cell 1, its neighboring cells 8, 9, 11 and 12 also have increased values of deviation. To distinguish between faulty behavior and moderate anomaly of a cell, which can be caused say by unusual mobility of the users, we introduced a threshold-based rule. It is a rule of 3 sigmas, broadly used in statistics. We calculate statistical characteristics of anomaly deviation - mean value (µ) and variance (σ 2 ). Potential user of our framework, 21
50 40
original amplified mean mean + std mean + 2 * std mean + 3 * std
60 Sleeping Cell Score
Sleeping Cell Score
60
30 20 10 0
50 40
original amplified mean mean + std mean + 2 * std mean + 3 * std
30 20 10 0
0 1 2 3 4 5 6 7 8 9 10 11 12 13 14 15 16 17 18 19 20 Cell ID
(a) Problematic dataset sleeping cell detection histogram
0 1 2 3 4 5 6 7 8 9 10 11 12 13 14 15 16 17 18 19 20 Cell ID
(b) Reference dataset sleeping cell detection histogram
Figure 10: Results of sleeping cell detection for Dominance Cell 2-Gram Deviation method
e.g. cellular mobile network operator can set threshold depending on own needs. However, we use 3 sigmas deflection from mean, derived from amplified values. As it can be seen from Fig. 9a only sub-call visits deviation of cell 1 goes over the selected threshold. In order to validate stability and reliability of our framework we use faultless testing dataset, called reference. As it can be seen from Fig. 9b cells 6 and 17 have deviation levels equal to or slightly higher than mean plus 2 sigmas value, but still not reaching mean plus 3 sigmas threshold, and hence these cells cannot be treated as faulty. Later it will be shown that other methods have flatter distribution of anomaly deviations. Hence, those post-processing approaches are less prone to false alarms then the described method of visits deviation. 6.2.2. Detection based on Dominance Cell 2-Gram Deviation In this method instead of considering sub-calls, we analyze 2-grams as samples. By comparing number of occurrences, normalized by total number of users in training and testing datasets we deduce potentially problematic cells. There can be 3 different situations with occurrence of particular 2- gram sequence: it can become rare in the testing dataset if compared to training data; it can start happening very frequently; and frequency of appearance might remain the same. We assume that in the last case there is no indication of a failure in the network. Hence changes in network behavior are of main interest for us. From sleeping cell detection histogram on Fig. 10a it can be that cell 1 has a clear difference in number of 2-gram occurrences if compared to training data. This happens because handovers toward this cell fail. Due to this fact 2-gram sequence with events related to handovers become imbalanced in testing data if compared to training data. For instance, 2-grams with HO Complete messages, like HO Command - HO Complete and HO Complete - A2 RSRP ENTER, become very rare. On the other hand, 2- gram HO Command - A2 RSRP ENTER, which can be treated as indication of non-successful handovers, in opposite becomes very popular in testing data, while in training data it does not exist at all. Among the neighbors of problematic cell 1, only cell 11 has slightly higher sleeping cell score than other cells in the network. 22
50 40
original amplified mean mean + std mean + 2 * std mean + 3 * std
60 Sleeping Cell Score
Sleeping Cell Score
60
30 20 10 0
50 40
original amplified mean mean + std mean + 2 * std mean + 3 * std
30 20 10 0
0 1 2 3 4 5 6 7 8 9 10 11 12 13 14 15 16 17 18 19 20 Cell ID
(a) Problematic dataset sleeping cell detection histogram
0 1 2 3 4 5 6 7 8 9 10 11 12 13 14 15 16 17 18 19 20 Cell ID
(b) Reference dataset sleeping cell detection histogram
Figure 11: Results of sleeping cell detection for Dominance Cell 2-Gram Symmetry Deviation method
Testing sleeping cell detection framework with reference data and post-processing with 2-gram occurrence methods shows good stability and low false-alarm rate, as it can be seen from Fig. 10b. In general, Dominance Cell 2-Gram Deviation method demonstrates better stability than Dominance Cell Sub-Call Deviation. 6.2.3. Detection based on Dominance Cell 2-Gram Symmetry Deviation The next method is based on analysis of symmetry imbalance of 2-grams of network events. From training data we have knowledge about balance for every 2-gram in each cell. Analysis of 2-gram symmetry deviation does not take into account 2-grams which occur inside dominance area of one cell, as this is already done in the occurrence deviation method described above. Thus the main emphasis is on 2-grams which occur at the border of two cells. It means that if in testing data there are more handover procedures starting from Cell A to Cell B, than from Cell B to Cell A, we can conclude that symmetry of this particular 2gram is disturbed comparing to the training data. Most common types of 2-grams which are analyzed with this method are related to handovers, e.g. A3 - HO COMMAND sequences. From Fig. 11 it can be seen that Dominance Cell 2-Gram Symmetry Deviation finds sleeping cell 1, while its neighboring cells 8, 9, 11 and 12 have suspiciously high sleeping cell score, if compared to other cells in the network. Comparison of symmetry analysis method with two previously describe post-processing approaches shows that this method is very efficient in detecting sleeping cell and its neighbors. At the same time stability of this method is also very good, as it can be seen from Fig. 11b. 6.2.4. Detection based on Target Cell Sub-Calls As it is described in Section 5.4.4, deviation is not calculated in this method and most importantly dominance maps information is not required to detect sleeping cell. By plotting all unique target cell IDs for each anomalous sub-call we get a resulting 23
50 40
original amplified mean mean + std mean + 2 * std mean + 3 * std
30 20 10 0
original amplified mean mean + std mean + 2 * std mean + 3 * std
60 Sleeping Cell Score
Sleeping Cell Score
60
50 40 30 20 10 0
0 1 2 3 4 5 6 7 8 9 10 11 12 13 14 15 16 17 18 19 20 Cell ID
(a) Problematic dataset sleeping cell detection histogram
0 1 2 3 4 5 6 7 8 9 10 11 12 13 14 15 16 17 18 19 20 Cell ID
(b) Reference dataset sleeping cell detection histogram
Figure 12: Results of sleeping cell detection for Target Cell Sub-Calls method
sleeping cell detection histogram, presented on Fig. 12. It can be clearly seen that cell 1 is successfully detected, as well as its neighbors - cells 8, 9, 11, 12. Effectiveness of this methods is slightly lower than for other methods, and it is also more disposed to false alarms, as it can be seen from the results when reference data is used as testing, Fig. 12b. Here sleeping cell score of cell 6 is reaching threshold of mean plus 2 sigmas and for cells 16 and 17 sleeping cell scores are also quite high. However, this a price of giving up information about dominance maps, which makes this method a good option when geo-location information is limited. 6.3. Combined Method of Sleeping Cell Detection Here we present results of sleeping cell detection with a combined post-processing approach based on the previously described post- processing methods. Resulting amplified sleeping cell detection histogram, shown on Fig. 13 has been created on the basis of the amplified histograms of included methods. Cell 1 is well separated from all other cells in terms of sleeping cell score and goes above µ + 3 ∗ σ threshold. Neighboring cells 8, 9, 11, 12 also have increased sleeping cell scores comparing to other cells. It is important to note that here methods are applied with equal weights. However, it is possible to increase weight of more sensitive method, and reduce weight for more unreliable. Though, selection of optimal weights is a matter of a separate study and is not discussed here. Reference data used as testing also demonstrates stability of the combined approach, though it can be seen that usage of target cell ID methods introduces some noise. But this phenomenon has been discussed earlier in Section 6.2.4. 6.4. Comparison of Algorithms and Performance Evaluation The post-processing methods discussed above have their own advantages and disadvantages. In order to compare methods between each other, we evaluate their performance using several quality metrics. First, on the basis of the labels derived with the 3σ threshold we can apply conventional data mining performance metrics. For each post24
50 40 30
Visits deviation Occurence deviation Symmetry deviation Target Cell mean mean + std mean + 2 * std mean + 3 * std
60 Sleeping Cell Score
Sleeping Cell Score
60
20 10 0
50 40 30
Visits deviation Occurence deviation Symmetry deviation Target Cell mean mean + std mean + 2 * std mean + 3 * std
20 10
0 1 2 3 4 5 6 7 8 9 10 11 12 13 14 15 16 17 18 19 20 Cell ID
(a) Problematic dataset sleeping cell detection histogram
0
0 1 2 3 4 5 6 7 8 9 10 11 12 13 14 15 16 17 18 19 20 Cell ID
(b) Reference dataset sleeping cell detection histogram
Figure 13: Results of sleeping cell detection for amplified combined method
processing method there is corresponding set of values, shown on Fig. 14a. Ideal performance is presented with the black line. Formally, according to the values of the metrics, visits deviation and occurrence deviation methods demonstrate better performance than two other methods. However, the larger false positive rate for symmetry deviation and target cell methods does not necessarily mean that those methods are worse. The reason is that in statistical distribution of sleeping cell scores neighbor cells of cell 1 also exceed the 3σ threshold. Naturally this happens because adjacent cells are not completely independent, and especially in case of outage in one cell, changes can and will occur in neighboring cells. Thus, symmetry deviation and target cell methods can be treated as more sensitive than the others. The observed behavior underlines the need for a method which takes into account network topology, however this is left for further study. Regarding the ROC curve of our anomaly detection algorithm, it is presented on Fig. 14b. As it can be seen, our algorithm is able to create such a projection of the data, that in the new space it is possible to use linear threshold to separate all normal data points from abnormal. Because of that we can say that the suggested data mining framework for sleeping cell detection is successful, and for reduction of false alarm rate it is necessary to invent a better rule than deviation of 3σ. Though, as mentioned earlier, it might be more beneficial to study separation methods which take into consideration neighbor relations. To compare post-processing algorithms from a different perspective than conventional quantitative metrics we have invented a heuristic performance approach, described in Section 5.5.1. The core idea is that algorithm is considered to be good if the the distance to ideal solution point is small, the larger the distance, the worse this algorithm. Comparison of cumulative distances for different algorithms in original and amplified cases are presented on Fig. 15a and Fig. 15b correspondingly. It can be seen that Dominance Cell 2-Gram Symmetry Deviation method has the smallest distance from the ideal detection case, and from perspective of the heuristic performance approach this method is dominating among others.
25
F_measure 1 0.9
0.8 0.7 0.6
TNR
Precision
0.5 0.4
0.3 0.2 0.1 0
Accuracy
FPR
Recall Ideal Performance Dominance Cell Sub-Call Deviation Dominance Cell 2-Gram Deviation Dominance Cell 2-Gram Symmetry Deviation Target Cell Sub-Call Combined (a) Performance Measures of Algorithms
1
TPR
0.8
0.6
0.4 ROC curve Ideal performance Dominance cell sub−call deviation Dominance cell 2−gram deviation Dominance cell 2−gram symmetry deviation Target cell sub−call deviation Combined
0.2
0 −0.02
0
0.02
0.04
0.06
0.08 0.1 FPR
0.12
0.14
0.16
0.18
(b) ROC curve of sleeping cell detection framework
Figure 14: Performance Measures for Algorithms’ Comparison
26
Problematic dataset
Reference dataset
120 100
80
4.15 10.14
4.21
3.59 3.82
60 40
73.35
74.62
20
57.64
98.13
75.83
0
Dom. Cell SubCall Dev.
Dom. Cell 2Dom. Cell 2- Target Cell SubGram Dev. Gram Symmetry Call Dev.
Combined
(a) Distances in original - non amplified approach
Problematic dataset
Reference dataset
120
5.41
100
80
13.16
3.97
65.84
70.94
60 40
4.85 4.36
20
99.1 67.85
36.96
0
Dom. Cell SubCall Dev.
Dom. Cell 2Dom. Cell 2- Target Cell SubGram Dev. Gram Symmetry Call Dev.
Combined
(b) Distances in amplified approach
Figure 15: Heuristic performance comparison of algorithms
27
7. Conclusions In this article we propose and demonstrate results of an advanced data mining framework for automated detection of sleeping cells caused by random access failure. Principles of self-organization in LTE network, namely self-healing and collection of UE performance data with minimization of drive tests functionality have been utilized as a basis for our study. Investigated type of sleeping cell problem - random access channel failure, is rather complex and previously detection of this problem has not ever been studied. To identify presence of this problem in LTE network we use semi-supervised anomaly detection framework. Analyzed data is in form of user event-based MDT reports. Processing starts with transformation of data with sliding window approach. Next, 2-gram analysis is applied, i.e. sequences of user event pairs are considered. Then dimensionality reduction of training data with minor component analysis is used to come up with projection for testing data. As a next step, K-NN anomaly score outlier detection algorithm is used. After that several post-processing methods are utilized to map anomalous data points to cells of the network. Additionally, so called amplification is used to take into account neighbor relations between cells in the network and improve quality of sleeping cell detection. Results of the study have been validated with a comprehensive dynamic system level simulation of LTE network. To achieve statistical reliability we employed kfold cross validation technique and verification of framework operation with a separately created reference non-problematic dataset. The suggested framework allows for efficient detection of the random access sleeping cell problem in the network. Different performance metrics used for comparison of the applied post-processing methods demonstrate that symmetry analysis and target cell methods are the most efficient ones for problem identification. Amplification also proves to be the very effective approach for improvement of detection quality. Results of this work lay grounds and suggest exact methods for building advanced performance monitoring systems in modern mobile networks. One of possible directions of this area is extensive usage of data mining techniques in general, and anomaly detection in particular. New systems of network maintenance would allow to address growing complexity and heterogeneity of modern mobile networks, and especially 5G. Future work in this field includes validation of the developed system in more complex scenarios, detection of several or different types of problems, and substitution of semisupervised approach with unsupervised. The ultimate goal would be accurate detection of sleeping cells of different types in highly dynamic network environments. Obviously, low level of false alarms should be supported, and at the same time significant increase of computational complexity should be avoided. Acknowledgments Authors would like to thank colleagues from Magister Solutions, Nokia and University of Jyv¨ askyl¨ a for collaboration, their valuable feedback regarding this research, and peer reviews. Work on this study has been partly funded by MIPCOM project, Graduate School in Electronics, Telecommunications and Automation (GETA), and Doctoral Program in Computing and Mathematical Sciences (COMAS).
28
References [1] Recommendation on SON and O&M Requirements, NGMN, 2008. [Online]. Available: ”http://www.ngmn.org/” [2] Use Cases related to Self Organising Network, Overall Description, NGMN, 2008. [Online]. Available: ”http://www.ngmn.org/” [3] N. Scully et al. (2008, Mar.) D2.1: Use cases for self-organising networks. [Online]. Available: http://www.fp7-socrates.eu [4] Evolved Universal Terrestrial Radio Access Network (E-UTRAN); Self-configuring and selfoptimizing network (SON) use cases and solutions (Release 9), 3GPP Std. TR 36.902, 2009. [5] S. H¨ am¨ alainen, H. Sanneck, and C. Sartori, LTE Self-Organising Networks (SON): Network Management Automation for Operational Efficiency, 1st ed. Wiley Publishing, 2012. [6] J. Ramiro and K. Hamied, Self-Organizing Networks (SON): Self-Planning, Self-Optimization and Self-Healing for GSM, UMTS and LTE, 1st ed. Wiley Publishing, 2012. [7] 3GPP; TSG Services and System Aspects; Telecommunication management; Self-Organizing Networks (SON); Self-healing concepts and requirements (Release 11), 3GPP Std. TS 32.541, 2012. [8] TSG Radio Access Network; Study on Minimization of drive-tests in Next Generation Networks; (Release 9), 3GPP TR 36.805 V9.0.0, December 2009. [9] W. Hapsari, A. Umesh, M. Iwamura, M. Tomala, B. Gyula, and B. Sebire, “Minimization of drive tests solution in 3gpp,” Communications Magazine, IEEE, vol. 50, no. 6, pp. 28–36, 2012. [10] B. Cheung, G. N. Kumar, and S. A. Rao, “Statistical algorithms in fault detection and prediction: Toward a healthier network,” Bell Labs Technical Journal, vol. 9, no. 4, pp. 171–185, 2005. [11] B. Cheung, S. G. Fishkin, G. N. Kumar, and S. A. Rao, “Method of monitoring wireless network performance,” Patent US 2006/0 063 521 A1, CN1 753 541A, EP1 638 253A1, March, 2006. [12] S. Novaczki and P. Szilagyi, “Radio channel degradation detection and diagnosis based on statistical analysis,” in Vehicular Technology Conference (VTC Spring), 2011 IEEE 73rd, May 2011, pp. 1–2. [13] P. Szilagyi and S. Novaczki, “An automatic detection and diagnosis framework for mobile communication systems,” IEEE Transactions on Network and Service Management, vol. 9, no. 2, pp. 184–197, June 2012. [14] C. M. Mueller, M. Kaschub, C. Blankenhorn, and S. Wanke, “A cell outage detection algorithm using neighbor cell list reports,” in Self-Organizing Systems, ser. Lecture Notes in Computer Science, K. Hummel and J. Sterbenz, Eds. Springer Berlin Heidelberg, 2008, vol. 5343, pp. 218–229. [15] F. Chernogorov, “Detection of sleeping cells in long term evolution mobile networks,” Master’s thesis, University of Jyv¨ askyl¨ a, Finland, 2010. [16] F. Chernogorov, J. Turkka, T. Ristaniemi, and A. Averbuch, “Detection of sleeping cells in LTE networks using diffusion maps,” in Vehicular Technology Conference (VTC Spring), 2011 IEEE 73rd, May 2011, pp. 1–5. [17] J. Turkka, F. Chernogorov, K. Brigatti, T. Ristaniemi, and J. Lempi¨ ainen, “An approach for network outage detection from drive-testing databases,” Journal of Computer Networks and Communications, 2012. [18] F. Chernogorov, K. Brigatti, T. Ristaniemi, and S. Chernov, “N-gram analysis for sleeping cell detection in lte networks,” in Proceedings of the 38th International Conference on Acoustics, Speech, and Signal Processing (ICASSP), 2013. [19] M. Amirijoo, P. Frenger, F. Gunnarsson, J. Moe, and K. Zetterberg, “On self-optimization of the random access procedure in 3g long term evolution,” in Integrated Network ManagementWorkshops, 2009. IM ’09. IFIP/IEEE International Symposium on, 2009, pp. 177–184. [20] O. N. C. Yilmaz, J. H¨ am¨ alainen, and S. H¨ am¨ alainen, “Self-optimization of random access channel in 3rd generation partnership project long term evolution,” Wirel. Commun. Mob. Comput., vol. 11, no. 12, pp. 1507–1517, Dec. 2011. [21] Technical Specification Group Radio Access Network; Evolved Universal Terrestrial Radio Access (E-UTRA); Radio Resource Control (RRC); Protocol specification (Release 10), 3GPP Std. TS 36.331, 2011. [22] S. Sesia, M. Baker, and I. Toufik, LTE - The UMTS Long Term Evolution: From Theory to Practice. John Wiley & Sons, 2011. [23] J. Johansson, W. Hapsari, S. Kelley, and G. Bodog, “Minimization of drive tests in 3gpp release 11,” Communications Magazine, IEEE, vol. 50, no. 11, pp. 36–43, 2012. [24] “Small Entity Compliance Guide: Wireless E911 Location Accuracy Requirements,” Federal Communications Commission: Report and Order FCC 10-176 PS Docket No. 07-114, p. 3, 2011. [25] K. Brueninghaus, D. Astely, T. Salzer, S. Visuri, A. Alexiou, S. Karger, and G.-A. Seraji, “Link
29
[26] [27] [28] [29] [30] [31] [32] [33]
[34] [35] [36]
[37]
[38]
[39] [40] [41] [42] [43] [44] [45]
[46] [47]
performance models for system level simulations of broadband radio access systems,” in IEEE 16th International Symposium on Personal, Indoor and Mobile Radio Communications, 2005. PIMRC 2005., vol. 4, sept. 2005, pp. 2306 –2311 Vol. 4. 3GPP; TSG Radio Access Network; Further Advancements for E-UTRA Physical Layer Aspects (Release 9), 3GPP Std. TR 36.814, 2010. V. Chandola, A. Banerjee, and V. Kumar, “Anomaly detection: A survey,” ACM Comput. Surv., vol. 41, no. 3, pp. 15:1–15:58, Jul. 2009. J. Han and M. Kamber, Data mining: concepts and techniques, 2nd ed. Morgan Kaufmann, 2006. U. Fayyad, G. Piatetsky-Shapiro, P. Smyth, and T. Widener, “The kdd process for extracting useful knowledge from volumes of data,” Communications of the ACM, vol. 39, pp. 27–34, 1996. N. Rabin, “Data mining dynamically evolving systems via diffusion methodologies,” Ph.D. dissertation, Tel-Aviv University, Tel-Aviv, Israel, April 2010. E. Kassis, “Anomaly-based error detection in base station data,” Master’s thesis, Tel-Aviv University, Israel, 2010. P. F. Brown, P. V. deSouza, R. L. Mercer, V. J. D. Pietra, and J. C. Lai, “Class-based n-gram models of natural language,” Computational Linguistics, vol. 18, pp. 467–479, 1992. Nagao, Makoto, Mori, and Shinsuke, “A new method of n-gram statistics for large number of n and automatic extraction of words and phrases from large text data of japanese,” in Proceedings of the 15th conference on Computational linguistics - Volume 1, ser. COLING ’94. Stroudsburg, PA, USA: Association for Computational Linguistics, 1994, pp. 611–615. W. B. Cavnar and J. M. Trenkle, “N-gram-based text categorization,” in In Proceedings of SDAIR94, 3rd Annual Symposium on Document Analysis and Information Retrieval, 1994, pp. 161–175. M. Haidar and D. O’Shaughnessy, “Topic n-gram count language model adaptation for speech recognition,” in Spoken Language Technology Workshop (SLT), 2012 IEEE, 2012, pp. 165–169. A. Islam and D. Inkpen, “Real-word spelling correction using Google Web 1t n-gram with backoff,” in Natural Language Processing and Knowledge Engineering, 2009. NLP-KE 2009. International Conference on, 24-27 2009, pp. 1 –8. M. Ganapathiraju, D. Weisser, R. Rosenfeld, J. Carbonell, R. Reddy, and J. Klein-Seetharaman, “Comparative n-gram analysis of whole-genome protein sequences,” in Proceedings of the second international conference on Human Language Technology Research, ser. HLT ’02. San Francisco, CA, USA: Morgan Kaufmann Publishers Inc., 2002, pp. 76–81. J. Choi, H. Kim, C. Choi, and P. Kim, “Efficient malicious code detection using n-gram analysis and svm,” in NBiS, L. Barolli, F. Xhafa, and M. Takizawa, Eds. IEEE Computer Society, 2011, pp. 618–621. G. David, “Anomaly detection and classification via diffusion processes in hyper-networks,” Ph.D. dissertation, Tel-Aviv University, Tel-Aviv, Israel, March 2009. F.-L. Luo, R. Unbehauen, and A. Cichocki, “A minor component analysis algorithm,” Neural Networks, vol. 10, no. 2, pp. 291–297, 1997. I. Jolliffe, Principal Component Analysis. Springer Verlag, 1986. R. R. Coifman and S. Lafon, “Diffusion maps,” Applied and Computational Harmonic Analysis, vol. 21, no. 1, pp. 5 – 30, 2006. Z. He, A. Cichocki, and S. Xie, “Efficient method for tucker3 model selection,” Electronics Letters, vol. 45, p. 805, 2009. Z. He, A. Cichocki, S. Xie, and K. Choi, “Detecting the number of clusters in n-way probabilistic clustering.” IEEE Trans. Pattern Anal. Mach. Intell., vol. 32, no. 11, pp. 2006–2021, 2010. F. Angiulli and C. Pizzuti, “Fast outlier detection in high dimensional spaces,” in Proceedings of the 6th European Conference on Principles of Data Mining and Knowledge Discovery, ser. PKDD ’02. London, UK, UK: Springer-Verlag, 2002, pp. 15–26. S. Ramaswamy, R. Rastogi, and K. Shim, “Efficient algorithms for mining outliers from large data sets,” SIGMOD Rec., vol. 29, no. 2, pp. 427–438, May 2000. F. Guillet and H. J. Hamilton, Eds., Quality Measures in Data Mining, ser. Studies in Computational Intelligence. Springer, 2007, vol. 43.
30
Biography Fedor Chernogorov received his M.Sc. with honors in Telecommunications in 2009 from P.G. Demidov Yaroslavl State University, Yaroslavl, Russia. He received M.Sc. in Mobile Technology in 2010 from University of Jyv¨askyl¨a, Jyv¨askyl¨a, Finland. In early 2011 he started his Ph.D. studies at the Department of Mathematical Information Technology of University of Jyv¨askyl¨a. Since 2011 he is also with Magister Solutions, Jyv¨askyl¨a, Finland, where he is currently is taking position of Senior Researcher. He has authored and co-authored 6 conference and 1 journal publications in the fields of cellular mobile communications and data mining. Areas of his interest are self-organizing and cognitive mobile networks, advanced performance monitoring, anomaly detection and data mining. Sergey Chernov received his M.Sc. degree with honors in radio physics and electronics in 2008 in Yaroslavl State University, Russia. Since 2011 he is Ph.D. student at the faculty of informational technologies in the University of Jyv¨askyl¨a, Finland. His current research is focused on Self-Organizing Network concept of Long-Term Evolution mobile cellular networks and the application of data mining and machine learning algorithms to the various radio network data. Kimmo Brigatti received his M.Sc. (Information Technology) in 2011 from University of Jyv¨askyl¨a, Jyv¨askyl¨a, Finland. He has been involved in different research groups on data mining, anomaly detection and wireless network technologies starting from 2009 in University of Jyv¨ askyl¨ a. Kimmo has co-authored two publications N-Gram Analysis For Sleeping Cell Detection in LTE Networks (ICASSP, 2013) and An Approach for Network Outage Detection from Drive-Testing Databases (Journal of Computer Networks and Communications, 2012). Professor Tapani Ristaniemi (SM’11) received his M.Sc. in 1995 (Mathematics), Ph.Lic. in 1997 (Applied Mathematics) and Ph.D. in 2000 (Wireless Communications), all from the University of Jyv¨askyl¨a, Jyv¨ askyl¨ a, Finland. In 2001 he was appointed as Professor in the Department of Mathematical Information Technology, University of Jyv¨ askyl¨ a. In 2004 he moved to the Department of Communications Engineering, Tampere University of Technology, Tampere, Finland, where he was appointed as Professor in Wireless Communications. In 2006 he moved back to University of Jyv¨askyl¨a to take up his appointment as Professor in Computer Science. He is an Adjunct Professor of Tampere University of Technology. In 2013 he was a Visiting Professor in the School of Electrical and Electronic Engineering, Nanyang Technological University, Singapore. He has authored or co-authored over 150 publications in journals, conference proceedings and invited sessions. He served as a Guest Editor of IEEE Wireless Communications in 31
2011 and currently he is an Editorial Board Member of Wireless Networks and International Journal of Communication Systems. His research interests are in the areas of brain and communication signal processing and wireless communication systems research.
32