Department of Computer Science and Engineering .... We employ the coordinate storage (COO) format because it ... engines
Database Support for Bregman Co-clustering Kuo-Wei (David) Hsu and Jaideep Srivastava Department of Computer Science and Engineering University of Minnesota
Outline Introduction Bregman Co-clustering Our OLAP Based Implementation Experimental Results Conclusions and Future Work
Introduction Co-clustering groups rows and columns at the same time Data are in a matrix, where row and column are of different types Example: Movie recommendation People who have similar taste are attracted to similar movies Certain group of movies entertain certain group of people
Bregman co-clustering is scalable and gives better results
Introduction Bregman co-clustering searches for the optimal clustering by
searching for the best approximation matrix, which is close to the original data matrix based on minimum Bregman information (MBI) principle Summary statistics are computed and re-computed to
find the approximation matrix or to approach the optimal clustering Data cube is generally used to manage summary statistics This study finds the mapping between data cube and the Bregman
co-clustering algorithm
Bregman Co-clustering Bregman co-clustering associates co-clustering with discovery of
optimal approximation matrix Use minimum Bregman information (MBI) principle to keep most
information Find the optimal solution iteratively
Building approximation matrix 6 bases are defined, each of which is a set of summary statistics & a blueprint to build approximation matrix Problem and solution It is theoretically scalable, but in practice it is restricted by memory OLAP engine could provide summary statistics naturally
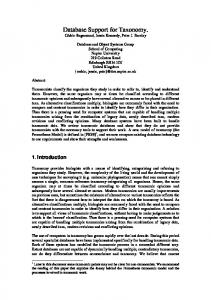
Bregman Co-clustering Algorithm 1.
Randomly generate row clusters and column clusters
2.
Calculate the summary statistics Calculate approximation and update row clusters according to the basis
3.
4.
Calculate approximation and update column clusters according to the basis
5.
Repeat 2~4 till convergence
U
is
a
set
of
rows;
ρ(U):{1,…,m}→{1,…,k} V
is
a
set
of
columns;
γ(V):{1…,n,} →{1,…,l} Squared
Euclidean
Distance
Building Approximation Matrix Reconstruct matrix by summary statistics : Observed : Estimated E[]: Weighted average 6 bases, i.e. ways to reconstruct Z 1: 2: 3: 4: 5: 6:
Basis 1
Avg. of cells in each column cluster + Avg. of cells in each row cluster - Avg. of all cells in given data matrix
Banerjee, A., Dhillon, I. S., Ghosh, J., Merugu, S., Modha, D. S.: A generalized Maximum Entropy Approach to Bregman Co-clustering and Matrix Approximation. Journal of Machine Learning Research, Vol. 8, pp. 1919-1986 (2007)
Basis 2
Avg. of cells in each intersection of column and row clusters, i.e. block average
Banerjee, A., Dhillon, I. S., Ghosh, J., Merugu, S., Modha, D. S.: A generalized Maximum Entropy Approach to Bregman Co-clustering and Matrix Approximation. Journal of Machine Learning Research, Vol. 8, pp. 1919-1986 (2007)
Basis 3
Block average +
Avg. of all cells for each row in given data matrix
- Avg. of cells in each row cluster
Banerjee, A., Dhillon, I. S., Ghosh, J., Merugu, S., Modha, D. S.: A generalized Maximum Entropy Approach to Bregman Co-clustering and Matrix Approximation. Journal of Machine Learning Research, Vol. 8, pp. 1919-1986 (2007)
Basis 4
Block average +
Avg. of all cells for each column in given data matrix
- Avg. of cells in each column cluster
Banerjee, A., Dhillon, I. S., Ghosh, J., Merugu, S., Modha, D. S.: A generalized Maximum Entropy Approach to Bregman Co-clustering and Matrix Approximation. Journal of Machine Learning Research, Vol. 8, pp. 1919-1986 (2007)
Basis 5
Block average +
Avg. of all cells for each row in given data matrix
+
Avg. of all cells for each column in given data matrix
- Avg. of cells in each row cluster - Avg. of cells in each column cluster
Banerjee, A., Dhillon, I. S., Ghosh, J., Merugu, S., Modha, D. S.: A generalized Maximum Entropy Approach to Bregman Co-clustering and Matrix Approximation. Journal of Machine Learning Research, Vol. 8, pp. 1919-1986 (2007)
Basis 6
Avg. of cells for each row in each column cluster + Avg. of cells for each column in each row cluster - Block average
Banerjee, A., Dhillon, I. S., Ghosh, J., Merugu, S., Modha, D. S.: A generalized Maximum Entropy Approach to Bregman Co-clustering and Matrix Approximation. Journal of Machine Learning Research, Vol. 8, pp. 1919-1986 (2007)
Our OLAP Based Implementation Storing matrices in a relational database We store non-zero elements only We employ the coordinate storage (COO) format because it
avoids extra join operations, which are required by compression based approaches
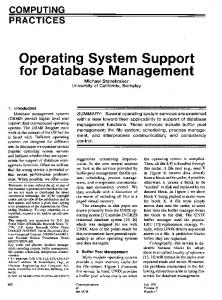
Define the data cube to manage summary statistics
Schema and Cube Matrix: (row INT, col INT, val FLOAT) Rclust: Row clusters col (r_cluster) row val (‘1’)
Z: Data points row col val
Cclust: Column clusters row (c_cluster) col val (‘1’)
SQL to create the cube SELECT Z.row, We can not use AVG directly since Z.col, we only store non-zero elements. 4D cube Rclust.col AS r_clust, A solution is to use SUM and “real” sizes of clusters Cclust.col AS c_clust, AVG(Z.val) AS val FROM (Rclust JOIN Z ON Rclust.row=Z.row) JOIN Cclust ON Z.col=Cclust.row GROUP BY Z.row, Z.col, Rclust.col, Cclust.col WITH CUBE 1st join: attach row cluster # to each cell; 2nd join: attach column cluster # to each cell
Mapping Basis 1 to Cube
Avg. of cells in each column cluster + Avg. of cells in each row cluster - Avg. of all cells in given data matrix
Mapping Basis 2 to Cube
Avg. of cells in each interaction of column and row clusters, i.e. block average
Mapping Basis 3 to Cube
Block average +
Avg. of all cells for each row in given data matrix
- Avg. of cells in each row cluster
Mapping Basis 4 to Cube
Block average +
Avg. of all cells for each column in given data matrix
- Avg. of cells in each column cluster
Mapping Basis 5 to Cube
Block average +
Avg. of all cells for each row in given data matrix
+
Avg. of all cells for each column in given data matrix
- Avg. of cells in each row cluster - Avg. of cells in each column cluster
Mapping Basis 6 to Cube
Avg. of cells for each row in each column cluster + Avg. of cells for each column in each row cluster - Block average
Experimental Results Commodity hardware : PC with 3.0GHz Intel
Xeon processor and 2 GB RAM Runtime performance on datasets from a variety of application domains Matrix decomposition Bioinformatics Document clustering Collaborative filtering (CF) based recommendation
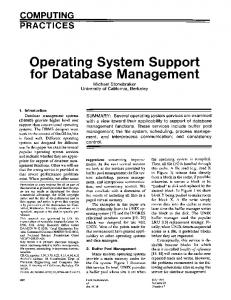
Matrix Decomposition af23560
Figures show runtime in seconds for 6 bases
e40r5000
fidapm11
memplus
Bioinformatics
yeast
Figures show runtime in seconds for 6 bases
lymphoma
Max 10 iterations yeast
Max 100 iterations
Document Clustering
Figures show runtime in seconds for 6 bases
enron
kos
nips
CF Based Recommendation
BookCrossing: The size is 6,838 by 5,642 and there are 90,613 non-zero elements
Runtime in seconds for 6 bases
Clustering quality, is mean absolute error (MAE), for 6 bases Runtime in seconds for 6 bases
Clustering quality, is mean absolute error (MAE), for 6 bases
Conclusions and Future Work Bregman co-clustering It iteratively finds the optimal approximation matrix 6 bases are defined as blueprint to build approximated matrices Our contribution: Making it even more scalable Mapping Bregman co-clustering bases to data cube (OLAP) OLAP based implementation can handle datasets too large (in
rows AND columns) to fit in memory
Future work: From “data” perspective, moving this to other data storage
engines or cloud computing platforms From “mining” perspective, extending this to multidimensional co-clustering
Acknowledgements We would like to thank Dr. Arindam Banerjee for advice and
practical discussions on Bregman co-clustering algorithm.