waste management problem in Roorkee Township. The Ganga canal (erstwhile Ganga canal) is a canal system that irrigates the Doap region between Ganga ...
Research Article ISSN 2277–9051 International Journal of Remote Sensing and GIS, Volume 1, Issue 1, 2012, 2-11 © Copyright 2012, All rights reserved Research Publishing Group www.rpublishing.org
Decision Support System for Selecting Suitable Site for Disposing Solid Waste of Township Gaurav Shukla1, M. Shashi1 & Kamal Jain2 1
Indian School of Mines, Dhanbad Indian Institute of Technology Roorkee
2
Abstract: Generation of solid waste in urban area is obvious result of increasing growth of urbanization, increasing per capita income, and improving living standards in developing countries. Most of site selection methods lack practical applications. This is due to the number of variables and complexity of the mathematical models which include the factors and constraints required in decision making. A suitable disposal site must have environmental, resource, and planning criteria that will enable the wastes to be isolated so that there is no unacceptable risk to people or the environment. In this project Decision Support System is used for selecting suitable site for disposing solid waste in and around Roorkee area, city of Indian state Uttarakhand. Criteria in present study uses three main factors: environment, planning and resource. Weighted linear combination method has been used for combining different factors and pair wise comparison matrix has been used for developing suitable weights in our project. Keywords: Decision support system, solid waste, landfill site selection. 1.
Introduction
Urban solid waste management is considered as one of the most immediate and serious environmental problems confronting municipal authorities in developing countries like India. The most common problems associated with inadequate sanitation of solid waste include diseases transmission, odor nuisance, atmospheric and water pollution, and economic losses. Inadequate sanitation cost India almost $54 billion per year this is 6.8% of 2006 GDP of India (World Bank Report, 2010). In the major cities in India, per capita production of solid waste varies from 0.2kg/day to 0.6kg/day. Collection efficiency of solid waste is very low. Collection efficiency ranges between 50% to 90% of the solid waste generated (Akolkar, 2005). Management including collection, transportation and disposal of municipal solid waste is mostly unscientific in India which demands immediate attention. The location of disposal sites in India done without consciousness about the environmental and public health hazards arising from disposing of waste in improper location (Gupta et. Al., 1998). Selection of disposal site is not located considering residential area, clinic/hospital, educational institution, drainage network, socio cultural and religious institution. The selection of appropriate technologies and the design of sustainable solid waste management system is not only a technical issue but involve multi-thematic criteria (Klundert, 2000). Objective to locate best suitable site for selecting suitable site involves multi criteria. Most of site selection methods lack practical applications. This is due to the number of variables and complexity of the mathematical models which include the factors and constraints required in decision making (Yashwant et. Al., 2010). A suitable disposal site must have environmental, resource, and planning criteria’s that will enable the wastes to be isolated so that there is no unacceptable risk to people or the environment. Solid waste management also involves conflicts, especially in Indian urban area with high density of population and irregular urban growth. Several Researchers (Oweis et. al (1990) & Wentz (1989)) have pointed out that site selection must take a number of planning criteria into consideration in order to be satisfactory. The identification of potential sites for new waste management facilities has to be undertaken with regard to planning criteria which recognize the various sitting constraints: physical, safety, environmental, political and technical (Petts & Edullee, 1994). Decision support system can assist a planer in solid waste management by providing opportunity to integrate different criteria on site selection. This approach allows for greater flexibility in site selection, especially with respect to local circumstances. Weighted linear combination aggregation procedure not only allows us to retain
2
Shukla et al. /International Journal of Remote Sensing and GIS, Volume 1, Issue 1, 2012, 2-11
the variability from our continuous factor, it also provides the ability to have our factors trade off with each other. A low suitability score in one factor for any given location can be compensated by a high suitability score in another factor. Weighted linear combination method has been used for combining different factors and pair wise comparison matrix has been used for developing suitable weights in our paper. The paper aims to develop environment, planning and resource based criteria for selecting suitable site for disposing solid waste for the urban areas of developing country like India. The criteria developed on the basis of criteria used by other countries and International Organizations and Indian legislation and policies on waste disposal, in particular, waste disposal by land filling. Furthermore, a case study will be presented to emphasis the simplicity and practicality of the developed concept as applied in the Roorkee Township in the India. 2.
Study Area
Roorkee is city of Indian state Uttarakhand. Geographical location of city is 29.87°N and 77.88°E (Datum Surface: WGS 84). Its elevation is 879 ft (268 m) above mean sea level. Radius of Roorkee is taken as approximate 4 km. It is located on the banks of the Ganges canal on the national highway between Delhi and Dehradun. As of 2001 India census Roorkee had a population of 252,784 (Census of India, 2001). Per capita production of waste is 0.4kg/day in Roorkee (Akolkar, 2005). About 105 ton solid wastes daily led to serious waste management problem in Roorkee Township The Ganga canal (erstwhile Ganga canal) is a canal system that irrigates the Doap region between Ganga River and the Yamuna River in India. Upper Ganga Canal has since been enlarged gradually for the present head discharge of 295 m³/s (Petts & Edullee, 1994). Winds flow gases on earth on a large scale. In outer space, solar wind is the movement of gases or charged particles from the through space sun, while planetary wind is the out gassing of light chemical element from a planet's atmosphere into space. Winds are commonly classified by their spatial scale, their speed, and the types of forces that cause them, the regions in which they occur, and their effect. In meteorology, winds are often referred to according to their strength, and the direction the wind is blowing from Short bursts of high speed wind are termed gusts. Strong winds of intermediate duration (around one minute) are termed squalls. Long-duration winds have various names associated with their average strength, such as breeze, gale, storm, hurricane, and typhoon. Wind occurs on a range of scales, from thunderstorm flows lasting tens of minutes, to local breezes generated by heating of land surface solar energy and lasting a few hours, to global winds resulting from the difference in absorption of between the climate zones on Earth. The two main causes of large scale atmospheric circulation are the differential heating between the equator and the poles, and the rotation of the planet. Within the tropics, they allow circulations over terrain and high plateaus can drive monsoon circulations. In coastal areas the sea breeze land breezecycle can define local winds; in areas that have variable terrain, mountain and valley breezes can dominate local winds. 3.
Methodology
Methodology is a logical as well as systematic part of the study to guide scientific investigation. A frame work involves a process or technique in which various stages or steps of collecting data or information are explained. The frame work of this study covers some sequential steps. The decision making process for selecting suitable site for disposing solid waste has been structured into three main phases 1.
Analysis Phase: Develop Limitation on choice and Maps for each factors and constraints
2.
Decision Phase: Set of weights need to be developed that can dictate the relative influence of each of the factors in the production of suitability map. Suitability Phase: The constraints and factors along with their associated weights need to be combined in order to produce the suitability map. Check suitability of site and if site does not meet with planner requirement then go to first and second phase.
3.
3.1
Developing Criteria for Site Selection:
Site selection criteria usually address issues such as the safety of transport routes; the proximity of the site to residential areas; the chances of contaminants polluting a watercourse or aquifer and access. The World Health
3
Shukla et al. /International Journal of Remote Sensing and GIS, Volume 1, Issue 1, 2012, 2-11
Organization (WHO) has developed a recommended set of exclusionary criteria based on; unstable or weak soils, subsidence, saturated soils, surface water areas, major natural hazards, historic locations and sensitive locations. As these criteria are exclusionary, in other words, conditions under which the sitting of a waste management facility would be considered unacceptable. Melbourne and Metropolitan Board of Works has developed a criteria that includes preferred as well as exclusionary criteria based on; topography, surface soils, atmospheric conditions, population density and water supply. All Criteria has been divided into three categories. A suitable disposal site must have environmental, resource, and planning criteria’s that will enable the wastes to be isolated so that there is no unacceptable risk to people or the environment. Criteria for selecting site have been classified in three classes. The proposed criteria for site selection (Table 1) show in three main categories
Table-1: Environment, Resource and Planning Criteria Consideration
Component
PLANNING
1.Sensitive Locations 2.Population Density 3.Proximity To Road 4.Civil Construction Condition [Land Elevation or Contour]
ENVIRONMENT
1.Soil Subsidence 2.Surface Water And Drainage 3.Atmospheric Condition
RESOURCE
1.Agriculture Land , Forest , Park 2.Historical Location ,Archeological Site
Constraints Criteria have been organised as a set of Boolean rules and factors has been organized as a set of fuzzy rules with a degree of linear membership from 0 to 255. In terms of criteria justification, from a planning viewpoint, it is impractical to have a landfill located in an urban area, as a parcel of land of the size required for a disposing solid waste would be unobtainable and very expensive. It would also be contrary to health and safety laws explain in schedule II (rule1, 2) of management of municipal solid waste rule 2010, describe by Ministry Of Forest And Environment, India. It is important to locate the disposal site as close to the origin of the waste as possible as planning view point. Degree of Suitability (Table-2) of site has been classified in three classes on the basis of criteria’s social, economic, environment and health impacts. The degree of suitability for criteria developed on the basis of criteria used by other countries and International Organizations and Indian legislation and policies for pollution prevention and water quality monitoring (Management of Muncipal solid waste rule, 2010) on waste disposal site. 3.2
Selecting Disposal Site in Roorkee (India)
The Roorkee area is of particular planning interest as it includes many sites of conservation and historic interest as well as large expanses of high quality agricultural land of within the area. : The project area has elevation from 204m to 325m. The investigation ensured that all of the constraints were taken into consideration. To achieve this, a map layers have been created for each constraint and factors. The data sets about land use pattern, population density, sensitive location, were generated from available Google Earth data and remotely sensed data. Land use map has been created from digitizing different polygon feature: agricultural land, high dense and low dense population area, water bodies, barren land, forest land and line features: major transportation lines and minor transportation lines, rivers. Barren land has been checked by comparing (using chain detection, supervised classification and swiping) two years LANDSAT remote sensing data and Google Earth image (February 2000 and June 2009 image). Roorkee area does not have any barren land therefore our next preference has been went to agriculture land (Table-2). Suitability for constraints 5 and 6 for site has been
4
Shukla et al. /International Journal of Remote Sensing and GIS, Volume 1, Issue 1, 2012, 2-11
checked after aggregating all criteria using weighted linear combination method for aggregation (Phase Third In Decision Frame Work). Table-2: Degree of Suitability Highly Suitable 1km
Suitability Class Moderately Suitable 500m
Less Suitable 100m
Low dense
Moderate dense
High Dense
100m
200m
500m
Elevation Criteria Surface Water Drainage
Slope < 9° 200m 100m
Slope 9°-15° 100m 75m
Slope > 15° 50m 50m
Forest Soil And Atmosphere
500m Non subsidence area, Low Rain Region Barren Land As Far As possible
400m
300m
Agriculture Land -----------
-------------------------
Criteria Planning
Environment
Resource
Sensitive Location ( College,) Population Density Proximity To Road
Land Use Historical Location
Table-3: Criteria for Project Area Criteria
Constraint
1. Land Use Constraint
(Barren land if available) Agriculture land
2. Surface Water Constraint
Not be located within 50 m and more suitable > 200 m Located between 100 m and 500 m Elevation between 203m to 230 m Avoid sensitive location Water table shall be at least two meter below Highly suitable Near The road, avoid 50 m distance from road Avoid high densely populated area
3. 4. 5. 6.
Road Constraint Lower Elevation Constraint Sensitive Location Water Level
1. Proximity To Road Factor Factor
2. Public Health And Safety Factor 3. Proximity To Urban Area
Area greater than 10km need to excluded
Constraint maps have been created applying Boolean approach and factors maps have been created after applying Fuzzy approach with linear membership function from 0 to 255. Using Fuzzy mathematical model, distance image from feature has scaled on a continuous basis.
5
Shukla et al. /International Journal of Remote Sensing and GIS, Volume 1, Issue 1, 2012, 2-11
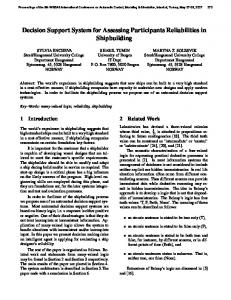
Fig.1: Digitized layer of Rivers
Fig. 2 Digitized Line Raster image Of Roads
6
Shukla et al. /International Journal of Remote Sensing and GIS, Volume 1, Issue 1, 2012, 2-11
Fig. 3 Land use image created by digitizing different layers in Google Earth
Fig: 4 Roorkee Area digitized in Google Earth Image
7
Shukla et al. /International Journal of Remote Sensing and GIS, Volume 1, Issue 1, 2012, 2-11
Fig: 5: DEM of Roorkee Region (From Open Source Site for DEM www.asterdem.com)
3.3
Creating Criteria Map
Criteria can be of two types: factors and constraints. Factors are continuous in character and serve to enhance or diminish the suitability of the land for particular application depending upon the magnitude of the variable in question. Constraint on the other hand is Boolean in character. They serve to exclude certain area from consideration .Land suitability problem involves both kinds of criteria. 3.3.1 Creating Constraint Map 1) From land use map total project area can be divided into four categories i) Forest land (no forest land in Roorkee Region) ii) Agricultural land iii) Residential land iv) Water body and major road. Only agriculture land is open for consideration in the allocation of land for landfill. Constraint map related to land use created by EDIT and ASSIGN. The output image is Boolean image where, value 1 is for agricultural land and value 0 for all other types of land. 2) The distance between the discharged waste material and the nearest surface water is to be a minimum of 100 meters. We create buffer of 100 meters around water body. In the Boolean image suitable area have a value 1. 3) The distance between the discharge waste material and the nearest transportation line is to be a minimum of 100 meters. We create buffer of 100 meters around transportation lines. In the Boolean image suitable area have a value 1 (buffer area have value 0). 4) In elevation constraint only suitable elevation is from 204 meters to 230 meters. Therefore we create Boolean image have 1 for suitable elevation and 0 for other elevation range. We reclass the image for two elevation ranges first is suitable elevation range from 204 meters to 230 meters (assigning value 1) and second is elevation greater than 230 meters (Assigning value 0 ). 3.3.2 Creating The Factor Maps: 1) Now create the proximity to roads factor map. In this case suitability function linearly depends on distance from roads. Suitability inversely proportional to distance from the road. It means high suitability near the road
8
Shukla et al. /International Journal of Remote Sensing and GIS, Volume 1, Issue 1, 2012, 2-11
and low suitability at distant from road. Using Fuzzy mathematical model, distance image from road feature has scaled on a continuous basis.
2) Public health has priority over all issues for any Government. In this factor, suitability directly proportional to distance from urban area. It means low suitability near the urban area and high suitability at distant from urban area. Using Fuzzy mathematical model, distance image from urban area has scaled on a continuous basis. 3) The last factor image that we have to create is proximity to urban area. This factor has importance due to economical issue, tendency to decrease transportation cost. Most suitable land is that which is near to main source of waste, i.e. urban area. In this case suitability inversely proportional to independent variable, distance from the urban area. Fuzzy is used for continuous scaling of suitability from range 0 to 255. 3.4 Weighting the Criteria Here pair wise comparisons associated with the Analytical Hierarchy Process (AHP) to weight the factors has been used. Pair wise comparison matrix is created by setting out one row and one column for each factor in the problem. Method of pair wise comparison is used in the scientific study of preferences (Saaty, 2006) First it is defined that which factor is more necessary than other factor in pair wise comparison matrix (Table-4). Judgment is made about the relative importance of factors involved, in making these judgment 9 point scaling has been used (Saaty, 2006; Thurstone, 1929; Thurstone, 1927). Table-4: Relative Importance of Factor Extremely Less important
1/9
Very Strongly less important
1/7
Strongly less important
1/5
Moderately less important
1/3
Equally important
1
Moderately more important
3
Strongly more important
5
Very Strongly more important
7
Extremely more important
9
Pair wise Comparison Matrix
Factor1
Factor2
Factor1
1
Factor2
1.125
1
Factor3
1.124
0.985
Factor3
1
As far as local government concern, public health is more important than other factors. It has been assigned 1.125 relative to proximity to road factor in pair wise comparison matrix. That means public health factor has strongly importance than proximity to road factor. The rating of importance of one factor over other factor has taken on the basis of suitable consistency ratio (probability that pair wise rating were developed at random). Model used the normal distribution (Thurstone, 1929)..Consistency ratio should be less than 0.10. If the consistency ratio is less than 0.10 then weights calculated by pair wise comparison matrix will be best fit weights (Thurstone, 1929; Thurstone, 1927). The best fit weights has been calculate for factor1, factor2, and
9
Shukla et al. /International Journal of Remote Sensing and GIS, Volume 1, Issue 1, 2012, 2-11
factor3 respectively are 0.3078, 0.3479, 0.3443 with constituency ratio 0.01 (acceptable range).Weighted linear combination method has been used for aggregating all constraints and factor with their relative weights. 3.5
Multi-Criteria Evaluation: Best Suitable Land
Now that we have a set of weights to apply to the factors, we can undertake the final multi criteria evaluation of the variable. Result of image provides multi choices of land suitable for Landfill Operation with variable suitability scale 0 to 255 (image has suitability range 0 to 154, no land has suitability of above than 154). 4.
Results
The suitability map created is shown in Fig. 6. The map shows the varying ranges of suitability for locating a site for disposing solid waste throughout the study area, according to the criteria given in table 3 and their weights. The suitability scale ranges from "ideal" (class 255) to "impossible' (class 0). Result of image provides multi choices of land suitable for solid waste disposing operation with variable suitability scale 0 to 255 (image has suitability range 0 to 154; no land has suitability of above than 154). A set of two best potential sites were identified .The sites were ranked on the basis of area availability. Sites D1 and D2 are the best suitable disposing sites with suitability score 154 for solid waste with area 68060 square meter, and 66799 square meter, and distance from Roorkee center is 7588 meters and 8228 meters respectively
Fig.6: Selected area for Landfilling 5.
Conclusions
This paper explains an approach for identifying the optimum site for disposing solid waste in a typically urbanizing city. An approach was employed in conjunction with Decision Support System based weighted linear combination and pair wise comparison analysis to identify the most suitable site for disposing solid waste in the Roorkee region. The study was based upon a set of key criteria, which were selected based upon the already available knowledge from research literature as well as the pre-existing local level factors of the area. The superiority of the proposed approach stems from its inherent flexibility in its application to different sites with diverse local conditions. Although the basic factors to be assessed for disposing sites are universally the same, different area may have different sets of local conditions. Hence the sets of important criteria, as well as the important ranking and weighting values, have to be optimized on the basis of site-specific conditions. Furthermore, the uniqueness of the present approach stems from the fact that the environmental factors were deemed as the primary governing factors in the study. It has been identified that the impacts produced to the neighboring environment as a result of disposing solid waste cause’s secondary impacts upon the health and socio-economic conditions.
10
Shukla et al. /International Journal of Remote Sensing and GIS, Volume 1, Issue 1, 2012, 2-11
REFERENCES Akolkar, A.B. (2005). “Status of Solid Waste Management in India, Implementation Status of Municipal Solid Wastes.” Management and Handling Rules 2000, Central Pollution Control Board, New Delhi Barlaz, M., Gregory, C., Cekandar and N. C. Vasuki (2003). “Integrated Solid Waste Management in the United States.” Journal of Environmental Engineering, 129(7), 583-584. Census of India (2001), office of registrar general & census commissioner, Ministry Of home Affairs, Government of India Katpatal, Y.B. and Rama Rao B.V.S. (2010). Urban Spatial Decision Support System for Municipal Solid Waste Management in Nagpur urban area using high resolution satellite data and GIS. Journal of Urban Planning and Development, 137(1), 65-76. doi: http://dx.doi.org/10.1061/(ASCE)UP.1943-
5444.0000043 Gupta, S., Mohan, K., Prasad, R., Gupta, S. & Kansal, A. (1998). “Solid Waste Management in India: Options and Opportunities.” Resources, conservation and Recycling, 24, 137-154 Klundert, A. van de (2000). UWEP Programme Policy Meeting II. Workshop report.15-20 February 2000, Bangalore, India Management Of Municipal Solid Waste Rule 2010 describe by Ministry Of Forest And Environment, INDIA Oweis, L. S. Khera, R. P. (1990). Geotechnology of waste management. Butterworth and Co.Ltd.London Petts, J. Edullee, G. (I994). Environmental Impact Assessment for Waste Treatment and Disposal Facilities. John Wiley and Sons, Chichester Saaty, Thomas L. (2008). Relative Measurement and its Generalization in Decision Making: The Analytic Hierarchy/Network Process. RACSAM (Review of the Royal Spanish Academy of Sciences, Series A, Mathematics) Thurstone, L.L. (1929). The Measurement of Psychological Value. In T.V. Smith and W.K. Wright (Eds.), Essays in Philosophy by Seventeen Doctors of Philosophy of the University of Chicago Wentz, C. A. (1989). Hazardous Waste Management. McGraw Hill, London.
11