constraints, information on the composition of the il- litic phases and their ...... illite-smectite interstratification: Clay Miner. 22, 269-285. Drits, V. A. ... Pleistocene sediments of the Colorado river delta, southern. California: J. Sed. Petrol.
Clays and Clay Minerals, Vol. 40, No. 6, 629-643, 1992.
DECOMPOSITION OF X - R A Y DIFFRACTION PATTERNS: A CONVENIENT W A Y TO DESCRIBE COMPLEX I/S DIAGENETIC EVOLUTION BRUNO LANSON~ AND BRUCE VELDE Laboratoire de G~ologie, Ecole Normale Sup6rieure, 24 rue Lhomond, 75231 Paris Cedex 05, France Abstract--Decomposition of complex X-ray diffraction profiles is used on well characterized (image analysis of transmission electron micrographs, X-ray fluorescence chemical analyses) diagenetic samples from the Paris basin. The simultaneous occurrence of three "illitic" phases (mixed-layer illite/smectite or I/S, poorly crystallized illite, and mica-like phase) is shown on the various diffraction peaks of the 250 ~ CuKa (44-1.8 ]k) range. However, because of theoretical and experimental constraints, it is easier to perform the decomposition routine in the 5-11 ~ C u K a (17.6-8.0 ~) range. The identification (i.e., illite content and mean coherent scattering domain size) of the various phases is performed by comparing the associated elementary peak characteristics (position, full width at half maximum intensity) with simulated X-ray patterns. When available, the characteristics obtained from the various angular regions are mutually consistent; however, the precise structures of smectite and illite end-members, on the one hand, and the structure of I/S crystallites, on the other hand, are not well known. Consequently, on some angular regions, there is a discrepancy between the characteristics obtained on experimental and calculated X-ray profiles. The definition of more realistic simulation hypotheses for I/S minerals, and for other interstratified clay minerals, would make this powerful and reliable tool to describe X-ray patterns a precise and sensitive identification tool even for complex clay parageneses. Key Words--Decomposition, Diagenesis, Illite, Illite/smectite, Mixed-layering, Simulation, X-ray powder diffraction.
INTRODUCTION The extensively described smectite-to-illite diagenetic evolution is not as simple a transformation as it is widely assumed when depicted schematically by a simple illite content vs depth trend. An important kinetic effect has been shown by comparing, in various sedimentary basins, the evolution o f mixed-layer illite/ smectite (I/S) with the m a x i m u m temperature experienced by the sediments (Lahann, 1980; Srodon and Eberl, 1984; Velde, 1985; Velde et al., 1986; Jennings and Thompson, 1986; Freed and Peacor, 1989), and/ or with organic matter maturation (Smart and Clayton, 1985; Velde and Espitali6, 1989; Francu et al., 1989). As a result o f this kinetic effect, the late stage diagenetic clay mineral assemblages in the Paris basin contain several phases* (I/S phases) with distinct, but closely related crystallographic characteristics (Lanson and Champion, 1991). Taking into account the coexistence and simultaneous evolution o f randomly interstratified and ordered I/S, Velde and Vasseur (1992) proposed
' Present address: EAP-CSTJF, Laboratoire de G6ochimie Min6rale, 64018 Pau Cedex, France. * In this paper, the word "phase" describes a population of particles whose physicochemical characteristics vary about a mean value. It is assumed that this population behaves as a monophasic material (in a thermodynamic sense) having the same mean characteristics. Consequently this word is used in the thermodynamic sense throughout the paper for this material. Copyright 9 1992, The Clay Minerals Society
a kinetic model for this transformation based on two first-order reactions (random to ordered I/S, and ordered I/S to illite) to obtain a simplified (e.g, the illite growth is not taken into account) but realistic description o f such complex systems. Because o f the coexistence o f several argillaceous phases in the same sample, X-ray diffraction (XRD) patterns of diagenetic series most often contain partially overlapping peaks representative o f mixed-layered I/S, illite, mica, and occasionally chlorite. The separation o f the contributions from these different phases is essential for their characterization by most of the usual identification methods (Srodon, 1979; Velde et al., 1986; Watanabe, 1981, 1988; Tomita et al., 1988; Moore and Reynolds, 1989). Other methods o f interpretation require measurements on higher-angle peaks (Srodon, 1980, 1981, 1984), and they are difficult to perform routinely because of the low intensity o f these peaks and frequent overlap with other phases. The trial and error crystallographic simulation approach, widely used on monophasic samples (Tchoubar, 1980; Besson, 1980; Pons et al., 1981, 1982; Ben H a d j - A m a r a et al., 1987) as well as on pure mixed-layer minerals (Sakharov and Drits, 1973; Reynolds, 1980; Srodon, 1980 and 1984; Inoue et al., 1990; Drits et al., 1990), may also be used to model complex polyphasic X R D profiles (e.g., Lanson and Besson, 1992). However, this m e t h o d is so time-consuming that its routine application on dozens o f samples is unrealistic. Lanson (1990, 1992) developed a decomposition 629
630
Lanson and Velde
program for X-ray profiles o f clay minerals that enables the separation o f the contributions o f various phases to the diffracted intensity. This decomposition program can fit a peak on the experimental X R D pattern with up to six elementary curves related to the different phases in the sediment. The position and full width at half m a x i m u m intensity ( F W H M ) o f these elementary curves are used to identify each phase by comparison with simulated patterns. Very m i n o r experimental limitations (see below) make this decomposition m e t h o d a powerful and reliable tool to describe X-ray patterns (Lanson and Besson, 1992). However, because of the very specific characteristics presented by clay minerals X R D profiles, commercially available numerical treatment packages are to be used with caution (Lanson, 1992). In the low-angle region (5-11 ~ CuKa; 17.6-8.0 ~ ) the diffraction peaks o f monophasic I/S are symmetrical despite the theoretical restrictions (Lanson and Besson, 1992). In the present paper it is shown that the peak symmetry exists also in higher angle region (e.g., 45.3 ~ CuKa; 2.00 ~,). In spite o f contrary statements (Howard and Preston, 1989; Stern et al., 1991), the Gaussian shape is also shown to be well adapted to describe poorly crystallized illite and I/S peaks, while mica and chlorite peaks are more Lorentzian (usually modified Lorentzian). Consequently, it is recommended that one uses a decomposition program that incorporates different functions or combinations of them at the same time. The use of a function including a shape parameter (e.g., Pearson7 or Voigt) is not recomm e n d e d when fitting higher angle regions (15-50 ~ CuKa; 5,9-1.8 ~). Lanson and C h a m p i o n (1991) used the decomposition program developed by Lanson (1990, 1992) on the 5-11 ~ C u K a (17.6-8.0 ~ ) range to show the simultaneous occurrence o f three "illitic" phases in their Paris basin samples and to follow their evolution with burial. However, major discrepancies between the F W H M of experimental and simulated patterns, described previously by Reynolds and Hower (1970) and Reynolds (1989), do not permit the precise identification of these phases (Lanson, 1990). The present paper does not solve this peak width problem. Instead, it attempts to extend the work o f Lanson and Besson (1992) by looking at higher-angle (15-50 ~ CuKa; 5.9-1.8 A) peaks o f the I/S phases to show: 1) that it is possible to demonstrate the existence of the three illitic phases with the decomposition o f any o f these peaks; 2) that because o f theoretical and experimental constraints, information on the composition of the illitic phases and their crystallinity is easier to obtain on the 5-11 ~ C u K a (17.6-8.0 A) range rather than at higher angles; 3) that it is possible to match the F W H M o f experimental and simulated patterns and, thus, to identify precisely the various I/S phases when looking at the 26.75 ~ C u K a (3.33 ,~) and the 45.3 ~ C u K a
Clays and Clay Minerals
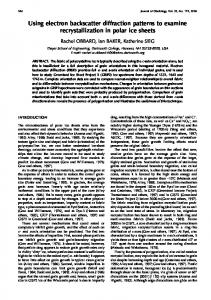
(2.00 A) regions; 4) that the characteristics (illite content and mean coherent scattering d o m a i n size) o f the various I/S phases obtained from the angular regions studied (5-11 ~ CuKa; 17.6-8.0 ~ ; 17.7 ~ CuKa, 5.00 ~; 26.75 ~ CuKa; 3.33 ,~; 45.3 ~ CuKa; 2.00 A) are mutually consistent when available; and 5) that, if the agreement between experimental and simulated I/S patterns is good in the higher angle region (25-50 ~ CuKa; 3.55-1.8 A), there are m a j o r differences not only in the 5-11 ~ C u K a (17.6-8.0 ~ ) range but also in the 17,7 ~ C u K a (5.00 ~ ) region. EXPERIMENTAL METHODS Samples The samples studied are drill cuttings from the 2150 m deep borehole C in the eastern Paris Basin near the town o f Nancy (supplied by the Institut Fran~ais du P&role). Lanson and C h a m p i o n (1991) described the stratigraphic sequence. Characteristic X R D patterns of oriented air-dried (AD) samples from this borehole are shown in Figure 1. Four samples, characteristic o f the I/S transition stages, were selected from the original sixty two used to define the general diagenetic trend. The essential criterion for their selection (from 1000, 1550, 1730, and 2130 m depths) was the absence, or the very low abundance, o f accessory phases such as chlorite, kaolinite or carbonates (Lanson and Champion, 1991). In order to constrain the n u m b e r of elementary peaks to be fitted on the various diffraction m a x i m a o f the experimental patterns, it was necessary to get additional information based on direct observation methods to determine the actual n u m b e r o f phases present in the sample. Lanson and C h a m p i o n (1991) performed TEM morphological studies on the samples used for this paper and identified two populations o f particles: lath-shaped particles and hexagonal plates. Analyzing individual particles by X-ray fluorescence (Energy Dispersive Spectroscopy) on T E M they established that the chemical compositions o f the two particle types are different. The chemical composition of the laths was consistent with an I/S structure and varied as a function of depth, indicating a decrease in their smectite content. The composition o f hexagonal plates was that o f illite and did not change with depth. Throughout the sequence they showed, using decomposition o f X R D profiles, the coexistence o f the I/S mixed-layer phase, the illite phase, and a mica-like phase, as well as occasional chlorite a n d / o r kaolinite. The micaceous phase was assumed by these authors to be detrital because it was present near the surface and showed no evolution with depth. This phase was related to a few irregular thick (highly absorbing) grains observed on TEM; however, one should note that it is unrealistic, even with a decomposition program, to distinguish the respective contributions to an X R D
Vol. 40, No. 6, 1992
Decomposition of polyphasic I/S XRD patterns
profile ofa detrital muscovite and of a well-crystallized authigenic illite. The "detrital" label given by Lanson and coworkers to this micaceous phase is based only on a "crystallinity" criterion (FWHM of the diffraction peak) and may not be valid. In the present paper, this well-crystallized micaceous phase is called mica-like phase to avoid any assumptions on its origin. For the present study, eight additional samples (from 300, 350, 1080, 1305, 1475, 1645, 1850, and 1945 m depths) representative of the diagenetic trend were added to the four studied in detail by Lanson and Champion (1991) in order to provide an expanded evaluation of the decomposition method. The morphological and chemical data available on the Lanson and Champion samples (1991) were also important as an independent control on the results deduced from X R D profile numerical treatment, especially so to check the n u m b e r of independent phases contributing to the diffraction intensity of the peaks. An additional sample (WS7-115.45 m) was selected from the hydrothermal series of samples studied by Inoue et al. (1978, 1987, 1988), Inoue and Utada (1983), and Inoue (1986) to check the experimental peak shape. This sample is an 85% illite I/S (R = 3).
631
7.12 A ! 5.00 A
10.00 A:
i
0
5
10
~ ::3.33A
12.50 A
i2.00 A
Iti
15
20
25 ~
30
35
40
45
50
CuKa
Figure 1. Examples of XRD patterns of oriented, air-dried clay samples from the deep well in the Paris Basin, France.
Sample preparation and processing The < 2 #m fraction was separated from the whole rock and resuspended in distilled water. After 24 hours of sedimentation, the upper six centimeters of the suspensions, containing approximately the < 1.0 ~m, were extracted. Then, this fraction was collected on a Millipore filter (0.4 tzm) to provide an optimal orientation (Reynolds, 1986), and transferred onto a glass slide. No exchangeable cation was added because Lanson and Besson (1992) compared patterns of Sr-saturated and untreated samples for some typical samples and found no differences. Relative humidity was not controlled during data collection. The oriented specimens were run on a Siemens D500 diffraction system (USGS, Denver, Co) using C u K a radiation, a graphite m o n o chromator, 1~ divergence and receiving slits, and the Siemens D5000 software running on a Microvax 2000 (see Table A1 for additional information). Step size and counting times were respectively 0.01-0.02 ~ and 3-10 seconds.
X-ray pattern numerical treatment--DECOMPXR The raw patterns were converted to an ASCII format, transferred to an IBM-compatible computer, and treated with DECOMPXR, the decomposition program developed by Lanson (1990, 1992). The structure, performance, and limitations of this program are presented in detail by Lanson (1990), Lanson and Champion ( 1991), and Lanson and Besson (1992). Basically, the treatment of a raw file begins with a preliminary smoothing to decrease the effect of statistical counting errors. Then, a "background" is subtracted to eliminate
most of its contribution to the peaks. Finally, the fit is performed either with a least squares method (Press et al., 1986) or with a non-linear downhill simplex method (Nelder and Mead, 1965; Press et al., 1986) when the least squares method would diverge. Position, F W H M , and intensity of every peak are adjusted until the m a x i m u m precision criteria (95% illite), but the CSDS is much lower (about 6 12 layers) in contrast to the mica-like phase. The composition of the I/S phase is around 90% illite, which is high according to the chemical composition measured on the lath-shaped particles by Lanson and Champion (1991). Their results would indicate an illite content varying from 70% to 85% illite. The CSDS of this I/S phase is about 3-7 layers.
Consistency o f the results from the various angular ranges. As described above, the fitted F W H M of the various elementary peaks are unchanged in the differ-
S U M M A R Y A N D CONCLUSIONS Because the decomposition method is easy and fast to perform, it can be used as a descriptive tool on a great n u m b e r of samples. Its m i n o r experimental limitations (Lanson, 1990; Lanson and Besson, 1992) make this method a powerful and reliable tool to describe X-ray patterns. However, the warnings formulated by Lanson and Besson (1992) must be obeyed by the user. 1) Verify over the whole angular range (2-50 ~ CuKa; 44-1.8 ~), and between the various profiles (AD, EG, heated) obtained from the same sample the consistency of the identification (within less than 5% illite for I/S composition and within a few layers for CSDS deter-
Vol. 40, No. 6, 1992
Decomposition of polyphasic I/S XRD patterns
639
Table 3. Illite content and mean coherent scattering domain size (CSDS) of the phases producing the three elementary peaks fitted to the various diffraction peaks of sample C1730 (data acquisition on the Siemens XRD system). The values are determined by comparison with calculated patterns (see text). Mica-like Angular range
5-11 ~ CuKa (17.6-8.0/k) 17.7 ~ CuKa (5.00 ~) 26.75 ~ CuKa (3.33 /~) 45.3 020 CuKa (2.00/k)
Illite
Illite content
CSDS
96% NA 97% 96%
22-25 NA 22-25 22-25
Illite content
100%
NA 99% 100%
I/S CSDS
Inite content
CSDS
6-9 NA 6-9 6-9
NA NA 91% 92%
NA NA 6-9 4-7
NA: identification data not available because of the mismatch between experimental and simulated position-FWHM values.
mination). 2) Verify that the theoretical pattern, which is the sum of all simulated patterns of phases identified in the sample is similar to the experimental pattern over the whole angular range (2-50 ~ CuKa; 44-1.8 /k). 3) Check the existence of the phases detected by X R D profile decomposition with direct observations (e.g., TEM associated with chemical analyses, Atomic Force Microscope). These verifications allow one to use the decomposition method not only as a descriptive tool, but also as a reliable and precise identification method for the various argillaceous phases coexisting in the complex clay parageneses that result from the diagenetic alteration of sediments. In the 25-50 ~ C u K a (3.55-1.8/k) range, the agreement between experimental and simulated I/S peak characteristics is good, and it is possible to get an accurate identification of the various phases present in the sample. The mismatches of the I/S peak width observed in the 5-11 ~ C u K a (17.6-8.0 ~) range (Reynolds and Hower, 1970; Srodon, 1980; Lanson and Champion, 1991) and the gap between experimental and theoretical position-FWHM values in the 17.7 ~ C u K a (5.00/~) region are still unresolved. The problems observed in these two angular zones remind us that, despite the good agreement in the 25-50 ~ C u K a (3.55-1.8 /~) range, the theoretical description of I/S mixed-layer used for the simulation is slightly incorrect. Thus, it will be necessary to consider new simulation hypotheses to refine this description. Perspectives. Because of important kinetic effects on the smectite-to-illite transformation, the structure of the smectite and illite end-members as well as the composition (illite content) of the I/S particles are very likely to vary about a mean value. The Markovian model for interstratification takes this variability into account as far as the elementary diffracting unit composition goes. Compared to the "identical contents crystal model," the Markovian model induces a slight shift in peak position as well as an interesting peak broadening (Plan~on et al., 1983). It should also be useful to simulate the effect of a population of particles whose basal spacings vary about a mean value, since the peak position of the 002 band is probably related
to this problem. K o d a m a et al. (1971) showed such a variability of the basal spacing for microcrystalline muscovites induced by the irregular distribution of interlayer cations. More recently, such a variability has been reported by Sato et al. (1992) for smectites as a function of the layer charge, the charge location, the expansion energy, the nature of the interlayer cation, and the relative humidity. The effect of the latter parameter has also been shown by Moore and Hower (1986). By modeling low-angle X-ray scattering of smectite gels, Pons et al. (1981, 1982) demonstrated the coexistence of various hydration states in the same sample. This may be an additional simulation hypothesis to be tested. The introduction of faults in the stacking sequence also induces an important peak broadening (Reynolds, 1989). Rather than modeling these defaults by using a different CSDS distribution as Reynolds has done (1985), one might assume the presence of incomplete 2:1 layers (e.g., T-O layers) and/or gibbsite layers in the stacking sequence. The termination of elementary diffracting units on smectitic edges, suggested by Veblen et al. (1990) and Giiven (1991), also deserves a test to check its influence on X R D profiles. Additionally, models that incorporate the concepts of interparticle diffraction and elementary illite particles (Corbato and Tettenhorst, 1987; Tettenhorst et al., 1990) may be an eventual alternative to the MacEwan crystallite model used in this paper, and others, to simulate X-ray diffraction by mixed-layered clay minerals. The accuracy and reproducibility of peak characteristic determinations provided by the decomposition method will allow one to check the realism ofI/S X R D profile simulation and, consequently, the identification procedure. With the correct simulation of I/S mixedlayer minerals, the decomposition treatment will be useful not only to describe diagenetic trends, but also to i d e n t i f y precisely the v a r i o u s phases p r e s e n t throughout diagenetic series. This is the first step to constrain and to determine the reaction mechanisms of the smectite-to-illite diagenetic transformation and to characterize and to model the kinetics of the various reactions involved in this transformation (Velde and Vasseur, 1992).
640
Lanson and Velde ACKNOWLEDGMENTS
W e t h a n k the Institut Fran~ais du P&role for prov i d i n g the samples. B.L. acknowledges financial support f r o m Elf A q u i t a i n e P r o d u c t i o n ( G r o c h i m i e Minrrale Laboratory in Pau, France), and technical support f r o m the U.S. Geological Survey in Denver, U S A , where m o s t o f this study was done. B.L. thanks D. D. Eberl, G. Besson, and V. Drits for fruitful discussions, and Professors B. K u b l e r and G. R u m l e y o f the Institut de G r o l o g i e in Neuchf~tel, Switzerland, for the use o f the Scintag diffractometer and helpful discussions. REFERENCES Ben Hadj-Amara, A., Besson, G., and Tchoubar, C. (1987) Caract6ristiques structurales d'une smectite diocta6drique en fonction de l'ordre-d6sordre dans la distribution des charges 61ectriques: I. Etudes des r6flexions 001: Clay Miner. 22, 305-318. Besson, G. (1980) Structures des smectites diocta6driques. Param~tres conditionnant les fautes d'empilement des ferullets: Ph.D. thesis, Univ. Orlrans, France, 153 pp. Bouchet, A., Lajudie, A., Rassineux, F., Meunier, A., and Atabek, R. (1992) Mineralogy and kinetics of alteration of a mixed-layer kaolinite/smectite in nuclear waste disposal simulation experiment (Stripa site, Sweden): Appl. Clay Sci. 7, 113-123. Corbato, C. E. and Tettenhorst, R. T. (1987) Analysis of illite-smectite interstratification: Clay Miner. 22, 269-285. Drits, V. A., Tchoubar, C., Besson, G., Bookin, A. S., Rousseaux, F., Sakharov, B. A., and Tchoubar, D. (1990) X-ray Diffraction by Disordered Lamellar Structures: Theory and Applications to Microdivided Silicates and Carbons: Springer-Verlag, Berlin. Francu, J., Rudinec, R., and Simanek, V. (1989) Hydrocarbon generation zone in the east Slovakian Neogene basin: Model and geochemical evidence: Geol. Carpath. 40, 355-384. Freed, R. L. and Peacor, D. R. (1989) Variability in temperature of the smectite/illite reaction in Gulf Coast sediments: Clay Miner. 24, 171-180. Giiven, N. (1991) On a definition of illite/smectite mixedlayer: Clays & Clay Minerals 39, 661-662. Howard, S. A. and Preston, K. D. (1989) Profile fitting of powder diffraction patterns: in Modern Powder Diffraction, Reviews in Mineralogy 20, D.L. Bish and J.E. Post, eds., Miner. Soc. Amer., Washington, D.C. 8, 217-275. Inoue, A. (1986) Morphological change in a continuous smectite-to-illite conversion series by scanning and transmission electron microscopies: J. Coll. Arts & Sci., Chiba Univ. B-19, 23-33. Inoue, A., Kohyama, N., Kitagawa, R., and Watanabe, T. (1987) Chemical and m~176176 evidence f~ the c~ version of smectite to illite: Clays & Clay Minerals 35, 111120. Inoue, A., Minato, H., and Utada, M. (1978) Mineralogical properties and occurrence of illite/montmorillonite mixed layer minerals formed from Miocene volcanic glass in WagaOmono district: Clay Sci. 5, 123-136. Inoue, A., and Utada, M. (1983) Further investigations of a conversion series of dioctahedral mica/smectites in the Shinzan hydrothermal alteration area, northeast Japan: Clays & Clay Minerals 31, 401-412. Inoue, A., Velde, B., Meunier, A., and Touchard, G. (1988) Mechanism ofillite formation during smectite-to-illite conversion in a hydrothermal system: Amer. Mineral73, 13251334. Inoue, A., Watanabe, T., Kohyama, N., and Brusewitz, A.
Clays and Clay Minerals
M. (1990) Characterization of illitization of smectite in bentonite beds at Kinnekulle, Sweden: Clays & Clay Minerals 38, 241-249. Jennings, S. and Thompson, G.R. (1986) DiagenesisofPlioPleistocene sediments of the Colorado river delta, southern California: J. Sed. Petrol. 56, 89-98. Kodama, H., Gatineau, L., and M6ring, J. (1971) An analysis of X-ray diffraction line profiles of microcrystalline muscovites: Clays & Clay Minerals 19, 405-413. Lahann, R. W. (1980) Smectite diagcnesis and sandstone cement: The effect of reaction temperature: J. Sed. Petrol. 50, 755-760. Lanson, B. (1990) Mise en 6vidence des m6canismes de transformation des interstratifi6s illite/smectite au cours de la diagen6se: Ph.D. thesis, Univ. Paris 6-Jussieu, France. Lanson, B. (1992) Application de la d6composition des diffractogrammes de rayons-X ~ l'identification des min6raux argileux: in Comptes-rendus du colloque rayons-X, Paris 1992, Siemens, ed., Val. 2. Lanson, B. and Besson, G. (1992) Characterization of the end of smectite-to-illite transformation: Decomposition of X-ray patterns: Clays & Clay Minerals 40, 40-52. Lanson, B. and Champion, D. (1991) The I/S-to-illite reaction in the late stage diagenesis: Amer. J. Sci. 291,473506. Moore, D. M. and Hower, J. (1986) Ordered interstratification of dehydrated and hydrated Na-smectite: Clays & Clay Minerals 34, 379-384. Moore, D. M. and Reynolds Jr., R. C. (1989) X-ray Diffraction and the Identification and Analysis of Clay Minerals: Oxford University Press, Oxford. Nelder, J. A. and Mead, R. (1965) A simplex method for function minimization: Computer J. 7, 757-769. Plan~on, A., Drits, V. A., Sakharov, B. A., Gilan, Z. I., and Ben Brahim, J. (1983) Powder diffraction by layered minerals containing different layers and/or stacking defects. Comparison between Markovian and non-Markovian models: J. Appl. Cryst. 16, 62-69. Pons, C. H., Rousseaux, F., and Tcboubar, D. (1981) Utilisation du rayonnement synchrotron en diffusion aux petits angles pour l'6tude du gonflement des smectites: I. Etude du syst6me eau-montmorillonite-Na en fonction de la temprrature: Clay Miner. 16, 23-42. Pons, C. H., Rousseaux, F., and Tchoubar, D. (1982) Utilisation du rayonnement synchrotron en diffusion aux petits angles pour l'rtude du gonflement des smectites: II. Etude de ditt~rents syst~mes eau-smectites en fonction de la temprrature: Clay Miner. 17, 327-338. Press, W. H., Flannery, B. P., Teukolsky, S. A., and Vetterling, W . T . (1986) Numerical Recepies: The Art of Scientific Computing. Cambridge University Press, Cambridge. Reynolds Jr., R. C. (1980) Interstratified clay minerals: in Crystal Structures of Clay Minerals and Their X-ray Identification, G. W. Brindley and G. Brown, eds.: Miner. Soc., London 4, 249-359. Reynolds Jr., R.C. (1985) NEWMOD: A computer program for the calculation of one-dimensional patterns of mixedlayered clays: R. C. Reynolds, 8 Brook Rd., Hanover, NH 03755, USA. Reynolds Jr., R. C. (1986) The Lorentz-polarization factor and preferred orientation in oriented clay aggregates: Clays & Clay Minerals 34, 359-367. Reynolds Jr., R. C. (1989) Diffraction by small and disordered crystals: in Modern Powder Diffraction, Reviews in Mineralogy 20, D. L. Bish and J. E. Post, eds.: Mineral. Soc. Amer., Washington D.C. 6, 145-181. Reynolds Jr., R. C. and Hower, J. (1970) The nature of interlayering in mixed-layer illite-montmorillt~,ltes: Clays & Clay Minerals 18, 25-36. Sakharov, B. A. and Drits, V. A. (1973) Mixed-layer kaolinite-montmorillonite: A comparison of observed and
Vol. 40, No. 6, 1992
Decomposition of polyphasic I/S XRD patterns
calculated diffraction patterns: Clays & Clay Minerals 21, 15-17. Sato, T., Watanabe, T., and Otsuka, R. (1992) Effects of layer charge, charge location, and energy change on expansion properties of dioctahedral smectites: Clays & Clay ~linerals 40, 103-113. Smart, G. and Clayton, T. (1985) The progressive illitization of interstratified illite-smectite from Carboniferous sediments of northern England and its relationship to organic maturity indicators: Clay Miner. 20, 455-466. Srodon, J. (1979) Correlation between coal and clay diagenesis in the Carboniferous of the upper Silesian coal basin: in Proc. Int. Clay Conf., Oxford 1978, M. M. Mortland and V. C. Farmer, eds., Elsevier, Amsterdam, 251-260. Srodon, J. (1980) Preciseidentificationofillite/smectiteinterstratifications by X-ray powder diffraction: Clays & Clay Minerals 28, 401-411. Srodon, J. (1981) X-Ray identification and randomly interstratified illite-smectite in mixtures with discrete illite: Clay Miner. 16, 297-304. Srodon, J. (1984) X-ray powder diffraction o f illitic materials: Clays & Clay Minerals 32, 337-349. Srodon, J. and Eberl, D. D. (1984) Illite: in Micas, Reviews in Mineralogy 13, S. W. Bailey, ed., Miner. Soc. Amer., Washington D.C. 12, 495-544. Stern, W. B., Mullis, J., Rahn, M., and Frey, M. (1991) Deconvolution of the first "illite" basal reflection: Schweiz. Mineral Petrogr. Mitt. 71, 453--462. Tchoubar, C. (1980) D6termination des param6tres d'ordre et de d6sordre dans quelques solides ~ structure lamellaire (silicates, carbones): Bull. MineraL 103, 404--418. Tettenhorst, R. T., Corbato, C. E., and Haller, R. I. (1990) The I/S contact in 10 A-17 A interstratified clay minerals: Clay Miner. 25, 437-445. Tomita, K., Takashi, H., and Watanabe, T. (1988) Quantification curves for mica/smectite interstratifications by X-Ray powder diffraction: Clays & Clay Minerals 36, 258262. Veblen, D. R., Guthrie, G. D., Livi, K. J. T., and Reynolds, R . C . (1990) High-resolution transmission electron microscopy and electron diffraction of mixed-layer illite/smectite: Experimental results: Clays & Clay Minerals 38, 1-13. Velde, B. (1985) Clay Minerals: A Physico-Chemical Ex-
planation of Their Occurrence: Developments in Sedimentology 40, Elsevier, Amsterdam, 427 pp. Velde, B. and Espitalir, J. (1989) Comparison of kerogen maturation and illite/smectite composition in diagenesis: J. Petrol. Geol. 12, 103-110. Velde, B., Suzuki, T., and Nicot, E. (1986) Pressure-temperature-composition of illite/smectite mixed-layer minerals: Niger delta mudstones and other examples: Clays & Clay Minerals 34, 435-441. Velde, B. and Vasseur, G. (1992) A kinetic model of the smectite-to-illite transformation based on diagenetic mineral series: Amer. Mineral. (in press). Watanabe, T. (1981) Identificationofillite/montmorillonite interstratification by X-ray powder diffraction: J. Miner. Soc. Jap., Spec. Issue 15, 32-41 (in Japanese). Watanabe, T. (1988) The structural model of illite/smectite interstratified mineral and the diagram for their identification: Clay Sci. 7, 97-114.
(Received 4 August 1992; accepted 10 December 1992; Ms. 2260) APPENDIX The present paper demonstrates the use o f X-ray pattern decomposition for the identification o f complex clay parageneses. Because o f the accuracy of peak characteristics (position and FWHM) obtained with this method, it seemed
641
necessary to check if consistent results could be obtained with different diffraction systems and numerical treatment programs. Thus, the same oriented glass slides were run on three different XRD systems whose characteristics are described in Table A 1. As a first step, the raw patterns obtained with the various diffraction systems were converted to an ASCII format, transferred to an IBM-compatible computer, and fitted with DECOMPXR, the decomposition program developed by Lanson (1990, 1992), in order to check that the various diffraction systems could produce comparable results. The differences between these systems are varied: 1) Geometrical and optical differences such as goniometer radius, slit apertures, etc. 2) Operating environment differences, such as the relative humidity, which was not controlled during data collection and differs greatly between Denver (Siemens D500) and Paris (Philips PW 1050/20). In addition to the differences listed in Table A1, the various goniometers were not calibrated with the same standard; however, the consistency of the mica-like pea k position and FWHM obtained on the different systems indicated a good agreement. Indeed, the mean variation o f the position of this peak (located between 8.75 and 8.85 ~ CuKa; 10.10-9.97 A) is 0.038 ~ CuKa, the mean variation of its FWHM (varying between 0.18 and 0.35 ~ CuKa) is 0.032 ~ CuKa. The characteristics (position and FWHM) of the fitted elementary peaks from experimental patterns are given in Table A2, and are very consistent among the different data collection systems. Basically, the variations observed from one diffraction system to another are lower or equal to the standard deviation determined by Lanson (1990) for the estimation of peak characteristics on a single diffractometer. The standard deviations in mean position and FWHM are respectively 0.20 and 0.15 ~ CuKa for an I/S peak located at 7.25 ~ CuKa (12.2 A) and 2.00 ~ CuKa wide. The standard deviation values decrease as the I/S becomes more illitic and has a larger CSDS. In the second comparison step, the raw data files were treated (background substraction and decomposition) with the fit programs available on the Philips, Siemens, and Scintag systems to check the consistency between the different pattern treatment programs. Except on the Scintag, where Pearson7 functions were used occasionally to determine the actual shape of the various elementary curves, all the decompositions were performed with Gaussian-shaped peaks. The numerical differences (different background calculation and fit algorithms; convergence criteria) between the various data treatment systems were partly compensated for by the use of the same methodology during the various decompositions. The good agreement 0fthe results obtained on the various systems (Table A3) indicates their mutual consistency. However, one must be very careful using commercially available numerical treatment packages that are not specifically conceived for clay minerals. Automatic peak search criteria, as well as some simplifying and simplified approaches, are not adapted to the very specific characteristics presented by clay mineral X R D profiles such as peak position variability, large FWHM, and severely overlapping peaks (Lanson, 1992). Intuitively, one can imagine that the background calculation influences the decomposition results. In particular, the intensity level assumed for the background has an effect on the peak "tails," and thus to a certain extent on the shape and the FWHM of decomposed peaks. However, the equation assumed for the background calculation (cubic spline or linear) seems to have little influence on peak characteristics as shown in Table A4.
642
Clays and Clay Minerals
L a n s o n a n d Velde Table A1.
Experimental settings o f the three X - r a y diffraction s y s t e m s u s e d for this study.
Diffractometer Location Radiation Divergence slit Receiving slit Scatter slit Tube Detector M o t o r a n d intensity acquisition control Numerical treatment Step size Counting time
Philips PWI050/20 ENS Paris, France Non-monochr. Ni-filtered CuKa 1~ 0.1 m m 1~ fine focus P W 2 2 1 3 / 2 0 40 kV, 30 m A Proportional Siemens Socabim D A C O DECOMPXR 0.01 ~ 3 - 1 2 seconds
Siemens D500
Scintag XDS 2000
U.S. Geol. Survey D e n v e r , Colorado Graphite monochr.
Institut Grologie Neuch~tel, Switzerland Non-monochr.
CuKa
CuKa
1~ 1~
40 kV, 30 m A Scintillation Siemens
2~ 0.3 ~ 4 ~ a n d 0.5 ~ S N / 6 0 Rich. Seifert 45 kV, 40 m A Spectral (Peltier-cooled) K e v e x PSI 1
Siemens D5000 Siemens D5000 0.01-0.02 ~ 3 - 1 0 seconds
Scintag D M S 2000 Scintag D M S 2000 0.03 ~ 2 seconds
Table A2. E l e m e n t a r y peak position a n d F W H M fitted with D E C O M P X R (Lanson, 1990) on X R D profiles collected on the Philips, Siemens, a n d Scintag X R D systems. Position a n d F W H M are given in ~ CuKa. D e c o m p o s i t i o n s are p e r f o r m e d a s s u m i n g either a G a u s s i a n shape for b o t h K a l a n d Ka2 (I/S, illite, a n d mica-like peaks) or a G a u s s i a n s h a p e for Ka~ a n d a Lorentzian shape for Ka2 (chlorite peak). Sample number and peak C H V 3 0 0 ~.5 CHV3002.s CHV3003,5 CHV3004.s C H V 1000 ~,5 CHV10002.5 C H V 10003,5 CHV10004,s C H V 1 4 7 5 ~,5 C H V 1 4 7 5 z,s CHV14753,5 CHV14754,s C H V 1 5 5 0 ~,s C H V 15502,5 CHV15503,5 C H V 15504.5 C H V 1850 ~5 C H V 18502,5 CHV18503,5 CHV18504.s CHV21302,5 CHV21303's CHV21304,5 C H V 1850 ~,6 C H V 18502,6 C H V 18503,6 C H V 18504,6 C H V 1 8 5 0 t,7 CHV18502'7 C H V 18503,7 CHV18504'7 CHV18502"s CHV18503'8 C H V 18504,8
Philips ENS-Paris Position FWHM
Siemens USGS--Denver Position FWHM
Scintag Inst. Geol. Neuchgtel Position FWHM
6.070 7.299 8.662 8.782 6.121 8.125 8.356 8.840 6.209 8.091 8.706 8.807 6.127 8.316 8.661 8.802 NA 8.302 8.580 8.759 8.453 8.685 8.793 18.873 17.788 17.617 17.756 25.321 26.794 26.771 26.764 45.489 45.298 45.384
6.208 7.755 8.620 8.811 6.230 8.126 8.391 8.842 6.657 8.192 8.708 8.846 6.363 8.254 8.591 8.798 NA 8.444 8.677 8.840 8.424 8.636 8.756 18.807 17.877 17.829 17.798 25.297 26.815 26.780 26.768 45.503 45.407 45.434
6.179 7.759 8.668 8.816 6.194 8.028 8.283 8.820 6.608 8.108 8.636 8.781 6.343 8.228 8.599 8.791 NA 8.426 8.641 8.808 8.547 8.763 8.842 18.662 17.818 17.873 17.786 25.244 26.886 26.681 26.694 45.489 45.349 45.370
0.540 2.267 1.123 0.330 0.734 1.684 0.944 0.162 0.849 1.832 0.560 0.225 1.026 1.510 0.711 0.239 NA 1.426 0.664 0.264 1.335 0.485 0.192 0.747 1.516 0.686 0.263 0.314 1.504 0.591 0.305 2.295 1.054 0.373
N A : D a t a n o t available. Superscripts s a m e as Table 2 in the text.
0.661 1.986 0.968 0.352 0.757 1.628 0.942 0.240 1.203 1.510 0.558 0.245 0.868 1.424 0.719 0.288 NA 1.198 0.627 0.272 1.047 0.503 0.252 0.443 1.340 0.572 0.303 0.697 1.590 0.759 0.355 2.238 0.840 0.369
0.652 1.995 0.862 0.337 0.798 1.715 1.019 0.294 1.307 1.455 0.570 0.244 0.734 1.414 0.773 0.273 NA 1.183 0.622 0.287 0.950 0.402 0.180 0.548 1.575 0.625 0.264 0.504 1.828 0.717 0.332 2.436 0.852 0.343
Vol. 40, No. 6, 1992
D e c o m p o s i t i o n o f polyphasic I/S X R D patterns
643
Table A3. Elementary peak characteristics (position a n d F W H M ) fitted with the dedicated data t r e a t m e n t p r o g r a m s (Table 4) on X R D profiles collected on the Philips, Siemens, a n d Scintag X R D systems. Position a n d F W H M are given in ~ C u K a . D e c o m p o s i t i o n s are p e r f o r m e d a s s u m i n g a G a u s s i a n or a P e a r s o n 7 (*) shape for b o t h Ka~ a n d Kot2 contributions. Sample number and peak C H V 3 0 0 L5 CHV3002,5 CHV3003,5 CHV3004,5 C H V 1000 i,s C H V 1000 z,s CHV10003,5 C H V 10004,5 C H V 1 4 7 5 ~.5 CHVI4752,5 CHV14753,s CHV14754,5 C H V 1850 ~,5 CHV18502.5 CHVI8503.5 CHV18504,5 CHV21302,5 CHV21303,5 CHV21304,5 C H V 18501,6 CHV18502.6 CHV18505'6 CHV18504.6 CHV18501,7 CHV18502,7 C H V 18505,7 CHV18504,7 C H V 1850 z's CHV18503,8 CHV18504's
Philips ENS-Paris Position FWHM
Siemens USGS-Denver Position FWHM
Scintag Inst. Geol. Neuch•tel Position FWHM
6.070 7.299 8.662 8.782 6.121 8.125 8.356 8.840 6.209 8.091 8.706 8.807 NA 8.302 8.580 8.759 8.453 8.685 8.793 18.873 17.788 17.617 17.756 25.321 26.794 26.771 26.764 45.489 45.298 45.384
6.203 7.538 8.504 8.806 6.187 8.070 8.400 8.850 6.614 8.197 8.707 8.853 NA 8.431 8.630 8.843 8.422 8.595 8.761 18.821 17.901 17.838 17.814 NA 26.892 26.809 26.786 45.501 45.449 45.478
6.208 7.731 8.700 8.853 NA NA NA NA 6.458* 8.026* 8.629* 8.817" 6.360 8.281 8.619 8.830 8.519 8.778 8.842 18.691 17.866 17.888 17.800 25.280 26.935 26.723 26.736 45.418 45.384 45.398
0.540 2.267 1.123 0.330 0.734 1.684 0.944 0.162 0.849 1.832 0.560 0.225 NA 1.426 0.664 0.264 1.335 0.485 0.192 0.747 1.516 0.686 0.263 0.314 1.504 0.591 0.305 2.295 1.054 0.373
NA: D a t a not available. Superscripts s a m e as Table 2 in the text.
Table A4. Elementary peak characteristics (position a n d F W H M ) fitted with D M S 2 0 0 0 on X R D profiles collected on t h e Scintag X R D system. Position a n d F W H M are given in "20 CuKa. D e c o m p o s i t i o n s are p e r f o r m e d a s s u m i n g a G a u s s ian shape for b o t h K a l a n d Ka2 contributions. T h e backg r o u n d is subtracted a s s u m i n g either a linear or a cubic spline equation. Sample and peak CHV300 ~ CHV3002 CHV3003 CHV3004
Cubic spline background Position FWHM
Linear background Position FWHM
6.198 7.718 8.715 8.853
6.208 7.731 8.700 8.853
0.825 1.913 0.912 0.338
Superscripts s a m e as Table 2 in the text.
0.700 1.942 0.917 0.347
0.496 2.155 1.200 0.423 0.750 1.659 1.018 0.216 1.209 1.523 0.567 0.254 NA 1.334 0.666 0.312 1.146 0.511 0.282 0.397 1.252 0.569 0.298 NA 1.359 0.729 0.354 1.646 0.884 0.446
0.700 1.942 0.917 0.347 NA NA NA NA 0.963* 1.432" 0.696* 0.258* 0.580 1.478 0.826 0.318 0.896 0.469 0.219 0.491 1.523 0.645 0.264 0.560 1.846 0.759 0.337 2.025 0.802 0.347