Aug 15, 2016 - To find optimal traffic light control policies, reinforcement learning ... making time when I was in need of advice. ..... signal and the maximizing Q-value of the next state as a proxy for the ...... at least one of the lights from green to red, that light turns to yellow .... Setting Teleport Wait time Stops Switches Delay.
MSc Artificial Intelligence Track: Machine Learning
Master Thesis
Deep Reinforcement Learning for Coordination in Traffic Light Control by
Elise van der Pol 5982448
August 15, 2016 42 EC November 2015 - August 2016
Supervisor: Dr. Frans Oliehoek
Assessor: Dr. Efstratios Gavves
Faculteit der Natuurwetenschappen, Wiskunde en Informatica
Abstract The cost of traffic congestion in the EU is large, estimated to be 1% of the EU’s GDP, and good solutions for traffic light control may reduce traffic congestion, saving time and money and reducing environmental pollution. To find optimal traffic light control policies, reinforcement learning uses reward signals from the environment to learn how to make optimal decisions. This approach can be deployed in traffic light control to learn optimal traffic light policies to reduce traffic congestion. However, earlier reinforcement learning approaches to traffic light control relied on simplifying assumptions over the state and manual feature extraction, so that potentially vital information about the state is lost. Techniques from the field of deep learning can be used in deep reinforcement learning to enable the use of more information over the state and to potentially find better traffic light policies. This thesis builds upon the Deep Q-learning algorithm and applies it to the problem of traffic light control. The contribution of this thesis is twofold: first, it extends earlier research on applying Deep Q-learning to the problem of controlling traffic lights on intersections with the goal of achieving optimal traffic throughput, and shows that, although Deep Q-learning can find very good policies for the traffic control problem without manual feature extraction, stability is not a guarantee. Second, it combines the Deep Q-learning algorithm with an existing multi-agent coordination algorithm to achieve cooperation between traffic lights and improves upon earlier work related to coordination for traffic light control. This thesis is the first work to combine transfer planning and deep reinforcement learning, an approach that is empirically shown to be promising.
1
Acknowledgments I would like to thank my supervisor, Frans Oliehoek for his guidance, many fruitful discussions, and for always making time when I was in need of advice. Moreover, I would like to thank Efstratios Gavves and Joris Mooij for agreeing to sit in my defense committee. Also, my thanks goes out to SurfSara which provided the much needed infrastructure to perform evaluations. Finally, I want to thank Ivy van der Pol, Brigitte Koster, Emma de Koster, Sharon Gieske and Jorn Peters for their extensive support & encouragement. An extra thanks to Sharon Gieske and Jorn Peters for taking the time to proofread my thesis.
2
Contents 1 Introduction 1.1 Research Questions and Contributions . . . . . . . . . . . . . . . . . . . . . . . . . . . . . . . . . 1.2 Outline . . . . . . . . . . . . . . . . . . . . . . . . . . . . . . . . . . . . . . . . . . . . . . . . . .
5 5 6
2 Deep Reinforcement Learning 2.1 Markov Decision Processes . . . . . . . . . . . . . . . . . . . . . . . . . . . 2.1.1 Partial Observability . . . . . . . . . . . . . . . . . . . . . . . . . . 2.2 Tabular Q-learning . . . . . . . . . . . . . . . . . . . . . . . . . . . . . . . 2.3 Q-learning with Function Approximation . . . . . . . . . . . . . . . . . . 2.4 Convergence Issues . . . . . . . . . . . . . . . . . . . . . . . . . . . . . . . 2.4.1 High Correlation Between Samples . . . . . . . . . . . . . . . . . . 2.4.2 Non-stationary Data Distribution . . . . . . . . . . . . . . . . . . . 2.4.3 Moving Targets . . . . . . . . . . . . . . . . . . . . . . . . . . . . . 2.4.4 Convergence Conditions for Reinforcement Learning with Function 2.5 Deep Learning . . . . . . . . . . . . . . . . . . . . . . . . . . . . . . . . . 2.5.1 Neural Networks . . . . . . . . . . . . . . . . . . . . . . . . . . . . 2.5.2 Optimization Algorithms . . . . . . . . . . . . . . . . . . . . . . . 2.5.3 Batch Normalization . . . . . . . . . . . . . . . . . . . . . . . . . . 2.5.4 Convolutional networks . . . . . . . . . . . . . . . . . . . . . . . . 2.6 Deep Reinforcement Learning . . . . . . . . . . . . . . . . . . . . . . . . . 2.7 Alleviating Convergence Issues . . . . . . . . . . . . . . . . . . . . . . . . 2.7.1 Experience Replay . . . . . . . . . . . . . . . . . . . . . . . . . . . 2.7.2 Freezing Target Network . . . . . . . . . . . . . . . . . . . . . . . . 2.7.3 Double Q-learning . . . . . . . . . . . . . . . . . . . . . . . . . . .
. . . . . . . . . . . . . . . . . . . . . . . . . . . . . . . . . . . . . . . . . . . . . . . . . . . . . . . . . . . . . . . . . . . . . . . . Approximation . . . . . . . . . . . . . . . . . . . . . . . . . . . . . . . . . . . . . . . . . . . . . . . . . . . . . . . . . . . . . . . . . . . . . . . . . . . . . . . . . . . . . . . . . .
. . . . . . . . . . . . . . . . . . .
. . . . . . . . . . . . . . . . . . .
. . . . . . . . . . . . . . . . . . .
. . . . . . . . . . . . . . . . . . .
7 7 8 8 9 10 10 10 10 10 11 11 11 13 13 14 14 14 15 16
3 Deep Reinforcement Learning for 3.1 Traffic Light Control . . . . . . . 3.2 State Representations . . . . . . 3.2.1 Linear Agent . . . . . . . 3.2.2 Deep Q-learning Agent . . 3.2.3 Yellow Times . . . . . . . 3.3 Action Space . . . . . . . . . . . 3.4 Reward Function . . . . . . . . . 3.5 Single agent scenario . . . . . . .
Traffic Light Control . . . . . . . . . . . . . . . . . . . . . . . . . . . . . . . . . . . . . . . . . . . . . . . . . . . . . . . . . . . . . . . . . . . . . . . . . . . . . . . . . . . . . . . . . . . . . . . . . . . . . . . . . . . . . . . .
4 Single Agent Experiments 4.1 Reward Function . . . . . . . . . . . . . 4.2 Demand Data . . . . . . . . . . . . . . . 4.3 Baseline . . . . . . . . . . . . . . . . . . 4.4 Deep Q-learning Agent . . . . . . . . . . 4.5 Stability Issues . . . . . . . . . . . . . . 4.5.1 Network Architectures . . . . . . 4.5.2 Learning rate . . . . . . . . . . . 4.5.3 Optimization Algorithms . . . . 4.5.4 Batch Normalization . . . . . . . 4.5.5 Prioritized Experience Replay . . 4.5.6 Double Q-learning . . . . . . . . 4.5.7 Freeze Interval . . . . . . . . . . 4.5.8 Experience Replay Memory Size 4.5.9 State Representations . . . . . . 4.6 Fine-tuned Deep Q-learning Agent . . .
. . . . . . . .
. . . . . . . .
. . . . . . . .
. . . . . . . .
. . . . . . . .
. . . . . . . .
. . . . . . . .
. . . . . . . .
. . . . . . . .
. . . . . . . .
. . . . . . . .
. . . . . . . .
. . . . . . . .
. . . . . . . .
. . . . . . . .
. . . . . . . .
. . . . . . . .
. . . . . . . .
. . . . . . . .
. . . . . . . .
. . . . . . . .
. . . . . . . .
17 17 17 17 18 20 21 21 21
. . . . . . . . . . . . . . .
. . . . . . . . . . . . . . .
. . . . . . . . . . . . . . .
. . . . . . . . . . . . . . .
. . . . . . . . . . . . . . .
. . . . . . . . . . . . . . .
. . . . . . . . . . . . . . .
. . . . . . . . . . . . . . .
. . . . . . . . . . . . . . .
. . . . . . . . . . . . . . .
. . . . . . . . . . . . . . .
. . . . . . . . . . . . . . .
. . . . . . . . . . . . . . .
. . . . . . . . . . . . . . .
. . . . . . . . . . . . . . .
. . . . . . . . . . . . . . .
. . . . . . . . . . . . . . .
. . . . . . . . . . . . . . .
. . . . . . . . . . . . . . .
. . . . . . . . . . . . . . .
. . . . . . . . . . . . . . .
. . . . . . . . . . . . . . .
. . . . . . . . . . . . . . .
. . . . . . . . . . . . . . .
. . . . . . . . . . . . . . .
. . . . . . . . . . . . . . .
. . . . . . . . . . . . . . .
. . . . . . . . . . . . . . .
. . . . . . . . . . . . . . .
23 23 24 24 24 25 26 27 27 28 29 30 31 32 33 36
5 Multi-Agent Reinforcement Learning 5.1 Coordination in Multi-Agent Systems . . . . . 5.2 Coordination Graphs . . . . . . . . . . . . . . . 5.3 Coordination Algorithms . . . . . . . . . . . . . 5.3.1 Variable Elimination . . . . . . . . . . . 5.3.2 Max-Plus . . . . . . . . . . . . . . . . . 5.4 Sequential Decision Making with Coordination
. . . . . .
. . . . . .
. . . . . .
. . . . . .
. . . . . .
. . . . . .
. . . . . .
. . . . . .
. . . . . .
. . . . . .
. . . . . .
. . . . . .
. . . . . .
. . . . . .
. . . . . .
. . . . . .
. . . . . .
. . . . . .
. . . . . .
. . . . . .
. . . . . .
. . . . . .
. . . . . .
. . . . . .
. . . . . .
. . . . . .
. . . . . .
. . . . . .
38 38 38 39 39 39 39
. . . . . . . . . . . . . . .
. . . . . . . . . . . . . . .
. . . . . . . . . . . . . . .
3
5.4.1
Transfer Planning . . . . . . . . . . . . . . . . . . . . . . . . . . . . . . . . . . . . . . . . 40
6 Deep Multi-Agent Reinforcement Learning for Coordination in Traffic Light Control 42 6.1 Multi-Agent Scenarios . . . . . . . . . . . . . . . . . . . . . . . . . . . . . . . . . . . . . . . . . . 42 6.2 Transfer Planning . . . . . . . . . . . . . . . . . . . . . . . . . . . . . . . . . . . . . . . . . . . . . 42 7 Multi-Agent Experiments 7.1 Baseline . . . . . . . . . 7.2 Two-Agent Scenario . . 7.3 Three-Agent Scenario . 7.4 Four-Agent Scenario . .
. . . .
. . . .
. . . .
. . . .
. . . .
. . . .
. . . .
. . . .
. . . .
. . . .
. . . .
. . . .
. . . .
. . . .
. . . .
. . . .
. . . .
. . . .
. . . .
. . . .
. . . .
. . . .
. . . .
. . . .
. . . .
. . . .
. . . .
. . . .
. . . .
. . . .
. . . .
. . . .
. . . .
. . . .
. . . .
. . . .
. . . .
. . . .
. . . .
. . . .
. . . .
45 45 45 46 46
8 Related work 48 8.1 Deep Reinforcement Learning and Coordination . . . . . . . . . . . . . . . . . . . . . . . . . . . . 48 8.2 Traffic Light Control . . . . . . . . . . . . . . . . . . . . . . . . . . . . . . . . . . . . . . . . . . . 48 9 Discussion
49
10 Conclusion 51 10.1 Future work . . . . . . . . . . . . . . . . . . . . . . . . . . . . . . . . . . . . . . . . . . . . . . . . 51
4
1
Introduction
Recently, Artificial Intelligence has reached some important milestones, most notably the defeat of Lee Sedol, the world champion of Go, by a machine. The underlying algorithms used to achieve this event combine the fields of deep learning and reinforcement learning. In the last ten years, deep learning, a sub-field of machine learning that uses complex models to approximate functions, has seen great advances [23, 46] and as a result, an increase in popularity and research directions. The use of deep learning approaches in reinforcement learning - deep reinforcement learning - has resulted in strong decision making agents, capable of outperforming human beings [31, 43]. Since the results of applying deep reinforcement learning to games are impressive, a logical next step is to use these algorithms to solve real-world problems. For example, the cost of traffic congestion in the EU is large, estimated to be 1% of the EU’s GDP [6], and good solutions for traffic light control may reduce traffic congestion, saving time and money and reducing pollution. In this thesis, an agent is an entity capable of making decisions based on its observations of the environment. Systems where multiple of these agents cooperate to reach a common goal are cooperative multi-agent systems. Networks of traffic light intersections can be represented as cooperative multi-agent systems, where each traffic light is an agent, and the agents coordinate to jointly optimize traffic throughput. By using reinforcement learning methods, a traffic control system can be developed wherein traffic light agents cooperate to optimize traffic flow, while simultaneously improving over time. While earlier work has researched the combination of more traditional reinforcement learning methods with coordination algorithms [60, 50, 24], these approaches require manual feature extraction and simplifying assumptions, potentially losing vital information that a deep learning approach can learn to utilize. This makes traffic light control a good application to test the embedding of deep reinforcement learning into coordination algorithms. The goal of this thesis is, on one hand the extension of earlier work on applying deep reinforcement learning algorithms to traffic light control [38], and on the other the embedding of deep reinforcement learning into existing multi-agent coordination algorithms.
1.1
Research Questions and Contributions
Following earlier work [38], top-down images of the current traffic situation are used as input for the deep reinforcement learning algorithm. Thus, the next research question: Q1 . Can a deep reinforcement learning agent learn to manage traffic based only on top-down images of traffic situations? Moreover, how do different hyperparameter settings - such as the network architecture, or the database size - influence the algorithm’s behavior on the traffic light control problem? In traffic light control, an agent’s goal could be to minimize the average travel time of vehicles in the network: by minimizing travel time, congestion is indirectly discouraged and traffic throughput optimized. However, the travel time of a vehicle is unknown until it has reached its destination. To circumvent this problem, this thesis considers the following research question: Q2 . How can a reward function for traffic control be shaped, such that the resulting reinforcement learning agent minimizes traffic jams, delay and unsafe situations? To extend existing research on deep reinforcement learning and traffic light control [38], some modifications to the original deep reinforcement learning algorithm [31] are compared: prioritized experience replay [42] and deep double Q-learning [55] (see Sections 2.7.1 and 2.7.3 for details on these modifications), resulting in the following research question: Q3 . How does the use of modifications such as prioritized experience replay and double Q-learning compare to the use of the unmodified deep reinforcement learning algorithm? Finally, deep reinforcement learning is embedded in existing coordination algorithms and compared to the current state of the art of coordination for traffic light control, from where the following research question arises: Q4 . Can deep reinforcement learning policies be used in cooperation in traffic control, and more importantly, can the resulting algorithm outperform more traditional approaches to using reinforcement learning in traffic light control?
5
Thus, the contribution of this thesis is two-fold: one, research on applying deep reinforcement algorithms to the problem of learning an optimal policy for a traffic light control agent is extended. Two, deep reinforcement learning is embedded into existing multi-agent coordination algorithms and compared to the current state of the art, in order to empirically evaluate the feasibility of combining these approaches.
1.2
Outline
Section 2 introduces the necessary background information for deep reinforcement learning, Section 3 outlines the approach used in the single agent case, and Section 4 presents the results of applying deep reinforcement learning to single-agent traffic control. Section 5 introduces the necessary background information for multi-agent coordination between traffic light agents and Section 6 presents the approach used to combining deep reinforcement learning with coordination algorithms. Section 7 presents the results of applying deep reinforcement learning to multi-agent coordination. Section 8 touches on earlier work related to deep reinforcement learning and traffic light control, Section 9 discusses the implications of the presented findings and Section 10 concludes and suggests directions for future work.
6
2
Deep Reinforcement Learning
This chapter introduces the necessary background knowledge needed for understanding deep reinforcement learning for single-agent traffic light control.
2.1
Markov Decision Processes
A Markov Decision Process (MDP) is a mathematical framework for optimizing decision-making under uncertainty. It is specified over an environment, where the goal is for an agent to reach some desired state. As such, the MDP formalizes a set of environmental states, a set of actions for the agent to take, a reward function that assigns a reward signal to the outcome of taking certain actions in certain states, and a transition function, that describes the change in the environment as a result of taking a certain action in a certain state. An MDP satisfies the Markov Property if the transition function depends only on the current state s and the taken action a. That is, the probability of moving from s to s0 after taking a is dependent only on the current state, such that [47]: P (st+1 |st , at , rt , st−1 , at−1 , · · · , r1 , s0 , a0 ) = P (st+1 |st , at )
(1)
Formally, an MDP is a four-tuple < S, A, R, T > where • S is the space of possible states; • A is the space of possible actions; • Rass0 is a reward function specifying the reward r for taking action a in state s and ending up in state s0 ; a • Tss 0 is a transition function specifying the probability of taking action a in state s and ending up in state 0 s.
The agent’s goal is to maximize its reward over time, giving slightly more preference to short-term than to long-term reward. This goal is captured in the return, the discounted cumulative reward over time [47]: Rt =
∞ X
γ k rt+k+1
(2)
k=0
where γ is a discount factor such that 0 < γ ≤ 1, meaning that future rewards are discounted exponentially. To maximize the return, the agent finds a policy π, a strategy for choosing an action a given a state s. A deterministic policy is a function that maps a state to an action, whereas a stochastic policy is a distribution assigning probabilities to actions based on the state, that is, π(s) is a probability distribution over a ∈ A(s), and π(s, a) is the probability of selecting a in s. The expected value of the return under a policy π is given by a value function, V π : S → R, which is a mapping from a state and policy to the expected return of starting in s and following π from there on out [47]: � � V π (s) = Eπ Rt |st = s (3) ∞ �X k � = Eπ γ rt+k+1 |st = s (4) k=0
An important attribute of (4) is that it can be rewritten to be recursively defined [47], which allows for dynamic programming [2] algorithms to efficiently estimate the value of a policy: π
V (s) = Eπ
∞ �X
� γ k rt+k+1 |st = s
(5)
k=0
=
X
π(s, a)
X
� a � a π 0 Tss (s ) 0 Rss0 + γV
(6)
s0 ∈S
a∈A
To choose the optimal action in a state, an agent needs a function similar to (4) but defined over states and actions. This is the Q-value function Q : S × A → R, which estimates the expected value of taking action a in state s and following π afterwards [47]: � � Qπ (s, a) = Eπ Rt |st = s, at = a (7) ∞ X � � = Eπ γ k rt+k+1 |st = s, at = a (8) k=0
7
Using (6), (8) can be rewritten in terms of the value function: Qπ (s, a) = Eπ
∞ �X
� γ k rt+k+1 |st = s, at = a
(9)
k=0
=
X
� � a π 0 a (s ) Tss 0 Rss0 + γV
(10)
s0 ∈S
If T and R are known, the optimal policy can be found by planning, using dynamic programming methods that exploit the recursive definitions of the value function. An example of a planning algorithm that finds an optimal policy is Value Iteration, pseudo code for which is presented in Algorithm 1. Value Iteration iteratively updates the value function by updating each Q-value, and then uses the maximizing Q-value to update the value function. Since these two functions are dependent on each other, Value Iteration converges to the optimal policy [47]. Algorithm 1 Value Iteration 1: 2: 3: 4: 5: 6: 7: 8: 9:
Initialize V0 (s) randomly for all s ∈ S, i=1, while |Vi (s) − Vi−1 (s)| > �, ∀s ∈ S do for s ∈ S do for a ∈ A do P � a � 0 a Qi (s, a) = s0 ∈S Tss 0 Rss0 + γVi−1 (s ) end for Vi (s) = max Qi (s, a) a end for end while
However, in many cases the environmental dynamics T and R are not known upfront. In those cases the agent needs to estimate the value of taking an action in a state without using knowledge about the transition probabilities and reward function. For these cases, reinforcement learning algorithms are suitable. In reinforcement learning, an agent learns a mapping from states to actions from interacting with the environment and receiving feedback for taking actions in states. One type of reinforcement learning algorithm is model-based reinforcement learning, where the agent samples from the environment to estimate T and R, and then uses planning algorithms to find an optimal policy. Another type of reinforcement learning algorithm is model-free reinforcement learning, where the agent skips T and R altogether and directly estimates the Q-function from experience. In both cases, it is important for an agent to balance exploitation - taking greedy actions, which are those that maximize the current estimate of Q(s, a) - and exploration - taking suboptimal actions to be able to sample from new parts of the search space. 2.1.1
Partial Observability
In some cases the environmental state is not fully observable, and while the transition from s to s0 given a is Markov, the agent cannot observe s, but only a proxy for the state, an observation o. For example, a robot that faces a blind wall does not know which part of the wall it is looking at without knowing the route it took so far [15]. In these cases, the agent needs knowledge of the history to reason about the state it’s in. When the environment is partially observable, the problem can be defined as a Partially Observable Markov Decision Process (POMDP). POMDPs can be solved by defining a Belief MDP, which defines a probability distribution over the POMDP state, the Belief State. This allows the agent to make decisions without full observability, but results in an intractable problem - the Belief State space is continuous (as it is a probability distribution) and so it cannot be solved by tabular algorithms such as Value Iteration. A much simpler solution, that is not always available, is to prepend (part of) the history to the state. By doing so, the history is added to the state, so that full observability is re-introduced to the state space. As a result, the problem reverts back to the much easier MDP problem.
2.2
Tabular Q-learning
Q-learning [59] is a model-free reinforcement learning algorithm. That is, it does not build its own model of the environment’s transition and reward functions, but rather directly estimates the value of taking an action a in 8
state s, the so-called Q-value of the s, a-pair, Q(s, a). Specifically, Q-learning is an off-policy algorithm, which is a class of algorithms that uses a different policy for estimating Q-values than for action-selection. That is, Q-learning updates the Q-values of the current s, a-pair using the greedy policy to estimate the Q-value of the optimal policy of the next s, a-pair. In traditional Q-learning, the agent employs a lookup table of s, a-pairs and iteratively updates the Q-value estimates using h i � � 0 Qt+1 (s, a) = Qt (s, a) + α rt + γ max Q (s , a ; θ ) − Q (s, a) (11) t t+1 t t 0 a
In words, the difference between the current estimate of the s, a-pair, and the actual value of the s, a-pair. However, since the true value of the s, a-pair is not known upfront, the agent instead uses the current reward signal and the maximizing Q-value of the next state as a proxy for the true value. For the complete algorithm, see Algorithm 2. This is called tabular Q-learning, and it has the nice property that it converges given infinite samples. That is, under specific circumstance, the Bellman equation is a contraction mapping with respect to the infinity norm (for details, see e.g. [56]).
Algorithm 2 Tabular Q-learning 1: 2: 3: 4: 5: 6: 7: 8:
Initialize Q(s, a) randomly for all s ∈ S, a ∈ A, i=1, for each episode do Initialize s, a for each step t in episode do a = π(s) // Select a using policy based on current Q, e.g. �-greedy Take action a Receive reward r, observe new state s0 . Qt+1 (s, a) = Qt (s, a) + α[r + γ max Qt (s0 , a0 ) − Qt (s, a)] Set s = s0 0 a
9: 10:
end for end for
Q-learning can be contrasted with SARSA [39], an on-policy algorithm that updates the Q-values of the current s, a-pair using the estimation of the Q-value for the next s, a-pair of the current policy. SARSA and Q-learning would be the same algorithm if SARSA would use a greedy policy for interacting with the environment. In practice, this is not the case, as a purely greedy policy does not balance exploration and exploitation (since by definition it only exploits). It is imperative to properly balance these two, since without exploration the agent cannot make proper estimates of Q-values, but without exploitation, it cannot use the knowledge it has learned.
2.3
Q-learning with Function Approximation
While tabular Q-learning works fine in small domains, many real-world problems have very large or continuous S and A, and thus, do not allow enumeration over s, a-pairs. A solution to the problem of continuous S is function approximation, where supervised machine learning algorithms are used to approximate the Q-function. In that case, the Q-value is no longer an entry in an |S| × |A| table, but a function parametrized by learned weights θ. These weights can be updated using gradient descent methods, minimizing the mean squared error between the current estimate of Q(s, a) and the target, which is defined as the true Q-value of the s, a-pair under policy π, Qπ (s, a). The gradient descent update can be derived by taking the derivative of the mean squared error (MSE): h i2 X M SE(θ) = P (s) Qπ (s, a; θ∗ ) − Qt (s, a; θt )
(12)
s∈S
where P (s) is the sampling distribution, or the probability of visiting state s under policy π. The derivative is then h i ∂ ∂ M SE(θ) = 2 Qπ (s, a; θ∗ ) − Qt (s, a; θt ) Qt (s, a; θt ) ∂θt ∂θt
(13)
Since the targets are not directly observable, a proxy is used for the targets, given by the reward in the current time step, and a discounted estimate of the next state’s best Q-value using the current Q-function approximation, 9
Qt : � � Qt (st+1 , a0 ; θt ) Qπ (s, a; θ∗ ) ≈ rt + γ max 0 a
(14)
Since the Q-value is an expected discounted cumulative reward of taking action a in state s and following policy π afterwards, (14) is an optimistic estimate of the Q-value at time step t. With the Q-function approximation represented as a function with learnable parameters, a regular supervised learning method can be used to approximate the true Q-function Qπ . This is the essence of Q-learning with function approximation.
2.4
Convergence Issues
While using global approximations for Q-values can potentially speed up learning by generalization [37], the original convergence guarantees of Q-learning no longer hold; divergence and/or oscillation may be caused by at least the three problems described in Sections 2.4.1 - 2.4.3 (and perhaps other, not yet identified issues). However, some convergence guarantees have been found for reinforcement learning with function approximation, as described in Section 2.4.4. 2.4.1
High Correlation Between Samples
In traditional machine learning problems, there is often an assumption of independently and identically distributed (i.i.d.) data. That is, each data point is drawn from the same probability distribution as the others, and all data points are mutually independent [4]. However, in decision-making under uncertainty, consequently sampled data points are heavily correlated: (st , at ) strongly influences the probability of (st+1 , at+1 ). 2.4.2
Non-stationary Data Distribution
Moreover, as Qt is iteratively updated with each new sample, the sampling distribution is changed as well since Qt determines which actions are chosen and thus, which sequence is followed - so that a data point (a transition of the form s, a, r, s0 ) at time step 0 is sampled from a very different distribution than e.g. a data point sampled at time step 1000, because the Q-function changes, and as a result, so does the action-selection function. As a result, the data points are not drawn from the same distribution, which means that not only are the samples not independent, they are also not identically distributed.
2.4.3
Moving Targets
Additionally, in going from tabular Q-learning to function approximation, the model shifts from a tabular representation - one where each s, a-pair has a local entry - to a global representation, where each s, a-pair is evaluated by an approximator that is updated globally. Since in function approximation the weights are updated globally, earlier progress on one s, a-pair can be reverted by updating after sampling another s0 , a0 -pair [37]. Moreover, consider that in Q-learning, the targets move as the agent learns to map s, a-pairs to Q-values, as each time an s, a-pair is sampled, its Q-value changes. However, in function approximation, as the estimation of the current s, a-pair changes, so does the optimistic estimate of the next s0 , a0 -pair: a result of updating Qt globally is that both estimates are changed when the Q-function is updated. As a result, the moving targets become problematic: updating the current s, a-pair may result in a large shift in its target value, which is dependent on the �Q-value for the next s, a-pair. Thus, while Qt (s, a) is updated to move closer to its target, � rt + γ Qt (st+1 , a) , the latter shifts because of the update, and so the system may destabilize. To see why this is the case, consider updating a Q-learning agent with a function approximator based on sample transition tn . The Q-network weights θ are updated, and as a result, the Q-value of tn+1 - which is part of the label - changes as well. Then, Qθ is updated based on tn+1 and as a result, the Q-values for tn could shift back. This can result in oscillations, or - if the targets do not shift back but further and further away, divergence - which could be prevented by keeping the Q-values for tn+1 fixed for a longer period of time. 2.4.4
Convergence Conditions for Reinforcement Learning with Function Approximation
Despite these convergence issues when going from tabular reinforcement learning to using function approximators, there are cases in which reinforcement learning with function approximation converges with probability 1. Earlier work on convergence in reinforcement learning has established convergence conditions for on-policy
10
Input
Hidden
Output
h1
x1
h2
y1
x2
h3
y2
x3
h4
y3
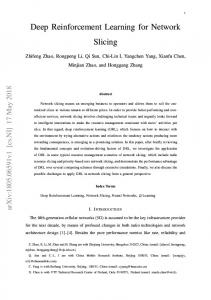
h5 Figure 2.1: Example of a simple neural network architecture with one hidden layer reinforcement learning with linear function approximators [53] [29] [36]. However, none of these results are applicable to deep Q-learning, since a) Q-learning is an off-policy algorithm and b) neural networks are non-linear approximators.
2.5
Deep Learning
Recent successes with deep neural networks have led to the field of deep learning. Deep learning is an area of machine learning that focuses on neural networks with many layers and methods of making these models faster to train and more reliable in terms of convergence. 2.5.1
Neural Networks
A neural network [4] is a machine learning model parameterized by a set of parameters θ that maps an M dimensional input vector, ~x through a series of hidden layers and activations, to a K-dimensional output vector, ~y (see Figure 2.1). Specifically, a neural network consists of interconnected layers, where each layer computes a linear mapping between the input x and its weights w, adding a bias term b and mapping the result through a non-linear activation function - needed to introduce non-linearity into the model - e.g. a rectified linear unit. For example, mapping input vector ~x through one hidden layer with weights W0 ∈ θ, bias term b0 ∈ θ and non-linearity h0 results in the following equation: ~x0 = h0 (W0 ~x + b0 )
(15)
The output ~x0 can be used as input to the next layer, with e.g. weights W1 ∈ θ, bias b1 ∈ θ and non-linearity h1 : ~x00 = h1 (W1 h0 (W0 ~x + b0 ) + b1 )
(16)
And so on. As the network grows deeper, the model can approximate more complex functions, but it also becomes harder to train. For that reason, much of the field of deep learning is dedicated to solving problems such as finding more reliable and faster methods of training neural networks and escaping local minima. 2.5.2
Optimization Algorithms
To train machine learning models, some form of gradient descent is necessary. First, define an objective function L, that quantifies the error between the output of the model and the true value of the data point. In gradient descent optimization, the objective function - and thus the error - is minimized by updating the parameters of the model in the direction of the negative of the gradient [4].
11
Stochastic Gradient Descent In batch gradient descent (GD) [4], L is minimized with respect to the model parameters θ by changing the parameters with small steps in the direction of the gradient of L. Thus, the update for θ is θ(t+1) = θ(t) − α
N X
∇L(xi ; θ(t) )
(17)
i=1
where N is the size of the data set and α is the learning rate. In stochastic gradient descent (SGD), updates are not performed over the entire data set, but based on randomly sampled data points xi ∼ U (x0 · · · xN ): θ(t+1) = θ(t) − α∇L(xi ; θ(t) )
(18)
Because of the randomness in data point sampling, SGD is less likely to get stuck in local minima than batch gradient descent, and because of the iterative updates it can be used as an on-line algorithm. However, SGD can still get stuck in local minima and saddle points. Deep neural networks are difficult to train, and as such, new optimization methods have been proposed that converge more reliably than standard stochastic gradient descent. Two of these optimization methods - RMSProp and ADAM - are discussed here. Since both are adaptations of the Adagrad [8] optimizer, this is discussed first. Adagrad Adagrad [8] adaptively updates parameters based on a sum of squared gradients per parameter. It then uses this value to normalize the learning rate before the update. Specifically, for parameter j: (t+1) Gj (t+1)
θj
=
(t) Gj
∂L
+
(19)
(t)
∂θj
α
(t)
= θj −
!2
(t+1) (Gj
∂Lθ
·
(t)
(20)
+ �) ∂θj
where � is a small constant to prevent division by zero. Thus, the learning rate for each parameter is set adaptively, based on the past updates. If past gradients for parameter j were large, the learning rate for j is small. On the other hand, if past gradients for j have been small/sparse, the learning rate for j is large. By dividing the learning rate by the sum of past square gradients, Adagrad removes the need for extensive learning rate tuning. RMSProp Adagrad solved the problem of adaptively tuning the learning rate per parameter, but by dividing the learning rate by the sum of squared gradients, the learning rate diminishes too agressively as time passes, since the sum keeps growing. RMSProp [52] solves this problem by defining an exponentially decaying average of squared gradients instead: (t+1) Gj
=
(t) γGj
+ (1 − γ)
∂L
!2
(t)
(21)
∂θj
where originally γ = 0.9. The parameter update in RMSProp is also performed using (20). Momentum Momentum [45] is an addition to the optimization step that functions by increasing the strength of updates in directions that consistently lead to improvement. It does this by storing a variable v, the so-called velocity: v (t+1) = µ · v (t) − α∇Lθ θ
(t+1)
=θ
(t)
+v
(t+1)
where µ is the momentum coefficient. By using momentum, learning speeds up when gradients are following the loss curve down a slope.
12
(22) (23)
ADAM ADAM (Adaptive Moment Estimation) [18] is similar to AdaGrad and RMSProp and combines these methods with its own version of momentum. Specifically, ADAM stores both a decaying average of squared gradients and a decaying average of past gradients: m(t+1) = β1 · m(t) + (1 − β1 ) · ∇Lθ
(24)
2
(25)
v
(t+1)
= β2 · v
(t)
+ (1 − β2 ) · ∇Lθ
where β1 and β2 are hyperparameters. However, these values are estimates of the first-order moment (the mean), mt and the second-order moment (the variance), vt , respectively. Thus, in ADAM, the v variable is not the momentum-velocity but an estimate of the variance. To correct for the bias caused by initializing these vectors as zero-vectors, a bias-correction step is performed: m ˆ (t+1) =
m(t) (1 − β1t )
(26)
vˆ(t+1) =
v (t) (1 − β2t )
(27)
The final update rule is then similar to those discussed above: α θ(t+1) = θ(t) − √ ·m ˆ (t+1) (t+1) vˆ +�
(28)
where �, again, is a constant to prevent division by zero. Backpropagation Neural networks can be trained using gradient descent methods - by minimizing the error function with respect to the parameters. To do so, the gradient of the error function is computed. Backpropagation is a method for passing the error in the output layer back through the individual nodes in the neural network. Since a neural network is essentially a hierarchy of nested functions, the chain rule can be used to compute the derivative of the error function with respect to the neural network weights. 2.5.3
Batch Normalization
In deep learning, parameter changes in one layer of the neural network affect the resulting input distribution for all following layers. This phenomenon is referred to as internal covariate shift [14]. Batch normalization [14] is a method to reduce the severity of internal covariate shift. Batch normalization effectively normalizes the input to each layer in the network by computing the mean and variance of a mini-batch. Note that mini-batch statistics are used to approximate the population statistics, to reduce computation time. Thus, for each feature k in the input vector ~x: xk − E[xk ] x ˆk = p Var[xk ] + �
(29)
where � is a constant added for to prevent zero-divisions. To prevent the loss of expressive power for each layer, two parameters are introduced to ensure that the layer’s transformation can represent the identity transformation. That is, for each feature k in the input factor ~x the network learns γk , a scaling parameter1 and βk , a shifting parameter, such that the layer input for feature k, yk becomes: yk = γk x ˆ k + βk
(30)
Batch normalization is useful since it speeds up learning, allows larger learning rates and reduces the need for hyperparameter tuning, especially the learning rate. 2.5.4
Convolutional networks
A convolutional network [25] is a type of neural network architecture that is especially adept at recognizing patterns in spatial data such as images. A convolutional network has one or more convolutional layers that consist of a set of filters. These filters output locally filtered areas of the image. That is, each filter is applied over all parts of the image, but a network can have multiple filters per convolutional layer. The weights of the filters are learned by backpropagation. 1 Not
to be confused with the discount factor γ used in reinforcement learning
13
2.6
Deep Reinforcement Learning
Deep reinforcement learning refers to reinforcement learning with (deep) neural networks as function approximators. Reinforcement learning with neural networks enables learning of a large range of decision-theoretic functions, and results in function approximators that are naturally adept at dealing with continuous and large state spaces effectively. For example, using convolutional networks to map images to decisions in robot pathplanning removes error-prone and time-consuming manual feature extraction. A notable algorithm is Deep Q-learning (DQN) [31], which is an adaptation of Q-learning that uses a neural network as a function approximator. To alleviate the convergence problems discussed in Section 2.4, DQN samples experience from an experience replay database D and keeps the Q-function for the target s, a-pair fixed for long periods of time. The pseudo-code for the DQN algorithm can be found in Algorithm 3, and the algorithm is explained in detail in Sections 2.7.1 to 2.7.2.
Algorithm 3 Single Agent Deep Q-Learning 1: 2: 3: 4: 5: 6: 7: 8: 9: 10: 11: 12: 13: 14: 15: 16: 17: 18: 19: 20: 21:
Initialize Q-networks θV and θT with random weights Initialize state s = s0 Initialize action a ∼ U (A) Initialize experience replay database D = [] Take action a for i=0; i < |D|; i++ do Receive reward r Observe next state s0 D.add(< s, a, r, s0 >) // Add transition to experience replay database a ∼ U (A) // Sample random action Take action a end for for i=|D|; i < 1e6; i++ do Interact with the environment: Receive reward r Observe next state s0 D.add(< s, a, r, s0 >) // Add transition to experience replay database With probability �: // Select actions using �-greedy a ∼ U (A) Otherwise: a = argmax Q(s, a; θV ) a
Take action a Perform updates: (sm , am , rm , s0m ) ∼ U (D) // Sample mini-batch of transitions � 2 from D � 0 0 T Update θV using (Q(sm , am ) − rm + γ max Q (s , a ; θ ) ) t m 0
22: 23: 24: 25:
a
26: 27: 28:
Every M steps: Set θT = θV end for
// Copy value network weights to target network
However, as noted in Section 2.4, Q-learning with neural network function approximators suffers from convergence issues, and requires some adaptations to prevent divergence. In practice, the DQN approach has been shown to converge to great solutions [43, 31] in some cases, but to oscillate in other cases (see [42], Figure 7). Adaptations that have empirically been shown to be effective in alleviating convergence issues are discussed in Section 2.7.
2.7
Alleviating Convergence Issues
Several methods have been proposed to solve the problems outlined in Section 2.4: experience replay [26], target network freezing [31] and double Q-learning [55]. 2.7.1
Experience Replay
In experience replay [26, 37, 31] the agent stores experience tuples (s, a, r, s0 ) in a replay memory D. One version stores the last N transitions in a sliding window database [31], while another stores all the experience tuples [37].
14
On every update step, the agent samples a mini-batch of experience out of D uniformly and uses this mini-batch to update the weights of the value network Qt . This mechanism breaks the correlations between sequential samples by randomizing their sampling order. Moreover, samples within a mini-batch are evaluated using the same Qt [31]. This way, the samples within a mini-batch are scored similarly relative to one another, as opposed to each sample being evaluated by a different Qt in the algorithm without experience replay. Furthermore, experiences can, in theory, be sampled multiple times before they leave the memory, such that rare experiences can potentially be reused more than once, which is especially valuable if some experiences are costly, e.g. driving a robot off a cliff. Experience replay can be harmful if environmental mechanisms such as R and T change over time, since older experiences can then be wrong [26]. Additionally, in experience replay, experience tuples are sampled from D uniformly. Because of this uniform sampling, common experience tuples are sampled more often, since they appear in D more often. On the other hand, rare - and potentially high-information - experiences are much less likely to be resampled than common experiences. In short, uniform sampling from D does not efficiently use the stored experiences. Prioritized Experience Replay A solution to the problems introduced by uniform sampling in experience replay is to sample experiences based on their temporal difference error (TD-error) δ. For a data point i: δi = Qt (si , ai ) − ri + γ max Qt (s0i , a0 ) 0 a
(31)
This is an alternative method of sampling from the replay memory based on the idea of prioritized sweeping [33], and is aptly named prioritized experience replay [42]. However, rather than using a greedy approach where the experiences with the highest TD-error are deterministically chosen - which is sensitive to outliers, i.e. anomalous data samples caused by noise in the environment - prioritized experience replay computes a sampling probability for every experience i using a Boltzmann distribution: pα P (i) = P i α k pk
(32)
where the α parameter is the temperature, used to balance between completely greedy prioritization (α = 1) and uniform sampling (α = 0). Value pi is computed according to the proportional method (see (33)) or the rank-based method (see (34)). The proportional method computes pi as follows: pi = |δi | + �
(33)
where � is a small, positive number to ensure some probability for experiences with δi = 0. The rank-based method computes pi as follows: pi =
1 rank(i)
(34)
where rank(i) is the rank of experience i when the experience replay memory is sorted according to δi . Rank-based prioritization is more robust to large differences in δi [42], since anomalously large TD-errors do not get an extremely large part of the probability space, but the probability based on their rank, which is capped. Replay Memory Composition Earlier work [7] reports an increase in Q-function stability when employing a different replay memory structure: instead of a simple sliding window, the first half of the replay memory is reserved for old experiences. That is, only the second half of the database is overwritten with new experience. The idea behind this approach is that older, exploratory experiences are important to revisit so that structure learned from early experience is not overwritten. The overwriting of earlier training by new experience - and consequent forgetting of important knowledge - is known as catastrophic forgetting [27]. 2.7.2
Freezing Target Network
A solution to the problem of moving targets (Section 2.4.3) is to have a separate value network Qt (s, a; θtV ) to evaluate the value of the current s, a-pair, and target network Qt (s, a; θtT ) to evaluate the targets 15
� � rt + γ max Qt (s0 , a0 ; θtT ) [31]. Every M steps, the weights of the action network are copied into the target 0 a
network, by setting θtT = θtV
(35)
Whereas the weights of the value network, θtV , are updated on every training step. By only updating the target network every M steps, the labels to update to are fixed for a period of M time steps, instead of changing on every time step. Recall that updates made on the basis of transition tn+1 can undo updates made on the basis of tn . Moreover, by updating the Q-function to shift Q(st , at ) closer to rt + γ max [Q(st+1 , a0 )], the value 0 a
of Q(st+1 , a0 ) changes as well. Thus, by decoupling the Q-functions for Q(st , at ) and Q(st+1 , a0 ) and keeping the latter fixed for a period of time, Q(st , at ) can be updated without changing the targets. In theory, waiting longer between target network updates would increase stability, but can lead to longer convergence times since the updates are not being made in the optimal direction as long as the targets are suboptimal. 2.7.3
Double Q-learning
In Q-learning, the Q-value is computed by 1) finding the maximizing action for the next state according to the current Q-function and 2) computing the Q-value of the next state and this maximizing action. However, since both computations are performed using the same Q-network estimation, this can result in overestimations. For example, if the true Q-values for all actions are the same, but the Q-network results in noisy estimations, since the max-operator is used, the estimated Q-value will be an overestimation due to the addition of noise. Earlier work has derived both an upper bound [51] and a lower bound [55] on these overestimations. Double Q-learning alleviates this overestimation by decoupling the maximization and the evaluation, by using different Q-networks for both operators [54]. In DQN, this results in Deep Double Q-learning (DDQN) [55]. DDQN is very similar to the original DQN algorithm, with the exception of the decoupling of the operators mentioned above. The only difference is the update of the value network, where originally, the targets (denoted as yt ) were computed as � � yt = rt + γ max Qt (st+1 , a0 ; θt ) (36) 0 a
but which can be rewritten to a decoupled version as yt = rt + γQ(st+1 , argmax Q(st+1 , a; θt ); θt )
(37)
a
That is, the maximizing action is found first and then the corresponding Q-value is computed, instead of directly maximizing the Q-values with respect to the actions. For the original DQN algorithm, (36) and (37) compute the exact same value, but in DDQN, the maximization and the Q-value computation (evaluation) use different Q-networks, which results in (38). yt = rt + γQ(st+1 , argmax Q(st+1 , a; θtV ); θtT )
(38)
a
where θtV and θtT are the value network parameters and target network parameters used in the original DQN algorithm. DDQN is otherwise exactly the same as DQN, and the target network is still updated by intermittently cloning the value network parameters. Despite these great similarities, DDQN’s robustness to overestimation has empirically been shown to outperform the original DQN algorithm on the Atari benchmark [55].
16
3
Deep Reinforcement Learning for Traffic Light Control
This section outlines the approach used for single-agent traffic control with deep reinforcement learning. The approach is based partly on earlier work [38], which is an application of the DQN algorithm [31] to single-agent traffic control, using a single matrix of car positions. Here, that work is extended in multiple ways, considering different state space representations and algorithm modifications.
3.1
Traffic Light Control
In traffic light control, the agent is a traffic light intersection within a traffic network, whose goal is to optimize the throughput of vehicles through the traffic network as a whole, while minimizing traffic jams and collisions. For an illustration, see Figure 3.1. Experiments are run in the open source traffic simulator SUMO [21]. SUMO uses a car-following, (mostly) collision-free model based on the Krauß car-following model [22], which makes vehicles keep a safe distance from the car ahead, such that there is enough time to brake in case of emergency stops [16]. Due to this assumption of being a collision-free model, SUMO deals with collisions by teleporting colliding vehicles to a different place in the network. As such, there is no direct way to penalize e.g. collisions in SUMO, aside from penalizing teleports. However, teleports are also SUMO’s solution in case a vehicle has been stuck in one place for too long. It is, however, possible to penalize based on, for example, the delay of vehicles, the time they spend not moving, and so forth. From here on, one simulated second in SUMO equals one time step. Simulations are allowed to run until they finish, or until 10, 000 time steps have passed.
Figure 3.1: A traffic light agent within a larger traffic network. The colored circles represent the traffic light setting for each lane.
3.2
State Representations
The representation of the current state should be chosen such that a) the agent has all the information it needs to make a good decision and b) there is little, if any, superfluous/unneeded information. The latter is important, since unneeded information results in extra training time - the agent would need to learn that this information is irrelevant, and a larger state space results in slower learning by increasing the computation time per step. A traffic light agent is trained using the DQN algorithm (hereafter named ‘DQN agent’) using a matrix of vehicle positions as a state [38], similar to how earlier work uses raw pixel images as video game states [31]. Details about the state space representation can be found in Section 3.2.2. To compare, a baseline agent is trained with a linear function approximator (hereafter named ‘linear agent’), but since linear regression is not well-equipped for non-linear information, a separate feature vector with manually defined features is used for a fair comparison. The details of the state space representation for the linear agent can be found in Section 3.2.1. 3.2.1
Linear Agent
The linear agent uses a feature vector of basis functions φ(s), containing information about the state. The feature vector is built up per lane that the agent controls, and contains a set of features per lane: first, the sum 17
of the waiting times (i.e. the number of time steps that a vehicle has not moved) for all vehicles on the lane, because information over the wait time of vehicles gives us an indication of e.g. jams on a lane. For similar reasons, the sum of vehicle delay (the difference between the maximum allowed speed and the vehicle’s actual speed) per lane is included. Next, the number of vehicles on the lane is added, as this gives an indication of e.g. the severity of the summed delay (many waiting vehicles may be worse than just one). Moreover, the number of halted (i.e. with speed of zero) vehicles on the lane is included, as well as the average speed of all vehicles on the lane - since just moving incredibly slowly may be worse than not moving at all (at least, for human drivers). Furthermore, the average acceleration of vehicles on the lane is included, as this gives an indication of how smooth the traffic moves, and finally, the number of emergency stops made on the last time step (over all lanes) is added, as emergency stops cause dangerous situations. Earlier work [50] uses one of four representations: a) a vector of partitioned vehicle counts per lane, b) a boolean vector of evenly partitioned distances to the intersection (a one indicating the occupation of each partition), c) a boolean vector of unevenly partitioned distances to the intersection (again, a one indicating the occupation of each partition) or d) a vector of partitioned vehicle counts per lane, combined with traffic light state information. Compared to this work, the feature vector of the linear agent in this thesis has access to more information. Since a linear function approximator cannot represent non-linear dependencies, the feature vector is extended to a combination of the state feature vector and a one-hot vector ~a specifying the last chosen action. In this case, the one-hot vector is a vector with as many entries as there are actions, that is, zero everywhere except on the index of the last chosen action, which is one. For example, if the second action out of four possible actions was taken: 0 1 (39) ~a = 0 0 This results in a complete state, action representation φ0 (s, a) where the state representation is repeated |A| times, and set to zero unless it is at the repetition corresponding to the index of the last taken action: a0 φ0 (s) a0 φ1 (s) .. (40) φ0 (s, a) = . an φm−1 (s) an φm (s) Thus, each action has its own state feature subvector that is only active (i.e. non-zero) if the action is active. By doing this, actions can be related to state representations in a non-linear way. 3.2.2
Deep Q-learning Agent
The DQN agent uses an image as state representation. In the most basic version, this image is an n × m binary matrix, the position matrix, where a one indicates the presence of a vehicle on a location, and a zero the absence of a vehicle on that location. The locations are computed by discretizing the continuous space of car locations into an n × m matrix. An artificial example of vehicle positions and a corresponding (6 × 6) position matrix is presented in Figure 3.2. The matrix used in this approach includes current traffic light settings as floats between 0 and 1 (see Table 2), placed on the corresponding traffic light’s location within the binary position matrix. These values were chosen to be a) non-zero (as a zero indicates an empty position) b) have the same step size and c) be between 0 and 1. While the specific values are arbitrary, they are included for the sake of reproducibility. A more straightforward option would have been to include these as binary features, such as whether or not each light is green, red, and so forth, but adding matrices to the state representation increases memory and computation demands. The size of n and m are parameters that can be set; higher n and m result in a more fine-grained, higherinformation matrix, but are also more demanding computationally and memory-wise. The simple, single-frame position matrix does not necessarily contain enough information to compute the optimal action - for one, it lacks information on car speeds. 18
0 0 0 1 0 0
0 0 0 0 0 0
0 0 1 0 0 0
0 0 0 0 1 1
0 0 0 0 0 0
0 0 0 1 0 0
(a) Example positions of vehicles on lanes controlled by (b) Example 6 × 6 position matrix of corresponding to the traffic light agent. vehicle locations in 3.2a.
Figure 3.2: Example vehicle positions and corresponding binary position matrix. Multiple Position Matrices The problem of only having car locations may be alleviated by appending position matrices for previous time steps, similar to how earlier research attempts to turn a POMDP into an MDP by including previous game frames2 [31] . Each additional position matrix results in implicitly adding another order derivative of the position matrix with respect to time (see Table 1). Frames 1 2 3 4 5
Information Position Speed Acceleration Jerk Jounce
Derivative w.r.t. position 0th 1st 2nd 3rd 4th
Table 1: Number of frames, versus the added information and which order derivative with respect to the car positions it entails. At least the first three information types are sensible intuitively: after position, speed is useful to differentiate between a jam and a queue of moving cars. Acceleration is needed to prevent emergency stops - these occur in SUMO when a vehicle’s acceleration is less than −4.5 m/s2 . Jerk - the change in acceleration over time - and jounce - the change in jerk over time - are harder to interpret in the context of traffic control. Value Matrices Instead of adding frames to implicitly add information about speed and acceleration and having the agent learn their relation to the actions and rewards, it may be possible to save training time by directly adding matrices containing vehicle speeds and accelerations to the input matrix. In that case, the input layers are as follows: 1. A binary matrix where each vehicle’s location at time t is represented as 1, the rest is 0 2. A matrix where each vehicle v’s position is represented as a percentage of the maximum allowed speed, the relative speed srel v,t . This is computed by dividing the speed of vehicle v on time step t by the maximum sv,t allowed speed on the vehicle’s lane l: srel v,t = max(sl ) 3. A matrix where each vehicle’s position is represented as the acceleration av,t with regards to the relative rel speed, av,t = srel v,t − sv,t−1 4. A matrix where each position is zero, except those of the halting lines of each stop light, where light values from Table 2 are used. These values were chosen to be a) non-zero, b) have the same step size and c) be between 0 and 1. While the specific values are arbitrary, they are included for the sake of reproducibility. 2 An approach that works for some games, but not all of them - even with the added game frames the agent cannot solve Montezuma’s revenge
19
State Representation Linear Frames Values
Red Value 0.333 0.2 0.2
Yellow Value 0.666 0.5 0.6
Green Value 0.999 0.8 1.0
Table 2: State representation values for different light colors. 3.2.3
Yellow Times
The yellow time Yt of a traffic light is the time that a stop light is yellow when going from green to red. The yellow time gives vehicles time to slow down before a red light. Since SUMO is a car-following, mostly collisionfree model, it is difficult to devise a reward signal to train the agent to select yellow times to prevent collisions. As such, the yellow time is set with a default value, and not learned by the agent. Thus, whenever an agent takes an action that requires switching at least one of the lights from green to red, that light turns to yellow for Yt seconds. In this thesis, a yellow time of one second is used3 . If the state representation consists of a single position matrix that includes light configurations, that means that the state is partially observable for any yellow time Yt > 1. Adding position matrices from earlier time steps allows longer yellow times while still maintaining full observability. However, if only a single position matrix is used with a yellow time of e.g. four seconds, the state sequence is a chain such as in Figure 3.3, but to the agent it is represented as the chain in Figure 3.4. That is, if the light goes from green to red, it is yellow for four seconds first. But since the agent can only observe the current traffic light configuration, it only observes that a yellow light goes to green in 14 of cases, and to yellow in 34 of cases. Thus, to an agent with only a single position matrix as state, stochasticity appears that is not there in reality. G
p=1
Y0
p=1
Y1
Y2
p=1
p=1
Y3
p=1
R
Figure 3.3: Chain of states for a yellow time of four seconds.
p=
G
p=1
Y
3 4
p=
1 4
R
Figure 3.4: Chain of states for a yellow time of four seconds, as observed by an agent that only receives the most recent position matrix with traffic light configurations as the state. To alleviate this problem, the last few traffic light configurations can be appended to the state, such that the state contains all traffic light configurations from t − Yt to t, where Yt is the yellow time as discussed in Section 3.2.3. Yellow Times in Linear Representation In the vector representation of the state that is used by the linear agent, the traffic light values are appended (as floats) to the feature vector. These values can be found in Table 2 and have been chosen such that the increase in values between lights was constant. Yellow Times in Position Matrices Representation In the representation where each position matrix is a binary matrix with vehicle positions on a time step, the current light configuration is included within the original binary matrix frame. That is, each time step’s position matrix now also includes traffic light values on the positions of the individual lights. The specific settings can be found in Table 2. These settings were chosen such that a) each value was non-zero, since 0 represents empty positions, b) no value was 1, which represents a vehicle. 3
The yellow time may also be set using the recommendations from the traffic engineers handbook [35], using the formula: Yt = t +
V 2a + 2Gg
(41)
where Yt is the yellow time in seconds, t is the reaction time of drivers, typically set to 1s, V is the design speed, which in this case can be taken to be the maximum allowed speed of 70 km/h, a is the deceleration rate, typically ∼ 3 m/s, G is acceleration due to gravity, 9.81 m/s, and g is the grade of approach, which is 0 for the roads in the examples. So, the yellow time would be ≈ 4.2 seconds for the traffic scenarios in this thesis.
20
Yellow Times in Values Representation In the values matrix representation, where each matrix includes additional information about each vehicle on its current position, an input layer is added with on the location of each traffic light its corresponding value according to Table 2, as discussed in Section 3.2.2. These settings were chosen such that each value was non-zero, since zero represents empty positions. One matrix is added per second of yellow time, that is, if the yellow time is four seconds, the last four traffic light matrices are added to the state. In the special case that no static yellow time is employed, a single traffic light matrix is still used, since the current traffic light configuration is part of the state.
3.3
Action Space
Since SUMO is a (mostly) collision-free model, there is no direct way to punish the agent for collisions due to illegal traffic light configurations, except for penalizing of teleportations, which can also be caused by traffic jams. Thus, the action space is restricted to only the set of legal traffic light configurations for the intersection. A traffic light configuration is illegal if it allows vehicles from intersecting edges to cross at the same time. Two separate types of action spaces are defined: those with set yellow times and those where the yellow time has to be learned. One possible way to learn yellow times is by penalizing emergency stops, which in SUMO are defined as a deceleration of more than 4.5 m/s2 . If the agent switches between different traffic light configurations very fast, this causes vehicles to have to make a lot of sudden stops. By penalizing the agent for these stops, it may learn to employ yellow times properly on its own.
3.4
Reward Function
Selecting an appropriate reward function for the traffic control problem is not trivial. For one, it depends on the desired goal for the agent: for example, to minimize traffic jams, a penalty could be applied for each time step that the agent is not moving. However, this results in frequent switching being optimal: by continually switching between red and green lights for a lane, vehicles are frequently moving, and never stopping for long. However, vehicles stopping and starting continuously is not desired behavior. Another possibility is measuring the delay of each vehicle: the normalized delay of a vehicle is defined as subtracting the vehicle’s current speed from its maximum allowed speed and dividing by the maximum allowed speed of the current lane. When the normalized delay is one, the car is at a standstill, and when it is zero, the car is moving at an optimal speed. However, preliminary experiments showed that situations occur where it is optimal to never open up a road as long as there are cars moving on the other road. Thus, delay is not an optimal measure either. Moreover, a) there should not be many emergency stops and b) the learned policy should not lead to flickering, i.e. changing light states on each time step, since these two things make for unpleasant and unsafe driving. Furthermore, teleports should be prevented, since they occur in SUMO during either jams or would-be collisions. This leads to a reward function that is a weighted sum of these five factors, the weights of which are experimentally set (see Section 4.1).
3.5
Single agent scenario
The scenario used for all single-agent experiments is a simple single intersection as seen in Figure 3.5b. The roads connected to the junction are all 500 meters long, and have one incoming and one outgoing lane each.
21
(a) Simple single intersection, complete.
(b) Simple single intersection, zoomed in.
Figure 3.5 To generate different problem instances, traffic demand data is generated using a uniform distribution over all traffic directions, with a probability of 0.1 for a vehicle to be generated on each direction on each of 3600 time steps. There are four individual stop lights on the intersection, so the legal actions for yellow time Yt > 0 are rgrg (red, green, red, green) and grgr (green, red, green, red) - see Figure 3.6a and 3.6b. The legal actions for Yt = 0 are rgrg, grgr and ryry (red, yellow, red, yellow) and yryr (yellow, red, yellow, red) - see Figure 3.6a through 3.6d.
(a) rgrg - red, green, red, green
(b) grgr - green, red, green, red
(c) ryry - red, yellow, red, yellow
(d) yryr - yellow, red, yellow, red
Figure 3.6: Four possible actions (traffic light settings) for the single agent scenario
22
4
Single Agent Experiments
This section describes the experimental details and results of using the DQN algorithm to train a single traffic light agent.
4.1
Reward Function
As described in Section 3.4, the reward function is essentially a weighted sum of five factors: waiting time, delay, emergency stops, switches and teleports. To find the best weights, six different weight settings for the reward function - found in Table 3 - are tested experimentally. Setting 1 2 3 4 5 6
Teleport 0.20 0.20 0.10 0.00 0.10 0.10
Wait time 0.20 0.30 0.30 0.25 0.50 0.20
Stops 0.20 0.10 0.20 0.25 0.10 0.10
Switches 0.20 0.10 0.10 0.25 0.10 0.10
Delay 0.20 0.30 0.30 0.25 0.20 0.50
Table 3: Weight settings for six reward function evaluation experiments These different networks were evaluated after training for 60, 000 steps - after which they all reported relatively low TD-error and high reward - by testing their greedy policy on the same 16 seeds4 and reporting the average travel time over all vehicles in the simulation. The average travel time is used as a measure of how well the reward function works, since minimizing travel time is a goal, but it is not a suitable reward function since it can only be computed at the end of a simulation, resulting in sparse and delayed rewards. The average travel time is also not directly expressible in terms of the reward function components, so that it is a very suitable way to evaluate the reward function. Note that using the same 16 seeds means that each network had to process the same number of vehicles with the same routes within a seed. The results of the evaluation can be found in Table 4. 1 2 3 4 5 6 7 8 9 10 11 12 13 14 15 16 Mean Sum
1 415.28 400.07 434.11 464.98 370.12 330.12 436.53 340.46 433.13 453.08 330.60 479.32 413.39 404.19 448.75 461.97 413.51 6616.11
2 207.34 320.49 210.25 221.42 262.52 316.16 303.18 318.48 426.01 290.60 257.32 235.24 382.59 262.59 392.60 302.74 294.35 4709.54
3 279.86 340.21 214.23 407.75 185.25 226.34 204.72 163.15 405.47 273.18 223.69 216.87 340.68 197.15 309.85 208.63 262.32 4197.05
4 325.80 299.16 342.46 266.24 326.30 352.66 386.42 545.41 280.47 289.64 447.59 299.16 374.53 268.43 284.04 244.52 333.30 5332.83
5 397.38 435.04 331.69 449.96 339.15 367.63 422.86 419.15 278.77 289.38 383.37 290.98 311.72 483.46 269.76 330.78 362.57 5801.08
6 452.29 453.48 397.67 456.68 344.53 465.78 408.05 271.80 258.14 387.11 466.93 470.25 262.27 471.82 191.22 324.51 380.16 6082.53
Table 4: The average travel time (in simulation steps) over all vehicles in a simulation, for each of six reward function settings and 16 different seeds. 4 16,
since the computing cluster used - LISA - can run 16 scripts in parallel on a single node
23
Since travel time is the shortest for setting three, the reward on time step t is set to be rt = 0.1 × number of teleports + 0.1 × number of action switches + 0.2 × number of emergency stops + 0.3 × sum delay + 0.3 × sum wait time
4.2
(42)
Demand Data
Demand data in SUMO relates to how many vehicles drive over which lanes over time. Each vehicle has a route, a list of connected edges, which it will drive over to go from a source to a destination. Demand data is artificially generated for the single-agent intersection using Algorithm 4. Algorithm 4 Demand Data Generation 1: 2: 3: 4: 5: 6: 7: 8: 9: 10:
Define 4 route types: up-down, down-up, left-right, right-left Routes have probability p Initialize ROUTE LIST = [] for t = 0 to N do for ROUTE in ROUTE TYPES do Sample ρ ∼ U(0, 1) if p > ρ then ROUTE LIST.append(ROUTE) with depart time t end if end for end for
To generate traffic demand for a simulation, N = 3600 and p = 0.1 are set. Thus, the expected number of vehicles in the entire single junction simulation is 3600 × 4 × 0.1 = 1440 cars, with departure times between 0 and 3600.
4.3
Baseline
The performance of the DQN agents is compared to a baseline. Similar to earlier work [38], the DQN agent is compared to a linear agent. The baseline selected is the linear agent that found the policy with the highest average reward during training, which is evaluated on 16 simulations. A traffic light agent has a set of controlled lanes, and these contain the local state. The state, action features φ0 (s, a) are as detailed in Section 3.2.1, where additionally: • The waiting time per car is clipped to be no larger than 1.5 • The delay per vehicle is measured as a percentage of its maximum allowed speed • The light state of the agent, represented as an array of values depending on light color, is added to φ0 (s, a) • A bias of 1.0 is added to φ0 (s, a)
4.4
Deep Q-learning Agent
The first DQN agent (hereafter the baseline DQN agent) is trained with Algorithm 3 using the settings in Table 5. An �−greedy policy is used during training, where � = 1.0 until the replay memory is full, at which point � = 0.1.
24
Parameter Replay memory size Experience sampling Learning rate (α) Batch size Exploration rate (�) Discount factor (γ) Freeze interval State matrix size State matrix type State matrix frames Gradient momentum Squared gradient momentum
Value 50000 Uniform 0.001 32 0.1 0.99 30000 84 × 84 Binary + light configurations 1 0.95 0.95
Table 5: Settings for the baseline DQN agent To evaluate the learned policies for each agent, 16 SUMO simulations are run using the purely greedy policy, at every 10, 000 training steps (until 1, 000, 000 training steps), such that an approximation of the training curve is evaluated using the greedy policy. Figure 4.1 plots the performance in terms of average reward (and standard error) and average vehicle travel time (and standard error) of the baseline DQN agent over time. Standard error5 is rather low - since the demand data generation settings are the same between evaluations, the problems the agent is tested on may be rather similar. As a baseline, the best performing version of the linear agent is plotted as a horizontal line in the same figure. While the average reward rises overall, average travel time decreases overall, and the learned policy is much better than the baseline, there is a lot of instability still - there are a lot of sharp decreases in reward (increases in travel time) even after the network has already found a relatively good policy. This is possibly caused by so-called catastrophic forgetting [27] - since the Q-function is updated globally, an update that fixes a small TD-error in one sample can cause the agent to massively underperform on other samples. The graph also shows that even when there is a dip in performance, the network re-learns the policy rather quickly (in under 10,000 time steps). Thus, these oscillations do not result in complete divergence, but they cause the network to be unreliable without extensive testing. Moreover, note that Figure 4.1 shows that in general, a low reward results in higher average travel time and a high reward results in a lower average travel time. Thus, while the used reward function is not a one-on-one mapping to the average travel time, it is a good proxy: maximizing the reward minimizes the average travel time. 0
500
10
450 400
20
Average travel time
Reward
30 40 50 60
300 250 200 150
70 80 0.0
350
100 0.2
0.4
Time steps
0.6
0.8
50 0.0
1.0 1e6
(a) Average reward and standard error.
0.2
0.4
Time steps
0.6
0.8
1.0 1e6
(b) Average travel time and standard error.
Figure 4.1: Average reward and travel time of the greedy policy for the baseline DQN agent. The single horizontal line represents the mean and standard error of the best performing linear agent.
4.5
Stability Issues
While earlier work reports great results on the Atari benchmark [31], other findings - that DQN does not converge reliably for all problems [41, 55, 7] - are replicated for the traffic control problem. Specifically, for the 5 The
standard error is given by
√σ , n
where σ is the standard deviation of the sample, and n is the sample size.
25
traffic control problem, DQN results in oscillation instead of convergence. The effect of different parameters on oscillation for the single agent problem is investigated below, and these findings are used a) to train a fine-tuned version of the original DQN agent, and b) for parameter selection in the multi-agent setting. 4.5.1
Network Architectures
Two different network architectures are tested, ‘NIPS’ (architecture taken from earlier work published at the NIPS conference [30]) and ‘Nature’ (architecture taken from earlier work published in Nature [31]). The NIPS architecture is more shallow and simple compared to the Nature architecture - both can be found in Figure 4.2. The results are presented in Figure 4.3. The NIPS architecture appears slightly more stable, whereas Nature’s reward often drops below the baseline. This difference may be caused by the Nature architecture being deeper and more complex, and thus needing more training time before convergence, as well as being more likely to diverge. NIPS
Nature
Input Batch size × width × height × frames
Input Batch size × width × height × frames
Convolutional layer 16 filters, size 8 × 8, stride 4 × 4
Convolutional layer 32 filters, size 8 × 8, stride 4 × 4
Rectifier
Rectifier
Convolutional layer 32 filters, size 4 × 4, stride 2 × 2
Convolutional layer 64 filters, size 4 × 4, stride 2 × 2
Rectifier
Rectifier
Convolutional layer 64 filters, size 3 × 3, stride 1 × 1
Fully connected layer 256 nodes
Rectifier
Rectifier
Fully connected layer Output
Fully connected layer 512 nodes
Rectifier Fully connected layer Output Figure 4.2: NIPS and Nature network architectures
26
0
500
10
450 400
20
Average travel time
Reward
30 40 50 60
300 250 200 150
70 80 0.0
350
100 0.2
0.4
Time steps
Architecture: Nips
0.6
0.8
50 0.0
1.0 1e6
0.2
Architecture: Nature
0.4
Time steps
Architecture: Nips
0.6
0.8
1.0 1e6
Architecture: Nature
Figure 4.3: NIPS vs Nature 4.5.2
Learning rate
An obvious contender for improving stability is the learning rate, since high learning rates are associated with divergence and oscillations in stochastic gradient descent, even in traditional machine learning, due to overshooting of the local minimum. Especially in the case of oscillations due to catastrophic forgetting, using smaller learning rates may prevent large oscillations because the agent employs smaller updates. However, because of ADAM’s adaptive gradients, stability should not be influenced too much by the learning rate. Figure 4.4 shows the average reward per episode during training for high (α = 0.01) and lower (α = 0.00025, from [31]) learning rates. While the reward for the agent that uses the higher learning rate starts oscillating earlier than the reward for the lower learning rate (at around 600, 000 training steps versus 800, 000 training steps), the latter also starts to oscillate near the end of the graph. It is entirely possible that with longer training, the low learning rate agent would display the same behavior the original agent does. As such, lowering the learning rate is not a constructive solution, especially when using sophisticated updaters such as ADAM. 0
500
10
450 400
20
Average travel time
Reward
30 40 50 60
300 250 200 150
70 80 0.0
350
100 0.2
0.4
Time steps
α =0.001
0.6
0.8
50 0.0
1.0 1e6
α =0.00025
(a) Average reward and standard error.
0.2
0.4
0.6
Time steps α =0.001 α =0.00025
0.8
1.0 1e6
(b) Average travel time and standard error.
Figure 4.4: Effect of learning rate on reward and travel time. 4.5.3
Optimization Algorithms
We compare three different optimizers: SGD, ADAM [18] and RMSProp [52]. The last two optimizers are very similar, but ADAM has been shown to outperform RMSProp [18]. The results of this comparison can be found in Figure 4.5, where the first two graphs compare ADAM to RMSProp, and the second two graphs compare ADAM to SGD. While ADAM is faster to learn a good policy, it is not more stable than RMSProp. It does, however, seem to find policies that RMSProp is not able to within the given time. Unexpected is the abysmall performance of SGD: while it was expected to underperform compared to ADAM and RMSProp, in practice it performs very badly. Manual inspection shows that it maps every state to the same Q-values for each action during testing,
27
In contrast, the training curves showed that at training time it found acceptable policies - though not as good as some of those found by ADAM and RMSProp. Moreover, its temporal difference errors converged. This behavior is similar to that of the DDQN agent (see Section 4.5.6). A possible explanation is that, when using SGD, the agent does not learn to distinguish states and instead maps each state to the same action. Since that results in suboptimal actions, the action that each state is mapped to changes during training, resulting in a normal policy (switching actions often is suboptimal but will not lead to very bad performance). However, during testing the Q-value no longer changes, and thus the agent selects the same action for every state, resulting in terrible performance. This could be tested by logging the action values per agent for each training step, as well as the number of vehicles per lane, and then seeing if the highest Q-value a) is independent of the state and b) switches back and forth. This is left to future work (see Section 10.1). Note also the start of the average travel time graph for RMSProp: while RMSProp’s reward before training is very low, the average travel time is already very good. This indicates that perhaps the reward function used is not a perfect proxy for the average travel time. 0
500
10
450 400
20
Average travel time
Reward
30 40 50 60
300 250 200 150
70 80 0.0
350
100 0.2
0.4
Time steps
optimizer=ADAM
0.6
0.8
50 0.0
1.0 1e6
optimizer=RMSProp
(a) Average reward and standard error.
Time steps
0.6
0.8
1.0 1e6
optimizer=RMSProp
(b) Average travel time and standard error. 500
10
450 400
20
Average travel time
30
Reward
0.4
optimizer=ADAM
0
40 50 60
350 300 250 200 150
70 80 0.0
0.2
100 0.2
0.4
Time steps
optimizer=ADAM
0.6
0.8
50 0.0
1.0 1e6
optimizer=SGD
0.2
0.4
Time steps
optimizer=ADAM
(c) Average reward and standard error.
0.6
0.8
1.0 1e6
optimizer=SGD
(d) Average travel time and standard error.
Figure 4.5: Effect of optimization algorithm on reward and travel time. 4.5.4
Batch Normalization
To test the effect of batch normalization, the baseline DQN agent is compared to an agent with the same settings, with the addition of batch normalization. The results are presented results in Figure 4.6. Similarly to earlier work [40], results show that using batch normalization [14] destabilizes the system. While a good policy is found much faster than for the baseline DQN agent, the agent starts oscillating immediately after and eventually no longer reaches even the level of the baseline. This is in line with the fact that batch normalization speeds up learning, but the noise introduced by estimating mini-batch statistics destabilizes learning [40]. The instability may also be related to the fact that in regular deep learning problems, the underlying data distribution is stationary, whereas in the DQN algorithm the distribution changes as the system learns. As a result, the minibatch statistics can never be a proper approximation of the population statistics, as these change continuously during training. 28
0
600
10
500
20
Average travel time
Reward
30 40 50
400
300
200
60 100
70 80 0.0
0.2
0.4
Time steps
Architecture: Nips
0.6
0.8
0 0.0
1.0 1e6
Architecture: Nips_bn
0.2
0.4
Time steps
Architecture: Nips
(a) Average reward and standard error.
0.6
0.8
1.0 1e6
Architecture: Nips_bn
(b) Average travel time and standard error.
Figure 4.6: The effect of batch normalization on reward and average travel time. 4.5.5
Prioritized Experience Replay
The effect of rank-based prioritized experience replay is tested for temperatures of 0.0 (the baseline, uniform sampling) 0.5 (midway between uniform and greedy sampling) and 1.0 (completely greedy sampling). The rank-based variant is used, as it should be more robust to outliers [41]. The results comparing τ = 0.0 and τ = 0.5 are presented in the first two graphs in Figure 4.7 and the results comparing τ = 0.0 and τ = 1.0 are presented in the last two graphs in Figure 4.7. Prioritized experience replay is found to stabilize the system somewhat, as well as reducing oscillation. The network trained with τ = 0.5 is most stable. By setting τ = 0.5, greedy prioritized sampling and uniform sampling are balanced. As mentioned in earlier research [41], using completely greedy sampling does not help in stabilizing the system at all - in Figure 4.7 the greedy sampler is even less stable than the uniform baseline. To understand why the balanced setting performs best, consider the fact that one odd sample - with a high TD-error - is sampled deterministically in completely greedy prioritized sampling (τ = 1.0), whereas in balanced prioritized sampling, this is not the case, so that these ‘noise spikes’ [41] are less influential in the balanced case. Moreover, the balanced prioritized sampler recovers from oscillations more easily, possibly due to its balance between sampling transitions with high TD-error and sampling more average transitions. By using both types of transitions in the update, the agent is prevented from forgetting the ‘regular’ patterns in the long-term (i.e. sampling these average transitions protects from catastrophic forgetting). On the other hand, by not sampling completely uniformly, the balanced sampler enables a fast recovery from reward dips, because it samples high information transitions more than the uniform sampler. This is important, since in catastrophic forgetting, normal transitions will receive a high TD-error, since the model’s Q-value approximation of these transitions is suboptimal.
29
0
500
10
450 400
20
Average travel time
Reward
30 40 50 60
300 250 200 150
70 80 0.0
350
100 0.2
0.4
0.6
Time steps τ =0.0 τ =0.5
0.8
50 0.0
1.0 1e6
(a) Average reward and standard error. 500
10
450
0.6
Time steps τ =0.0 τ =0.5
0.8
1.0 1e6
400
20
Average travel time
30
Reward
0.4
(b) Average travel time and standard error.
0
40 50 60
350 300 250 200 150
70 80 0.0
0.2
100 0.2
0.4
0.6
Time steps τ =0.0 τ =1.0
0.8
50 0.0
1.0 1e6
(c) Average reward and standard error.
0.2
0.4
0.6
Time steps τ =0.0 τ =1.0
0.8
1.0 1e6
(d) Average travel time and standard error.
Figure 4.7: Effect of temperature in prioritized experience replay on reward and travel time. 4.5.6
Double Q-learning
DDQN appears normal during training, where the training curve (not pictured) is very stable - the temporal difference errors converge - although it does not reach the policies with the highest rewards that some of the less stable networks find. However, during evaluation of the greedy policy it performs abysmally - see Figure 4.8. Manual inspection of the behavior learned by DDQN suggests that DDQN assigns extremely similar Q-values to all actions, regardless of the state. Plotting the convolutional filters shows that all filters are ‘dead’, i.e. completely zero, regardless of the input. For clarity, the filter activations for a simulation after 100 time steps are plotted in Figure 4.9 and compared to the filters of the original DQN agent. For further comparison, a DDQN network is trained with a smaller learning rate (α = 0.00025) and compared. Interestingly, while all three agents have some dead filters, DDQN with α = 0.00025 has the least. However, it still displays the anomalous behavior seen in the first DDQN agent. On the other hand, among the few filters in the original DQN agent in the second layer that are properly activated, one is a very well-defined cross, whereas the same layer in the DDQN agents has either dead or very fuzzy filters. These suboptimal filter activations suggest that the DDQN agent is not learning properly, resulting in mapping each state to the same action, which does not appear bad during training, where this action changes as the Q-function changes, but performs terribly during testing, where the end-result is the agent choosing the same action for every state. Similar behavior occurs for the SGD agent in Section 4.5.3, suggesting that this is a structural problem. One explanation is that DDQN’s tendency to underestimate action values [54] is detrimental to the specific problem of traffic light control.
30
0
500
10
450 400
20
Average travel time
Reward
30 40 50 60
350 300 250 200 150
70
100
80 0.0
0.2
0.4
Time steps
Type: DQN
0.6
0.8
50 0.0
1.0 1e6
0.2
Type: DDQN
0.4
Type: DQN
(a) Average reward and standard error.
0.6
Time steps
0.8
1.0 1e6
Type: DDQN
(b) Average travel time and standard error.
Figure 4.8: Effect of Double DQN on reward and travel time.
0 80 70 60 50 40 30 20 10 0
0
10
20
30
40
50
60
70
80
50
60
70
80
50
60
70
80
(a) DDQN, α = 0.001
0 80 70 60 50 40 30 20 10 0
0
10
20
30
40
(b) DDQN, α = 0.00025
0 80 70 60 50 40 30 20 10 0
0
10
20
30
40
(c) DQN, α = 0.001
Figure 4.9: Matrix representation of simulation state after 100 time steps, and corresponding first and second convolutional layer filter activations for DDQN, DDQN α = 0.00025 and DQN agents. 4.5.7
Freeze Interval
Freezing the target network weights for longer times is expected to stabilize the system, due to targets moving less often. To test this assumption, the baseline freeze interval (M = 30, 000) is compared to both a smaller (M = 10, 000) and a larger (M = 50, 000) freeze interval. Figure 4.10 shows that neither a smaller (M = 10, 000 - first two graphs) nor a larger (M = 50, 000 - last two graphs) freeze interval results in a very stable agent. For the smaller freeze interval, this may be caused by updates moving too fast, such that the goal of using the target network - to stabilize the target values - is not being reached. Recall that the simulation episodes are cut short after 10, 000 time steps. This means that
31
for very bad policies, and M = 10, 000, the target network will be updated every episode, which may not be desirable, especially for problems where episodes can be rather different from one another. For the larger freeze interval, the instability may be caused by a) needing more training time - the target network is not updated often, so the action network’s updates are not in the optimal direction yet or b) waiting too long between target network updates results in a need for very strong gradient updates when it is finally updated, or c) the target updates take too long, and the system starts moving in the wrong direction, unable to get out of a bad trajectory. 0
500
10
450 400
20
Average travel time
Reward
30 40 50 60
300 250 200 150
70 80 0.0
350
100 0.2
0.4
Time steps
M =30000
0.6
0.8
50 0.0
1.0 1e6
M =10000
(a) Average reward and standard error.
Time steps
0.6
0.8
1.0 1e6
M =10000
(b) Average travel time and standard error. 500
10
450 400
20
Average travel time
30
Reward
0.4
M =30000
0
40 50 60
350 300 250 200 150
70 80 0.0
0.2
100 0.2
0.4
Time steps
M =30000
0.6
0.8
50 0.0
1.0 1e6
M =50000
0.2
0.4
Time steps
M =30000
(c) Average reward and standard error.
0.6
0.8
1.0 1e6
M =50000
(d) Average travel time and standard error.
Figure 4.10: Effect of freeze interval on reward and travel time. 4.5.8
Experience Replay Memory Size
Since the size of the experience replay memory determines the age of the samples used to update the Q-function, the effect of using different memory sizes, |D| is compared in Figure 4.11, where the first two graphs compare |D| = 50, 000 with |D| = 10, 000, and the last two graphs compare |D| = 50, 000 with |D| = 100, 000. When training has just started, the largest memory size (|D| = 100, 000) is least stable, and the smallest size (|D| = 10, 000) is doing very well. However, after 1 million time steps, the situation has reversed: the largest memory is not oscillating as much, and has shallower reward dips, whereas the smallest memory is least stable. Moreover, each agent has found a good policy at some point in time, but the smallest memory is least able to stay there. Perhaps regular updates using some older experience are needed to prevent the agent from constantly learning and then forgetting optimal behavior (i.e. catastrophic forgetting is prevented by updating using some older experience). An agent with |D| = 10, 000 with a bad policy (resulting in episodes of maximum length 10, 000 time steps) can only store experience of the latest episode.
32
0
500
10
450 400
20
Average travel time
Reward
30 40 50 60
300 250 200 150
70 80 0.0
350
100 0.2
0.4
Time steps
D =50000
0.6
0.8
50 0.0
1.0 1e6
D =10000
(a) Average reward and standard error.
0.6
Time steps
0.8
1.0 1e6
D =10000
(b) Average travel time and standard error. 500
10
450 400
20
Average travel time
30
Reward
0.4
D =50000
0
40 50 60
350 300 250 200 150
70 80 0.0
0.2
100 0.2
0.4
Time steps
D =50000
0.6
0.8
50 0.0
1.0 1e6
D =100000
0.2
0.4
D =50000
(c) Average reward and standard error.
0.6
Time steps
0.8
1.0 1e6
D =100000
(d) Average travel time and standard error.
Figure 4.11: Effect of memory size on reward and travel time. 4.5.9
State Representations
This section compares different state representations for the DQN agent. It presents the effect of adding position matrices, explicitly including vehicle speed and acceleration information, and position matrix sizes. Number of Position Matrices Since adding binary position matrices implicitly adds information about speed, acceleration, and so forth, different numbers of matrices are compared. The results are presented in Figure 4.12 (where the first two graphs compare one matrix with two matrices, the second two graphs compare one matrix with three matrices and the last two graphs compare one matrix with four matrices). The agent using four matrices appears the most stable after one million time steps - it has no deep reward dips - but all settings end up at a better policy than the baseline with only one frame after one million time steps.
33
0
500
10
450 400
20
Average travel time
Reward
30 40 50 60
300 250 200 150
70 80 0.0
350
100 0.2
0.4
Time steps
frames=1
0.6
0.8
50 0.0
1.0 1e6
frames=2
(a) Average reward and standard error. 10
450
Average travel time
30
Reward
0.6
0.8
1.0 1e6
frames=2
400
20
40 50 60
350 300 250 200 150
70
100 0.2
0.4
Time steps
frames=1
0.6
0.8
50 0.0
1.0 1e6
0.2
frames=3
0.4
Time steps
frames=1
(c) Average reward and standard error.
0.6
0.8
1.0 1e6
frames=3
(d) Average travel time and standard error.
0
500
10
450 400
20
Average travel time
30
Reward
Time steps
(b) Average travel time and standard error. 500
40 50 60
350 300 250 200 150
70 80 0.0
0.4
frames=1
0
80 0.0
0.2
100 0.2
0.4
Time steps
frames=1
0.6
0.8
50 0.0
1.0 1e6
frames=4
0.2
0.4
Time steps
frames=1
(e) Average reward and standard error.
0.6
0.8
1.0 1e6
frames=4
(f) Average travel time and standard error.
Figure 4.12: Effect of the number of position matrices on reward and travel time. Binary versus Value Matrices The representation of a binary matrix with traffic light configuration information is compared to the state representation that is a combination of multiple value matrices, the first with vehicle positions, the second with vehicle speeds, the third with vehicle accelerations and the fourth with light configurations. Since the values representation has four matrices, the binary representation used is the one with four position matrices. The results are presented in Figure 4.13. It seems that the values representation is starting to oscillate much more strongly than the binary matrix. This may just mean that it would need longer to converge, perhaps finding a better policy overall after some more training time, or perhaps the values are redundant and slow down learning, resulting in a bigger space to search. This can easily be tested by allowing the algorithm
34
run for many more simulation steps, which is left to future work (see Section 10.1). 0
500
10
450 400
20
Average travel time
Reward
30 40 50 60
300 250 200 150
70 80 0.0
350
100 0.2
0.4
Time steps
state=Binary
0.6
0.8
50 0.0
1.0 1e6
state=Values
0.2
0.4
Time steps
state=Binary
(a) Average reward and standard error.
0.6
0.8
1.0 1e6
state=Values
(b) Average travel time and standard error.
Figure 4.13: Effect of state representation type on reward and travel time. Matrix Size Since there is an inherent information loss present when converting from a continuous space of vehicles on roads to a discrete matrix of vehicle positions, the matrix sizes of 84 × 84 (from [31]) are compared to double the matrix size, of 168 × 168. That is, the position matrix is a representation of the same area in the simulator, but is a more fine-grained representation in the 168 × 168 case. To contrast, it is also compared to half the matrix size, of 42 × 42. The results are represented in Figure 4.14, where the first two graphs compare the baseline 84 × 84 DQN agent with using a larger 168 × 168 matrix, and the last two graphs compare the baseline 84 × 84 DQN agent with using a smaller 42 × 42 position matrix. As training progresses, the larger size of the matrix does not help with stability so much (there are smaller reward dips, but larger travel time spikes compared to the original). However, the agent with larger matrix size finds a better policy than the original one, which is probably related to vehicles not being lost in the translation from the simulator to the larger matrix representation. On the other hand, the agent that uses a smaller matrix size is much more unstable than those that use the regular and larger matrix sizes. It is possible that when the matrix is too small, there is too much of the state that cannot be properly observed, and as a result the learning destabilizes.
35
0
700
10
600
20
500
Average travel time
Reward
30 40 50
300 200
60
100
70 80 0.0
400
0.2
0.4
0.6
Time steps size=84x84 size=168x168
0.8
0 0.0
1.0 1e6
(a) Average reward and standard error. 500
10
450
0.6
Time steps size=84x84 size=168x168
0.8
1.0 1e6
400
20
Average travel time
30
Reward
0.4
(b) Average travel time and standard error.
0
40 50 60
350 300 250 200 150
70 80 0.0
0.2
100 0.2
0.4
0.6
Time steps size=84x84 size=42x42
0.8
50 0.0
1.0 1e6
(c) Average reward and standard error.
0.2
0.4
0.6
Time steps size=84x84 size=42x42
0.8
1.0 1e6
(d) Average travel time and standard error.
Figure 4.14: Effect of frame size on reward and travel time.
4.6
Fine-tuned Deep Q-learning Agent
Based on the results of Section 4.4 to 4.5.9, a fine-tuned DQN agent is trained, with settings as displayed in Table 6. Even though four state matrices and 100, 000 memory size outperformed their counterparts, a lower number of frames (two) and a smaller replay memory size (|D| = 50, 000) are used, to prevent memory issues which arise due to computational limits.
Value 50,000 Prioritized, τ = 0.5 0.00025 32 0.1 0.99 30000 168 × 168 Binary + light configurations 2 0.95 0.95
Parameter Replay memory size Experience sampling Learning rate (α) Batch size Exploration rate (�) Discount factor (γ) Freeze interval State matrix size State matrix type State matrix frames Gradient momentum Squared gradient momentum
Table 6: Settings for the fine-tuned DQN agent The results of the fine-tuned DQN agent are compared to the baseline DQN agent in Figure 4.15. The fine-tuned agent is more stable and finds better policies than the baseline DQN agent, but still suffers from instability, 36
though not as badly as the baseline. 0
500
10
450 400
20
Average travel time
Reward
30 40 50 60
300 250 200 150
70 80 0.0
350
100 0.2
0.4
Time steps
Baseline
0.6
0.8
50 0.0
1.0 1e6
Finetuned
0.2
0.4
Time steps
Baseline
(a) Average reward and standard error.
0.6
0.8
1.0 1e6
Finetuned
(b) Average travel time and standard error.
Figure 4.15: Average reward and travel time of the greedy policy for the baseline DQN agent and the fine-tuned DQN agent.
37
5
Multi-Agent Reinforcement Learning
This section introduces the necessary background information for coordination in multi-agent systems.
5.1
Coordination in Multi-Agent Systems
A multi-agent system (MAS) is a system of multiple interacting agents within the same environment. In a cooperative multi-agent system (CMAS), agents cooperate to reach a common goal, often to maximize a common reward. Thus, in a CMAS, at every time step, the agents need to find an optimal joint action ~a∗ ~a∗ = (a1 , · · · , aN )
(43)
where a1 · · · aN are the actions of agents 1 to N , respectively. The optimal joint action is the action that optimizes some global payoff function. Using a centralized approach in finding the optimal joint action is usually not feasible, since the joint action space grows exponentially with the number of agents. A naive approach to coordination would have each agent select the action that maximizes her local reward. However, just combining all locally optimal actions into a joint action is not guaranteed to reach the global optimum [4]. Thus, the actions need to be jointly optimized, as the action agent i takes influences j’s optimal action. In multi-agent reinforcement learning, agents simultaneously learn their respective Q-functions. For an agent i, the actions taken by agent j 6= i are part of the environment. However, since j is learning alongside i, j’s Q-function and thus j’s policy and behavior change over time. This non-stationarity means that original convergence properties for single-agent algorithms no longer hold due to the fact that the best policy for i changes as the other agents’ policies change [5]. Thus, this is another version of the moving targets problem from Section 2.4.3 and earlier work turns off experience replay due to this non-stationarity [10]. To understand why, recall that experience replay allows the agent to use old and new experience during training. That means that in a non-stationary environment, older experience provides information that is no longer true. If the joint payoff functions of neighbouring agents are known in advance - or are learned separately, see Section 5.4.1 - coordination algorithms can be used to compute the optimal joint action.
5.2
Coordination Graphs
A coordination graph is a graphical representation of the decomposition of a global payoff function g into a set of smaller, local factors fij , where each factor is a smaller function, depending on a subset of the agents in the graph. For example, the coordination graph in Figure 5.1a is decomposed by CG(a1 , a2 , a3 , a4 ) = f12 (a1 , a2 ) + f23 (a2 , a3 ) + f34 (a3 , a4 )
(44)
where f12 , f23 and f34 are the factors that make up the coordination graph, and depend on the actions of their respective agents. To find the joint optimal action ~a∗ that maximizes a global payoff function g ~a∗ = arg max g(~a)
(45)
~ a
The following derivations follow the structure in [4]. The global maximization in Equation 45 can be decomposed as consequent local maximizations: max g(~a) = max · · · max g(~a) a1
~ a
aN
(46)
Which can be rewritten in terms of factors (below, each factor is dependent on only two agents, but this is not a requirement): � � max g(~a) = max · · · max f12 (·) + · · · + fN −1,N (·) (47) ~ a
a1
aN
Using the distributive law for the max operator, sums and maximizations can be switched to find a more computationally efficient order: � � (48) max g(~a) = max max f12 (·) + [· · · max fN −1,N (·)]]] ~ a
a1
a2
aN
Using this representation, coordination algorithms, such as Variable Elimination [13], can be employed to compute the optimal joint action. 38
5.3
Coordination Algorithms
This section introduces the coordination algorithms variable elimination and max-plus, both applicable to cooperative multi-agent systems represented as coordination graphs. 5.3.1
Variable Elimination
Variable Elimination [13] exactly computes the maximizing joint action, by maximizing over one agent at a time. For example, in the coordination graph in 5.1a, variable elimination would first eliminate agent 4 by maximizing over f34 and finding the best action for each action that agent 3 can choose. This is the best response function of agent 4, and it only depends on agent 3. Then, this is repeated for the other agents, until the last agent simply maximizes over the previous agents’ best response function. By maximizing over one factor at a time instead of over the global payoff function, variable elimination is much faster than optimizing over the entire joint action space. Although variable elimination is faster than maximizing over the global joint action space, it does not scale well for graphs with many connections between nodes (such as grids, which are common in traffic systems) because it grows exponentially in the number of agents in the largest factor. Moreover, it is not an anytime algorithm6 [24], and thus cannot be run with fewer iterations to get an approximate answer. Furthermore, it assumes that the factors are common knowledge for all agents [57]. Since the coordination algorithm must be run on every time step, using a computationally less expensive approximate algorithm, such as max-plus (see Section 5.3.2) is a better choice for a CMAS [20]. 5.3.2
Max-Plus
Finding the optimal joint action in a coordination graph is equivalent to finding the maximum a posteriori (MAP) state in a graphical model [58]. To do so, a variation of the max-product algorithm, max-plus, can be used. The max-product algorithm is an inference algorithm based on message passing, used to find the maximum a posteriori (MAP) state in graphical models. It is guaranteed to find an exact solution for acyclical graphs such as in Figure 5.1a. However, in cyclical graphs such as in Figure 5.1b, it is not guaranteed to converge to a good solution [4]. In the case of coordination between agents in a multi-agent system, the max-plus algorithm can be used instead [19]. Instead of maximizing all actions simultaneously, messages containing information over locally optimal actions are sent between agents to iteratively find the optimal joint action. Thus, a message from i to j [24]: � � X µij (j) = max fij (s, ai , aj ) + µki (i) (49) ai
k∈ne(i)\j
where ne(i)\j is the set of i’s neighbours, excluding j. In short, i sends a message to j that consists of a maximization over i and j’s factor and the messages i has received from its neighbours that are not j. By iteratively sending messages, max-plus converges to the maximal joint action in acyclical graphs. Moreover, the algorithm has an anytime solution, meaning that it can be run using fewer iterations, and still get an approximate solution.
5.4
Sequential Decision Making with Coordination
To apply coordination algorithms to a sequential decision making problem, the factors in the coordination graph are the joint Q-functions. In that case, the factor fij between two agents i and j is defined as fij (ai , aj ) = Qij (s, ai , aj ; θij )
(50)
where i and j are neighbouring agents, ai and aj are their actions and si and sj their states, s is the joint state over both agents and θij is the weight matrix parameterizing Qij . To find these functions, a naive approach would be to compute the sum of the individual Q-values: Qij (s, ai , aj |θi , θj ) = Qi (si , ai |θi ) + Qj (sj , aj |θj )
(51)
6 An anytime algorithm is an algorithm that has a good approximate solution even if it has not finished, but is supposed to find better solutions as it runs for longer periods of time.
39
A1
A4
f12 (a1 , a2 )
f34 (a3 , a4 )
A2
A1
f23 (a2 , a3 )
f41 (a4 , a1 )
A3
A4
(a) Example of acyclical coordination graph
f12 (a1 , a2 )
A2
f23 (a2 , a3 )
f34 (a3 , a4 )
A3
(b) Example of cyclical coordination graph
Figure 5.1: Examples of multi-agent systems represented as coordination graphs However, the optimal action for i is influenced by the action that j takes, and vice versa. A better approach is to learn the joint local function over two agents directly. While this approach is not feasible for large numbers of agents - since the joint action space grows exponentially in the number of agents - the decomposition of the global reward into a coordination graph makes this approach feasible, since the factors only contain a few agents. The globally optimal joint reward can then be computed using coordination algorithms such as max-plus. Earlier work learns the local joint Q-functions simultaneously between agents [20], but another approach is transfer planning [34], where the local joint Q-functions are learned separately from the multi-agent system and re-used at testing time. A third option is to combine these approaches: using transfer planning to initialize the weights of the Q-functions for the larger problem, and then simultaneously learning in the larger problem. More details on transfer planning can be found in Section 5.4.1. 5.4.1
Transfer Planning
In transfer planning [34], large problems consisting of many agents are solved by finding the Q-values Qσ of smaller source problems and using these as heuristics for the larger, multi-agent problem. For an example, see Figure 6.2. The term transfer planning is used because of its inspiration in transfer learning [49], where the value function of a source problem is used as an initialization of the value function of the current problem. Although there are no theoretical guarantees that these Q-functions are appropriate for the new problem, transfer planning is more efficient due to its decoupling of a large, multi-agent problem into smaller source problems that can be solved more easily. In the case of a CMAS that can be decomposed into a coordination graph, transfer planning entails learning the joint Q-value function for a subset of agents, and using this joint value function in a coordination algorithm such as max-plus. Specifically, the joint local Q-value Qf is learned for each factor f in coordination graph CG, separately from the other agents. Then, during execution, Qf is used to compute local payoff functions for use in e.g. max-plus. For the pseudocode of the entire algorithm, see Algorithm 5. The advantage of using transfer planning instead of multi-agent reinforcement learning is that the non-stationarity that appears when multiple agents learn in tandem is circumvented. Moreover, by learning the Q-function to a much simpler problem and then re-using it, less time has to be spent training. If the factors in the graph are very similar, only a single source problem needs to be found, which can be re-used for every factor. However, if the factors differ significantly, a source problem must be found for each factor individually, but no more source problems than factors are needed. Moreover, these source problems are easier and faster to train than learning Q-functions simultaneously. A disadvantage is that the approximation of the Q-value is less accurate, since during training there is no information about the result of other agents’ behavior - an agent can observe only the behavior of their direct neighbours.
40
Algorithm 5 Multi-Agent Transfer Planning with Deep Q-learning. 1: 2: 3: 4: 5: 6: 7: 8: 9: 10: 11: 12: 13:
∀ factor f ∈ CG: initialize Qf learned using Algorithm 3 Initialize s = s0 for time step t in episode do for factor f ∈ CG do ∀~af ∈ Af get local joint Q-value Qf (s, ~af ) // Get Q-values for each joint action in the factor end for ~a∗ = maxPlus( {Qf (s, ·)}) // Use max-plus to compute ~a∗ using the set of local joint payoffs for agent j = 1 · · · n do take action ~a∗j end for Get r, observe s0 Set s = s0 end for
41
6
Deep Multi-Agent Reinforcement Learning for Coordination in Traffic Light Control
This section describes the approach used to extend the deep reinforcement learning approach to a multi-agent setting. For the coordination algorithm the libDAI library [32] is used. For the experiments, a joint local Q-function is trained between two agents using the baseline and fine-tuned DQN settings for the single-agent case. The hyperparameters used in the coordination algorithm can be found in Table 7. Name Maximum iterations Tolerance Updates Damping factor
Setting 30 10−9 Sequential using a random schedule 0.5
Table 7: Parameter settings for coordination algorithm
6.1
Multi-Agent Scenarios
The approach is tested on three scenarios: first, a local joint payoff functions for the two-agent scenario in Figure 6.1 is trained and evaluated using Algorithm 3.
Figure 6.1: Two-agent scenario
6.2
Transfer Planning
Once the joint Q-value function for the two-agent scenario is learned, this is used as the source problem in transfer planning. To solve the multi-agent scenarios, this source problem is used for each pair of neighbouring agents. After finding the local joint Q-value function for the factors in the multi-agent problem, the Q-function is re-used for all similar factors in the larger multi-agent problem. For an example regarding a four-agent scenario, see Figure 6.2, where the Q-values for two two-agent source problems - Qσ and Qζ , for the rotated factor - are learned separately, and then applied to a coordination algorithm in the four-agent scenario. For the three-agent scenario, Qσ is re-used for both factors in the graph. Thus, the two-agent Q-function is re-used to compute a globally optimal joint action for the three-agent scenario in Figure 6.3 and the (cyclical) four-agent scenario in Figure 6.4.
42
Qσ
Qζ
Figure 6.2: Transfer planning for traffic light control
Figure 6.3: Three-agent scenario
43
Figure 6.4: Four-agent scenario
44
7
Multi-Agent Experiments
This section outlines experiments and results for the embedding of deep reinforcement learning into multi-agent traffic control.
7.1
Baseline
The performance of the DQN approach is compared to that of a baseline. Wiering’s vehicle-based approach [60], is a model-based reinforcement learning algorithm that uses a decomposition of the reward function based on the number of halted vehicles on each traffic light agent’s lanes. In Kuyer’s coordination approach [24] this is extended with max-plus to introduce coordination. For details on these algorithms, see Section 8. The baseline for the two-agent scenario uses Wiering’s vehicle-based decomposition to estimate Qi (s, ai , aj ). That is, for agent i, the Q-value is estimated over the joint action space between itself and its neighbour j. The baseline for the three- and four-agent scenarios uses Kuyer’s approach: the joint local Q-functions estimated using Wiering’s vehicle-based approach are combined with max-plus to introduce coordination. Similar to Section 4, the baseline selected is the model that found the policy with the highest average reward during training, which is evaluated on 16 simulations.
7.2
Two-Agent Scenario
In this scenario, another agent is added to the scenario of Section 3.5, resulting in a chain of two agents, as shown in Figure 6.1.
0
900
10
800
20
700
30
600
Average travel time
Reward
First, the untuned baseline DQN agent and the fine-tuned DQN agent are trained with the settings from Table 5 and Table 6 respectively, but as though each was a single agent controlling two intersections. As such, its action space is now the cross-product of the single agent action space with itself. Similarly to the single agent approach, every 10, 000 training steps the greedy policy is evaluated on 16 simulations, and the resulting mean and standard error are plotted. The result can be found in Figure 7.1. As a baseline, the single horizontal line in Figure 7.1b is the average travel time found by the best performing Wiering agent [60]. Since the Wiering algorithm uses a different reward function, it can only be compared on the basis of average travel time.
40 50
500 400
60
300
70
200
80 0.0
0.2
0.4
Time steps
Baseline
0.6
0.8
100 0.0
1.0 1e6
Finetuned
0.2
0.4
Time steps
Baseline
(a) Average reward and standard error.
0.6
0.8
1.0 1e6
Finetuned
(b) Average travel time and standard error.
Figure 7.1: Average reward and travel time of the greedy policy for the baseline DQN agent and the fine-tuned DQN agent. The single horizontal line is the best performing Wiering agent. Although both DQN agents find better policies than the baseline, a quick comparison to Figure 4.1 immediately shows the increased instability of the baseline DQN settings for the two-agent setting compared to the one-agent setting. Simply put, the two-agent scenario is a more difficult problem for a multitude of reasons. For one, the square state matrices now have to represent a rectangular local grid 7 . This results in more compression along the axis where the two intersections are aligned, compared to the axis of a single intersection. In Figure 6.1, for example, the horizontal axis is more compressed. This can lead to misjudgments, since the horizontal axis will appear queued much faster than the vertical axis. Aside from unbalanced compression, the compression itself 7 Using rectangular input layers was not supported in the used library (Lasagne) at the time of experimentation. In future work, this would be preferable
45
is a problem. Along the more compressed axis, the agent now has half the resolution to solve a more difficult problem. Lastly, while selecting the wrong action in the single agent scenario can lead to a queue, this can be resolved relatively easily by opening up the corresponding road. However, in the two agent scenario one action can end up being ‘blocked’, that is, the road between two intersections ends up so queued that vehicles heading in that direction can no longer enter. Moreover, if adding vehicles to the shared road is the right action for the first intersection, this can lead to jams for the second intersection. Thus, the consequences of actions are no longer as straightforward as opening up a road to dissolve a queue. On the other hand, the fine-tuned DQN agent does not suffer from the same instabilities that the baseline DQN agent does. There are some dips in reward, but they are not as low and are resolved more quickly. This may for a large part be the result of using more fine-grained position matrices (recall that the baseline agent uses 84 × 84 matrices, and the fine-tuned agent uses 168 × 168 matrices). Using a fine-grained matrix is more important in the two-agent scenario, since the area the matrix has to represent is larger. This explains why the fine-tuned agent does not suffer from instability as much as the baseline DQN agent does.
7.3
Three-Agent Scenario
The two-agent scenario is used to learn the local joint value function of a scenario with two agents. Once this joint Q-network is trained, it can be used in a multi-agent setting, where each pair of agents uses this Q-function in action selection, as described in Section 6.2. The joint Q-network is used to evaluate the joint action of two agents, a value that is needed in the coordination algorithm. Thus, for this algorithm it is assumed that an agent has full communication/observability of its neighbour’s state and chosen action. For coordination, the max-product algorithm in log space is used, with parameter settings in Table 7. A small, random, perturbation � ∼ N (0, 10−6 ) is added to each Q-value before we perform coordination to prevent numerical underflow.
0
1200
20
1000
40
800
Average travel time
Reward
The results can be found in Figure 7.2. The DQN approach beats the Kuyer approach. Moreover, it is clear that the global reward increases as the two-agent value function is trained, but the instability that was found in Figure 7.1 has not increased. On the contrary, whereas the two-agent evaluations show that reward sometimes dips below random behavior, the three-agent scenario always has a higher reward after training. Similarly to the two-agent scenario, the fine-tuned agent is more stable - less dips in reward - than the baseline agent. However, the policies it finds are not much better than the baseline DQN agent.
60
80
100
120 0.0
600
400
200
0.2
0.4
Time steps
Baseline
0.6
0.8
0 0.0
1.0 1e6
Finetuned
0.2
0.4
Time steps
Baseline
(a) Average reward and standard error.
0.6
0.8
1.0 1e6
Finetuned
(b) Average travel time and standard error.
Figure 7.2: Three agent scenario with baseline DQN settings from Table 5 and fine-tuned DQN settings from Table 6. The single horizontal line is the best performing Kuyer agent.
7.4
Four-Agent Scenario
Similarly to the three-agent scenario, the four-agent scenario uses the learned joint value function from the two-agent scenario in a coordination algorithm. The results can be found in Figure 7.3. Contrary to the threeagent case, the four-agent scenario with the untuned agent sees quite a few places where the global reward for the DQN agent is lower than before training, suggesting that the combination of the two-agent value function heuristic and loopy belief propagation can result in very suboptimal coordinated policies. On the other hand, the fine-tuned agent has one very large dip close to the end, but performs very well otherwise. Moreover, this does not mean that the untuned agent finds no good policy: near the end of the training curve, the reward
46
is higher than -50, which is close to the optimal reward found in the three-agent scenario - a difficult feat to achieve, since there are extra lanes and vehicles in the simulation. Interestingly, the dips in the four-agent untuned training curve (between approximately 400, 000 and 600, 000) do not correspond to the dips in the two-agent untuned training curve (between approximately 600, 000 and 800, 000). Moreover, the average travel time in the four-agent scenario does not improve with training - it gets a lot worse around the reward dip in Figure 7.3a, but does not improve quite as much in other places. However, it is unclear why the travel time seems acceptable at the start, while the average reward is still low. Perhaps the reward function chosen is not a perfect proxy for the average travel time.
0
3000
20
2500
40
2000
Average travel time
Reward
In contrast to the baseline DQN agent, the fine-tuned agent does not exhibit this reward dip at all, and performs quite well overall, finding better policies than both the Kuyer approach and the baseline agent, except for a small dip between 600, 000 and 800, 000 training steps, which correlates with the dip in the two-agent scenario. Of course, if the source problem is not well approximated, the performance for the larger problem is not expected to be as good. Note that in the three-agent scenario, the fine-tuned DQN agent did not find much better policies than the baseline DQN agent. In the four-agent scenario however, it does. This may suggest that in cyclical graphs, where max-plus has no convergence guarantees, using a strong approximator is much more important than for acyclical graphs. However, both the baseline DQN and the fine-tuned agent outperform the Kuyer algorithm most of the time.
60
80
100
120 0.0
1500
1000
500
0.2
0.4
Time steps
Baseline
0.6
0.8
0 0.0
1.0 1e6
Finetuned
0.2
0.4
Time steps
Baseline
(a) Average reward and standard error.
0.6
0.8
1.0 1e6
Finetuned
(b) Average travel time and standard error.
Figure 7.3: Four agent scenario with baseline DQN settings from Table 5 and fine-tuned DQN settings from Table 6. The single horizontal line is the best performing Kuyer agent.
47
8
Related work
This section details earlier research related to deep reinforcement learning and coordination, or reinforcement learning and traffic light control.
8.1
Deep Reinforcement Learning and Coordination
Recent work [10] proposes using deep reinforcement learning to train agents to communicate in order to cooperate. Specifically, they attempt to learn communication protocols. They use deep recurrent Q-learning, but turn off experience replay, since multiple agents learning in tandem constitute a non-stationary environment, in which case experience replay can be detrimental, as noted in earlier work [26]. Moreover, they do not learn communication actions and regular actions together, but as two separate networks to save computation time. Furthermore, while they use decentralized execution (i.e. decisions are made on the local level, per agent), they employ centralized learning, where during training agents can freely communicate. This means that the approach is only useful when training and testing happen in decidedly different environments. Other work [48] uses deep Q-learning to learn independent Q-functions for two agents in the game of Pong. By manipulating the reward function, competitive Pong (beating the other agent), cooperative Pong (keeping the ball in the game) and versions of the game that fall between these two extremes are compared. They do not mention turning off experience replay due to the non-stationarity of the environment, indicating that this was not a problem for either the cooperative nor the competitive scenario.
8.2
Traffic Light Control
Earlier work on traffic light control by Wiering [60] uses a very different reward function definition than the DQN approach, based on vehicle movement. That is, the reward for a traffic light agent is the sum over rewards per vehicle on the agent’s controlled lanes. The reward on time step t for a vehicle v on position pvt is ( 0 if pvt 6= pvt−1 r(v) = (52) −1 otherwise The reward function is decomposed in this way to allow a tabular representation to be used, without iterating over all possible configurations of vehicles on lanes - which is an enormous state space. While the DQN approach solves this by using a convolutional neural network on the matrix of vehicle representations, their algorithm solves it by decomposing the space of all possible vehicle matrices into a linear combination of vehicle states. Moreover, Wiering’s approach is model-based, meaning that it builds a model of the environment and uses that model to approximate the Q-value of an s, a-pair. The baseline algorithm used in the multi-agent experiments is work by Kuyer [24], based on Wiering’s vehicledecomposition approach, and combines it with max-plus coordination. Their approximation of the joint local Q-function between agents i and j is Qij (s, ai , aj ) = Qi (s, ai , aj ) + Qj (s, aj , ai )
(53)
where ai and aj correspond to the actions of agent i and j respectively. That is, both i and j have a Q-function that is based on the joint action of i and j. Thus, in this algorithm, the reward is defined as the negative of the number of halted cars on the agents’ controlled lanes. The Q-value is updated per vehicle, based on the vehicle’s possible next locations. However, this reward function does not take into account e.g. the fact that constantly stopping and starting vehicles, or having each vehicle drive extremely slowly, results in high reward, without necessarily leading to optimal traffic throughput. Moreover, in e.g. SUMO, computing possible next locations per vehicle is expensive, due to needing many calls to the simulator per vehicle, e.g. to retrieve the vehicle’s current position and car speed. Similarly to the DQN approach, the Kuyer algorithm computes joint local Q-value functions and uses them in coordination. For more details on these algorithms, see [60] and [24]. Recent work [17] extends the Wiering approach to a Bayesian multi-objective setting. Other work related to coordinated traffic light control [28] uses max-plus to suggest actions, which are then included as a part of the Q-function of the individual agent. That is, whereas the approach in this thesis uses Q-learning to learn factors to use in max-plus, they propose using the actions suggested by max-plus to add value to the Q-values of those actions. In other work [9], agents learn their own Q-functions and an estimation of the Q-functions of neighbours, to prevent the need for coordination algorithms. However, neither demonstrate improving upon the Kuyer algorithm. Thus, the baseline used is a current state of the art algorithm for reinforcement learning for traffic light control, which is beaten by the DQN approach (see Section 7). 48
9
Discussion
While applying deep Q-learning to traffic control may seem quite straightforward due to great successes in earlier research [31, 43], this turns out not to be the case for multiple reasons. For one, in traffic, an agent suffers the consequences of taking suboptimal actions for a long time, since jams can make it near-impossible for the agent to return to an optimal state, especially in scenarios with multiple junctions. Compare this to games such as Pong or Breakout, two of the Atari games used in earlier research [31, 55, 42], where one missed ball results in a reward of -1 and a fresh start - one mis-step is not as detrimental for Atari games such as Pong or Breakout as it can be for traffic light control. Moreover, traffic agents suffer a lot from missing information: if the matrix resolution is too low, some vehicles are not represented in the matrix due to being overwritten by traffic light setting. Missing a vehicle can result in keeping the vehicle stuck there forever, as the agent prioritizes other roads first, or, not having seen the vehicle, never turns the light to green on the vehicle’s road. However, the agent had no problem taking appropriate actions as long as the queue of vehicles was long enough for the network filters to pick up on. Thus, care needs to be taken to select a matrix resolution where each vehicle is represented by at least one entry, and there is sufficient space between vehicles waiting before a red light and traffic lights such that one does not occlude the other in the state representation. However, despite these issues, the DQN approach found better policies than the best performing baseline agent. In the multi-agent case, manual inspection shows a nice flow where the agent allows a queue of vehicles to come through, switching to a red light in time for the vehicles to stop. In the three-agent chain, this results in the left and right agent sending cars to the middle agent to arrive just as the middle agent’s vertical road empties out and it switches lanes. The four-agent scenario is solved similarly, though, due to the cyclical structure of this scenario, the actions taken are not always optimal8 . Even though the DQN approach can be improved in many ways, it outperforms the baseline of the Wiering/Kuyer algorithm (evaluated at the best version during training time). More importantly, the fine-tuned DQN agent found much stronger policies for the four-agent case than the baseline DQN agent, whereas in the three-agent scenario this was not the case. This suggests that using a good Q-function approximation is much more important in cyclical graphs - for which max-plus is not guaranteed to find a good solution - than for acyclical graphs, which do have these guarantees. While good policies were found by almost any combination of parameter settings for DQN, and they outperformed the baselines, stability issues were encountered during training: the height of the reward oscillated. This may be related to catastrophic forgetting [27], a phenomenon where information stored in a neural network is lost when it is overwritten by new training samples. Different parameter settings and algorithm modifications were tested in order to alleviate this problem. Prioritized experience replay helps alleviate stability issues to a certain degree, especially when balancing purely greedy sampling with uniform sampling, such that knowledge of high information transitions is exploited, while preventing catastrophic forgetting by also sampling ‘average’ transitions. By sampling both types of experience, the Q-function is never moved too far away from being a good approximator for ‘normal’ experiences. Another possible solution to the problem of oscillations caused by this phenomenon may be clipping of the reward signal and TD-error, which was used in earlier research [31, 41]. By clipping these signals, the gradients cannot grow indefinitely large. This is left to future work. Another option is to use dropout [44], where during training time units in the neural network are turned off with probability p. By randomly turning off units during training time, decisions made by the agent cannot become too dependent on dependencies between specific units, and the network is forced to generalize more. Earlier work [11] finds that dropout alleviates the problem of catastrophic forgetting. Despite these problems with oscillating training curves, divergence was not a problem except in the case of combining the DQN algorithm with batch normalization [14]. While batch normalization is now standard practice for many deep learning applications, earlier research has also found it to cause divergence when applied to deep reinforcement learning [40]. They hypothesize that batch normalization’s noisy estimates of population statistics destabilize learning in deep reinforcement learning. Another factor in this destabilization could be the fact that the underlying data distribution is non-stationary in DQN, whereas in the deep learning areas where batch normalization has been successful, the data distribution can be assumed to be stationary (i.e. machine learning problems with static data sets). In DQN, as the agent learns, the distribution over transitions s, a, r, s0 it encounters also changes. As a result, the data distribution changes during training, and a mini-batch sampled from experience replay contains data points that have been sampled from different data distributions. 8 For
videos of behavior found, see http://bit.ly/DQN_traffic
49
That means that the mini-batch statistics are an estimation over a very different distribution than the actual current data distribution, and this changes continuously. As a consequence, the learned batch normalization parameters β and γ may not be stable either, which may further contribute to destabilizing the learning process. Finally, the DDQN algorithm was stable during training time (no oscillations in the temporal-difference error), but performed abysmally during testing time. This is very unexpected, and may have been caused by a software bug. However, running the regular DQN algorithm with a standard SGD optimizer shows a similar issue: it seems stable during training time, but performs terribly during testing. When inspecting the Q-values learned by the DDQN algorithm and the DQN algorithm with the SGD optimizer, they were very similar between actions, and often independent of the state. One possible explanation for the discrepancy between training and testing is that, during training, the Q-values still change, and thus, so does the greedy action to take. During testing however, the Q-values no longer change and as such a bad Q-function maps every state to the same action. This may suggest that the algorithm gets stuck in some local minimum, which is not apparent during training, but leads to failure during testing. This should be tested by monitoring action values and states during training, and seeing if they indeed switch back and forth, and are unrelated to the state. Moreover, while SGD is known to get stuck in local minima, for DDQN this may be caused by its tendency to underestimate action values, which is beneficial in some cases, but on the other hand, so is the original Q-learning’s overestimation in some cases [54]. Generally, the DQN algorithm is able to find very good policies, outperforms the baselines and is usable in a multi-agent setting using transfer planning. However, its stability is sensitive to a lot of factors, and care needs to be taken to find a good state representation. Moreover, using prioritized experience replay is recommended, as it is able to alleviate some of the problems encountered in training the DQN algorithm.
50
10
Conclusion
This thesis presented the application of deep reinforcement learning to the problem of controlling traffic light intersections and coordinating between traffic light agents. Q1 asks ‘Can a deep reinforcement learning agent learn to manage traffic based only on top-down images of traffic situations? Moreover, how do different hyperparameter settings - such as the network architecture, or the database size - influence the algorithm’s behavior on the traffic light control problem? ’ - in both the single and the coordinating traffic lights scenarios, deep reinforcement learning using position matrices as state representations found good policies, but lacked stability. The stability was somewhat improved by adding more information to the state (such as using larger position matrices or a larger number of position matrices), by using a larger experience replay memory and by using a lower learning rate. On the other hand, neither smaller nor larger freeze intervals stabilized learning, and including information on vehicle speeds resulted in less stability. To answer Q2 , ‘How can a reward function for traffic control be shaped, such that the resulting reinforcement learning agent minimizes traffic jams, delay and unsafe situations? ’, a reward function was used that combines vehicle delay, vehicle waiting time, vehicle ‘teleports’ (jams and collisions) and emergency stops and light switches, each with an experimentally chosen weight. This function proved to be a good proxy for minimizing average vehicle travel time in general, with some exceptions where the average travel time and reward were both low. Q3 - ‘How does the use of modifications such as prioritized experience replay and double Q-learning compare to the use of the unmodified deep reinforcement learning algorithm? ’ - was answered by testing both prioritized experience replay with different temperature settings, and double Q-learning. When using a temperature for prioritized experience replay that balances greedy and uniform sampling, learning was most stable. On the other hand, double Q-learning was very stable during training, but performed very badly during testing. Finally, Q4, ‘Can deep reinforcement learning policies be used in cooperation in traffic control, and more importantly, can the resulting algorithm outperform more traditional approaches to using reinforcement learning in traffic light control? ’ can be answered positively: using transfer planning, deep reinforcement learning was used in combination with max-plus, resulting in an approach to coordination in traffic light control that outperforms earlier work. Traffic light control presents unique challenges not necessarily present in the benchmarks used in earlier work. Moreover, deep reinforcement learning for traffic light control suffers from stability issues. However, in principle the approach of using deep reinforcement learning for learning source problems in transfer planning is promising, and there are many directions for future research that can make this approach more reliable, both in general and for the specific problem of traffic light control. In conclusion, deep reinforcement learning is promising for use in multi-agent coordination, and with the use of a transfer planning approach avoids issues with simultaneous multi-agent reinforcement learning. Avenues for further research are presented below.
10.1
Future work
Deep reinforcement learning has recently met with a lot of success, but is still a newly developing field. As such, there are many open venues for research, some specifically suitable to the problems tackled in this thesis, others useful to deep reinforcement learning in general. Spatially Sparse Convolutional Networks Spatially-sparse Convolutional Networks [12] are especially applicable to the problem presented here. Since most of the state matrix is not a road, and as a result will not contain vehicles and always be zero, the position matrices used are very sparse. Using an approach that exploits the sparseness of these matrices can potentially greatly reduce computation times. Dropout The problem of catastrophic forgetting may be caused by the neural network learning to depend too much on dependencies between specific network units. In dropout, units are turned off with probability p during each training step, forcing the network not to depend on these dependencies too much. Using dropout is reported to alleviate the problem of catastrophic forgetting [11]. By reducing dependencies between neural network units, the network becomes a better generalizer.
51
Experience Replay Database Composition Earlier work [7] found an increase in stability when reserving part of the experience replay database for very early experience only. While there is no guarantee that earlier experience is still relevant later - since the underlying data distribution changes during learning - it might be a promising direction for future research. Experience Replay Sampling In this thesis, uniform sampling was compared with rank-based prioritized experience sampling [41]. However, it was not compared to proportional prioritized sampling, which outperformed rank-based sampling in some cases [42]. Consistent Bellman Operator Recent work [1] investigates the use of so-called consistent Bellman operators in deep reinforcement learning. These new operators increase the gap between the optimal and second-best action, and the authors show empirically that this increases convergence speed and outperforms the regular Bellman operator when used in the DQN algorithm and applied to the Atari benchmark. Multi-Objective Reward Function In the current approach, the reward function is a weighted sum of five different objectives, where the weights are set empirically. However, the area of multi-objective reinforcement learning deals with finding these weights in a more controlled manner. Employing multi-objective reinforcement learning for problems such as these, where the reward is a combination of multiple objectives, may prove more effective. Combining multi-objective reinforcement learning with DQN is especially interesting since, to the best of my knowledge, deep reinforcement learning has not yet been applied to the multi-objective case. Pre-training The current DQN algorithm trains the convolutional layers of the network from scratch. However, since the filters that are being learned are related to recognizing jams (which appear in position matrices as edges), perhaps training could be greatly sped up by pre-training the convolutional layer by initializing them with the weights of the lower layers of existing image recognition networks (e.g. convolutional networks trained on Imagenet). Another option is to initialize using the weights of a convolutional auto-encoder, trained to reconstruct traffic situations. Weight Normalization Experiments presented in this thesis showed that the use of batch normalization destabilizes learning for deep reinforcement learning, a finding that was also reported in earlier work [40], which hypothesizes that by using mini-batch statistics to estimate population statistics, noise is introduced that destabilizes learning. The same work also introduces weight normalization, an alternative to batch normalization where the weight vector of network units are decoupled into a direction vector ~v and a scalar parameter g, which supposedly speeds up convergence without relying on computationally costly and noisy mini-batch statistics. As future work it might prove useful to do a qualitative comparison of both methods in deep reinforcement learning. Curriculum Learning In curriculum learning [3], rather than immediately training a machine learning model on difficult problem instances, the model is trained by slowly increasing the difficulty of the problem. In the traffic light control setting, that means that training starts on intersections with little traffic and the demand is slowly increased. This is useful for traffic light control, since when training starts from high demand intersections, jams arise quickly and are hard to resolve. If the agent has already learned the structure of an easier problem, it may be able to handle these more difficult problems much better. Deep Multi-Agent Reinforcement Learning The current approach to the coordination problem in traffic light control was to employ transfer planning: learning the joint local value function for a small source problem, and re-using this to compute an optimal joint action using a coordination algorithm. The catastrophic forgetting experienced when using deep Q-learning was detrimental to the stationary single-agent learning, due to the agent not being able to retain older knowledge. On the other hand, it may turn out to be less of a problem when using DQN to learn the non-stationary environment of multi-agent reinforcement learning, as older knowledge may cease to be useful in that scenario. Demand Data Generation The way the traffic demand data is generated in the current approach is very simple and follows a uniform distribution. However, in reality, traffic demand is higher around rush hours and lower at other times, and different lanes may have different demand distribution. A suitable approach to modeling the demand data could be to learn distributions per lane from real world data.
52
Longer Training Times In some experiments (for example, those with speed and acceleration data added to the state representation), the suboptimal behavior of the agent may have been caused by limited training periods. Perhaps some results would change significantly if these algorithms had had more extensive training times. Reward/TD-error Clipping Earlier work [31, 41] clips the reward and temporal-difference error to fall between -1 and 1. By clipping these signals, the gradients cannot grow indefinitely large, which is reported to help with stability. Clipping these values may help stabilize the training process for traffic light control too. Investigation of DDQN and SGD The DDQN agent and SGD agent performed badly, which may have been caused by Q-values changing during training, but their value being unrelated to the state, i.e. a bad approximator is learned, but this cannot be seen during training time. This hypothesis should be tested by inspecting the training process, and seeing if this is indeed the case.
53
References [1] Marc G Bellemare, Georg Ostrovski, Arthur Guez, Philip S Thomas, and R´emi Munos. Increasing the action gap: New operators for reinforcement learning. arXiv preprint arXiv:1512.04860, 2015. [2] Richard Bellman. Dynamic programming. Princeton University Press, 1957. [3] Yoshua Bengio, J´erˆ ome Louradour, Ronan Collobert, and Jason Weston. Curriculum learning. In Proceedings of the 26th annual international conference on machine learning, pages 41–48. ACM, 2009. [4] Christopher M. Bishop. Pattern Recognition and Machine Learning (Information Science and Statistics). Springer-Verlag New York, Inc., Secaucus, NJ, USA, 2006. [5] Lucian Busoniu, Robert Babuska, and Bart De Schutter. A comprehensive survey of multiagent reinforcement learning. IEEE Transactions on Systems, Man, And Cybernetics-Part C: Applications and Reviews, 38 (2), 2008, 2008. [6] Commission of the European communities. White paper-European transport policy for 2010: time to decide. Office for Official Publications of the European Communities, 2001. [7] Tim de Bruin, Jens Kober, Karl Tuyls, and Robert Babuˇska. The importance of experience replay database composition in deep reinforcement learning. In Deep Reinforcement Learning Workshop, NIPS, 2015. [8] John Duchi, Elad Hazan, and Yoram Singer. Adaptive subgradient methods for online learning and stochastic optimization. Journal of Machine Learning Research, 12(Jul):2121–2159, 2011. [9] Samah El-Tantawy, Baher Abdulhai, and Hossam Abdelgawad. Multiagent reinforcement learning for integrated network of adaptive traffic signal controllers (marlin-atsc): methodology and large-scale application on downtown toronto. IEEE Transactions on Intelligent Transportation Systems, 14(3):1140–1150, 2013. [10] Jakob N Foerster, Yannis M Assael, Nando de Freitas, and Shimon Whiteson. Learning to communicate with deep multi-agent reinforcement learning. arXiv preprint arXiv:1605.06676, 2016. [11] Ian J Goodfellow, Mehdi Mirza, Da Xiao, Aaron Courville, and Yoshua Bengio. An empirical investigation of catastrophic forgetting in gradient-based neural networks. arXiv preprint arXiv:1312.6211, 2013. [12] Benjamin Graham. Spatially-sparse convolutional neural networks. arXiv preprint arXiv:1409.6070, 2014. [13] Carlos Guestrin, Michail Lagoudakis, and Ronald Parr. Coordinated reinforcement learning. In ICML, volume 2, pages 227–234, 2002. [14] Sergey Ioffe and Christian Szegedy. Batch normalization: Accelerating deep network training by reducing internal covariate shift. arXiv preprint arXiv:1502.03167, 2015. [15] Leslie Pack Kaelbling, Michael L Littman, and Anthony R Cassandra. Planning and acting in partially observable stochastic domains. Artificial intelligence, 101(1):99–134, 1998. [16] Venkatesan Kanagaraj, Gowri Asaithambi, CH Naveen Kumar, Karthik K Srinivasan, and R Sivanandan. Evaluation of different vehicle following models under mixed traffic conditions. Procedia-Social and Behavioral Sciences, 104:390–401, 2013. [17] Mohamed A Khamis and Walid Gomaa. Adaptive multi-objective reinforcement learning with hybrid exploration for traffic signal control based on cooperative multi-agent framework. Engineering Applications of Artificial Intelligence, 29:134–151, 2014. [18] Diederik Kingma and Jimmy Ba. arXiv:1412.6980, 2014.
Adam: A method for stochastic optimization.
arXiv preprint
[19] Jelle R Kok and Nikos Vlassis. Using the max-plus algorithm for multiagent decision making in coordination graphs. In Robot Soccer World Cup, pages 1–12. Springer, 2005. [20] Jelle R Kok and Nikos Vlassis. Collaborative multiagent reinforcement learning by payoff propagation. Journal of Machine Learning Research, 7(Sep):1789–1828, 2006. [21] Daniel Krajzewicz, Jakob Erdmann, Michael Behrisch, and Laura Bieker. Recent development and applications of sumo–simulation of urban mobility. International Journal On Advances in Systems and Measurements, 5(3&4), 2012.
54
[22] Stefan Krauß. Microscopic modeling of traffic flow: Investigation of collision free vehicle dynamics. PhD thesis, 1998. [23] Alex Krizhevsky, Ilya Sutskever, and Geoffrey E Hinton. Imagenet classification with deep convolutional neural networks. In Advances in neural information processing systems, pages 1097–1105, 2012. [24] Lior Kuyer, Shimon Whiteson, Bram Bakker, and Nikos Vlassis. Multiagent reinforcement learning for urban traffic control using coordination graphs. In Joint European Conference on Machine Learning and Knowledge Discovery in Databases, pages 656–671. Springer, 2008. [25] Yann LeCun, L´eon Bottou, Yoshua Bengio, and Patrick Haffner. Gradient-based learning applied to document recognition. Proceedings of the IEEE, 86(11):2278–2324, 1998. [26] Long-Ji Lin. Self-improving reactive agents based on reinforcement learning, planning and teaching. Machine learning, 8(3-4):293–321, 1992. [27] Michael McCloskey and Neal J Cohen. Catastrophic interference in connectionist networks: The sequential learning problem. Psychology of learning and motivation, 24:109–165, 1989. [28] Juan C Medina and Rahim F Benekohal. Traffic signal control using reinforcement learning and the maxplus algorithm as a coordinating strategy. In 2012 15th International IEEE Conference on Intelligent Transportation Systems, pages 596–601. IEEE, 2012. [29] Francisco S Melo, Sean P Meyn, and M Isabel Ribeiro. An analysis of reinforcement learning with function approximation. In Proceedings of the 25th international conference on Machine learning, pages 664–671. ACM, 2008. [30] Volodymyr Mnih, Koray Kavukcuoglu, David Silver, Alex Graves, Ioannis Antonoglou, Daan Wierstra, and Martin Riedmiller. Playing atari with deep reinforcement learning. arXiv preprint arXiv:1312.5602, 2013. [31] Volodymyr Mnih, Koray Kavukcuoglu, David Silver, Andrei A Rusu, Joel Veness, Marc G Bellemare, Alex Graves, Martin Riedmiller, Andreas K Fidjeland, Georg Ostrovski, et al. Human-level control through deep reinforcement learning. Nature, 518(7540):529–533, 2015. [32] Joris M. Mooij. libDAI: A free and open source C++ library for discrete approximate inference in graphical models. Journal of Machine Learning Research, 11:2169–2173, August 2010. [33] Andrew W Moore and Christopher G Atkeson. Prioritized sweeping: Reinforcement learning with less data and less time. Machine Learning, 13(1):103–130, 1993. [34] Frans A Oliehoek, Shimon Whiteson, and Matthijs TJ Spaan. Approximate solutions for factored DecPOMDPs with many agents. In Proceedings of the 2013 international conference on Autonomous agents and multi-agent systems, pages 563–570. International Foundation for Autonomous Agents and Multiagent Systems, 2013. [35] Anurag Pande and Brian Wolshon. The Institute of Transportation Engineers, Traffic Engineering Handbook. Wiley Online Library, 2016. [36] Theodore J Perkins and Doina Precup. A convergent form of approximate policy iteration. In Advances in neural information processing systems, pages 1595–1602, 2002. [37] Martin Riedmiller. Neural fitted Q iteration–first experiences with a data efficient neural reinforcement learning method. In Machine Learning: ECML 2005, pages 317–328. Springer, 2005. [38] Tobias Rijken. DeepLight: Deep reinforcement learning for signalised traffic control. Master’s thesis, University College London, United Kingdom, 2015. [39] Gavin A Rummery and Mahesan Niranjan. On-line Q-learning using connectionist systems. University of Cambridge, Department of Engineering, 1994. [40] Tim Salimans and Diederik P Kingma. Weight normalization: A simple reparameterization to accelerate training of deep neural networks. arXiv preprint arXiv:1602.07868, 2016. [41] Tom Schaul, John Quan, Ioannis Antonoglou, and David Silver. Prioritized experience replay. arXiv preprint arXiv:1511.05952, 2015.
55
[42] Tom Schaul, John Quan, Ioannis Antonoglou, and David Silver. Prioritized experience replay. ICLR 2016, 2016. [43] David Silver, Aja Huang, Chris J Maddison, Arthur Guez, Laurent Sifre, George Van Den Driessche, Julian Schrittwieser, Ioannis Antonoglou, Veda Panneershelvam, Marc Lanctot, et al. Mastering the game of Go with deep neural networks and tree search. Nature, 529(7587):484–489, 2016. [44] Nitish Srivastava, Geoffrey E Hinton, Alex Krizhevsky, Ilya Sutskever, and Ruslan Salakhutdinov. Dropout: a simple way to prevent neural networks from overfitting. Journal of Machine Learning Research, 15(1):1929–1958, 2014. [45] Ilya Sutskever, James Martens, George E Dahl, and Geoffrey E Hinton. On the importance of initialization and momentum in deep learning. ICML (3), 28:1139–1147, 2013. [46] Ilya Sutskever, Oriol Vinyals, and Quoc V Le. Sequence to sequence learning with neural networks. In Advances in neural information processing systems, pages 3104–3112, 2014. [47] Richard S Sutton and Andrew G Barto. Reinforcement learning: An introduction. MIT press, 1998. [48] Ardi Tampuu, Tambet Matiisen, Dorian Kodelja, Ilya Kuzovkin, Kristjan Korjus, Juhan Aru, Jaan Aru, and Raul Vicente. Multiagent cooperation and competition with deep reinforcement learning. arXiv preprint arXiv:1511.08779, 2015. [49] Matthew E Taylor and Peter Stone. Transfer learning for reinforcement learning domains: A survey. Journal of Machine Learning Research, 10(Jul):1633–1685, 2009. [50] Thomas L Thorpe. Vehicle traffic light control using SARSA. In Online]. Available: citeseer. ist. psu. edu/thorpe97vehicle. html. Citeseer, 1997. [51] Sebastian Thrun and Anton Schwartz. Issues in using function approximation for reinforcement learning. In Proceedings of the 1993 Connectionist Models Summer School Hillsdale, NJ. Lawrence Erlbaum, 1993. [52] Tijmen Tieleman and Geoffrey Hinton. Lecture 6.5-RMSProp: Divide the gradient by a running average of its recent magnitude. COURSERA: Neural Networks for Machine Learning, 4(2), 2012. [53] John N Tsitsiklis and Benjamin Van Roy. An analysis of temporal-difference learning with function approximation. IEEE transactions on automatic control, 42(5):674–690, 1997. [54] Hado van Hasselt. Double Q-learning. In Advances in Neural Information Processing Systems, pages 2613–2621, 2010. [55] Hado van Hasselt, Arthur Guez, and David Silver. Deep reinforcement learning with double Q-learning. CoRR, abs/1509.06461, 2015. [56] K Vinotha. Bellman equation in dynamic programming. [57] Nikos Vlassis. A concise introduction to multiagent systems and distributed artificial intelligence, volume 1. Morgan & Claypool Publishers, 2007. [58] Nikos Vlassis, Reinoud Elhorst, and Jelle R Kok. Anytime algorithms for multiagent decision making using coordination graphs. In Systems, Man and Cybernetics, 2004 IEEE International Conference on, volume 1, pages 953–957. IEEE, 2004. [59] Christopher JCH Watkins and Peter Dayan. Q-learning. Machine learning, 8(3-4):279–292, 1992. [60] Marco Wiering et al. Multi-agent reinforcement learning for traffic light control. In ICML, pages 1151–1158, 2000.
56