Available online at www.sciencedirect.com
ScienceDirect Energy Procedia 81 (2015) 755 – 764
69th Conference of the Italian Thermal Machines Engineering Association, ATI2014
Definition of a CFD Multiphase Simulation Strategy to Allow a First Evaluation of the Cavitation Erosion Risk Inside High-Pressure Injector Federico Brusiania*, Stefania Falfaria, Gian Marco Bianchia a
Department DIN, University of Bologna, Bologna, 40136, Italy
Abstract Diesel engine performance is strictly correlated to the fluid dynamic characteristics of the injection system. Actual Diesel engines employ injector characterized by injection pressure till 200MPa that, associated to micro-orifice design, result in critical flow conditions inside injector holes. One of the most remarkable consequence of the critical flow conditions inside injector holes is the cavitation phenomenon. The cavitation inside the injector tip and holes can be correlated to two main effects. The first one is on the spray shape and on the atomization process. The second one is on the physical erosion generated on the injector internal walls by the vapour bubble collapse. About the cavitation erosion risk, it is necessary to quantitatively predict the cavitation aggressiveness and the most probable location of cavitation erosion: they are complex problems that cannot be solved by the application of experimental techniques. For this reason, the application of fully transient CFD multiphase simulation (i.e. the needle motion is reproduced during the simulation) can be considered as a very useful approach to evaluate the multiphase flow behaviour inside real size injector holes. The present work addresses two main issues: numerical simulation of cavitating flows inside injector holes and an assessment of the cavitation erosion risk in terms of both 3D map and magnitude. All the analysis are performed by adopting a 3D-CFD multiphase simulation strategy validated against experimental data. © 2015 Published by Elsevier Ltd. This is an open access article under the CC BY-NC-ND license
© 2013 The Authors. Published by Elsevier Ltd. (http://creativecommons.org/licenses/by-nc-nd/4.0/). Selection and peer-review under responsibility of ATI NAZIONALE. Peer-review under responsibility of the Scientific Committee of ATI 2014
Keywords: Injection system; Cavitation, Erosion risk;
* Corresponding author. Tel.: +39-051-209.3314; fax: +39-051-209.3313. E-mail address:
[email protected]
1876-6102 © 2015 Published by Elsevier Ltd. This is an open access article under the CC BY-NC-ND license (http://creativecommons.org/licenses/by-nc-nd/4.0/). Peer-review under responsibility of the Scientific Committee of ATI 2014 doi:10.1016/j.egypro.2015.12.081
756
Federico Brusiani et al. / Energy Procedia 81 (2015) 755 – 764
1. Introduction Cavitation is a well-known phenomenon that can affect devices operating with liquids, from very huge turbomachinery compounds to very small components as high pressure automotive fuel injectors. Cavitation occurs when the pressure in a liquid stream drops below a critical value identified with the characteristic fluid vapor pressure at operating temperature. When it happens, the result is the generation of a vapor phase dispersed in the main liquid flow. Despite the study on the cavitation started nearly one hundred years ago [1], today the industrial field attention on this phenomenon is still high because cavitation plays a very severe influence in limiting the machine performance by the generation of loud noise and strong vibrations. In addition to the deleterious effects produced on the machine performance reduction, cavitation can results also in unwanted destructive effects that can range from minor damages after a long period of service to catastrophic failures over a relatively short period of time. Today, the scientific community agreed to associate the cavitation destructive action to two main mechanisms: • Shock waves generated into the liquid flow by the vapor bubble collapse • Generation of high-speed liquid jet (~300-400m/s) producing a pressure liquid hammer on the boundary over a very short period [2] During the last three decades, both these mechanisms have been deeply studied thanks to the development of the so called optic cavitation method [3]. As presented in [4], by this method it is possible to generate single bubble into a liquid with a very high reproducibility in terms of bubble radius and bubble spatial position. In the present paper, the authors focused the attention on the cavitation phenomenon analysis inside nozzles characterized by micro-orifice design. As well reported in many technical papers available in literature, the cavitation inside high pressure injectors holds a very important role on the definition of their overall performance [614]. Experimental evidences showed how one of the main significant problem associated to the presence of a vapor fraction inside injectors is correlated to the physical erosion over the injector internal surfaces. It can be explained by the presence of very high pressure and flow rate gradients that lead to the generation of vapor bubble very close to the injector solid boundary. Starting from these general considerations, the need to predict the cavitation erosion risk associated to a specific injector clearly appears already during its design process in order to avoid unexpected problems about injector life time. Because of the characteristic dimensions associated to the actual micro-orifice injectors, to fulfill this goal the most useful approach is identified in the 3D fully-transient multi-phase numerical simulation approach based on the use of Computational Fluid Dynamic (CFD) tools [5]. In the present work, the authors collect the results obtained by a methodology specifically designed to perform a first evaluation of the cavitation erosion risk over the injector internal surface. The methodology was based on the simulation approach defined and validated by the authors to reproduce the injector internal flow field [15-18] and was applied to a nozzle hole test bench experimentally characterized. 2. Multiphase simulation strategy and cavitation erosion risk evaluation In CFD, the cavitation phenomenon is generally reproduced by adopting the Eulerian approach based on the Rayleigh-Plesset equation [19]. Zwart et al. [20] proposed a new cavitation model where the mass transfer mechanisms due to cavitation appear as source terms in the liquid and vapor continuity equations. The authors focused their attention on the condensation source term Sc [20], which physically represents the vapor mass condensed for the unit of volume in the unit of time. Therefore, an increment of the Sc value can be associated to an increment of the shock wave or pressure liquid hammer intensity produced by the vapor bubble collapse. It means that, as a general rule, the cavitation erosion risk on a physical surface can be considered directly proportional to the Sc value.
757
Federico Brusiani et al. / Energy Procedia 81 (2015) 755 – 764
Starting from this consideration, the authors recognize the possibility to use the Sc term to define a new synthetic parameter useful to provide, in first instance, a global evaluation of the cavitation erosion risk characterizing a specific nozzle geometry. The proposed new parameter was defined as: ܵ ̴ ܣൌ
ሺௌ ሻ௧
(1)
ೞೌ
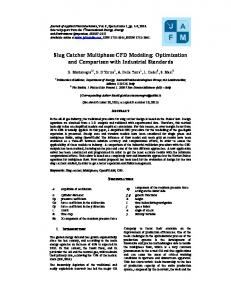
where: • Sc integral was the integral value of the Sc source term calculated over the cell layer adjacent to the hole walls • Acondensation was representing the instantaneous physical area on which vapor condensation took place The Sc_A parameter is synthetizing two information strictly correlated to the cavitation erosion risk: the total vapor mass condensed inside the hole walls (Sc integral) and the area on which the specific vapor mass is condensed (Acondensation). These information considered separately do not allow to characterize the cavitation erosion risk associated to a nozzle. In fact, two nozzles characterized by the same Sc integral value can be subjected to quite different cavitation erosion intensities depending on the surface area value on which the condensation takes place. In general, highest is the value of the Sc_A parameter, highest is the erosion risk. The proposed Sc_A parameter was calculated by using the User Define Function (UDF) facilities of the Fluent v12 code chosen as 3D-CFD multiphase solver [21]. 3. Injector hole test bench and simulation set-up 3.1. Throttle geometry test bench To test the effectiveness of the Sc_A parameter in evaluating the nozzle cavitation erosion risk tendency, the authors considered the experimental injector test-bench presented by Winklhofer et al. [22]. The experiments presented in [22] were performed considering three quasi-2D throttle geometries with the same length/thickness (1000µm/300µ m) and different k-factors (Table 1). The three throttle geometries were identified as “J”, “U”, and “W” (Figure 1). Switching from the “J” configuration to the “W” configuration, the progressive narrowing of the nozzle outlet section produce a reduction of the hole cavitation tendency [17,23]. For the considered throttle configurations, the following experimental data were available: • • •
Mass flow rate versus the inlet/outlet pressure drop Pressure profile along the throttle middle line at choked mass flow rate condition Pictures showing the evolution of the vapor phase inside the throttle versus pressure drop
Only for the “U” configuration, the experimental velocity profiles at 53µ m and 170µm downstream of the throttle entrance were available.
(a)
(b)
Fig. 1. Throttle layouts experimentally evaluated by Winklhofer [22]: “J”, “U”, and “W” configurations.
(c)
758
Federico Brusiani et al. / Energy Procedia 81 (2015) 755 – 764
Table 1. Winklhofer throttle geometric characteristics [22]. Hole layout
J
U
W
Contraction
[%]
0
5
10
Hole inlet width.
[mm]
0.299
0.301
0.301
Hole outlet width.
[mm]
0.299
0.284
0.270
Hole length
[mm]
1.0
1.0
1.0
Inlet radius
[µm]
~20
~20
~20
3.2. Computational domain, numerical setup, and boundary conditions For all the three considered throttle geometries, a fully unstructured hexahedral mesh made by 37000 cell was generated. Particular care was devoted to the mesh structure at hole entrance in order to improve the solution accuracy where the highest fluid dynamic gradients occurred (Figure 2). Charge and discharge plenums were connected to the hole volume. The domain width was equal to 0.3mm. Boundary layer volume
Outlet section
4mm
Inlet section
3mm
3mm 1mm
Hole core volume
Fig. 2. Computational domain and mesh structure adopted close the injector hole entrance.
All the simulations presented in this study were performed by using the Reynolds-averaged Navier-Stokes (RANS) simulation approach [5] based on a first order implicit transient formulation. The time step was equal to 1e6s. The multiphase approach was based on the coupling between the VOF method [5,21] to the Zwart cavitation model [20]. To reproduce the turbulence effects on the mean flow the realizable k-ε turbulence model was considered [5,21] while The flow-wall interaction was managed by the non-equilibrium wall function based on a law of the wall for mean velocity sensitized to pressure gradients [21]. Pressure, momentum, and volume fraction equations were discretized by using a second-order differencing schemes [5]. All the other equations were discretized adopting the first-order Up-Wind scheme [5]. The fluid dynamic performance of all the three injector layouts showed in Figure 2 were evaluated by imposing the operating conditions summarized in Table 2. The increasing pressure drop over the throttle ensured that cavitation would occur for all geometries. The working fluid was represented as a single-component fuel having the same overall physical properties of the ISO-4113 [24] characterized by a saturation pressure equal to 2370Pa at the considered fuel temperature. The fuel temperature variation inside the injector was considered negligible. Therefore, the nozzle flow was simulated as isothermal.
759
Federico Brusiani et al. / Energy Procedia 81 (2015) 755 – 764
The initial values for the turbulent kinetic energy (k) and its dissipation rate () at Inlet/Outlet boundaries were set on the basis of the following equations: ଷ
݇ ൌ ሺܷܫሻଶ
(2)
ଶ
ߝ ൌ ܥఓ ଷȀସ
యȀమ
(3)
The turbulent intensity I was set to 5% while the turbulent integral length scale l was set to the 7% of the inlet/outlet section characteristic length [5]. The authors refer to [16] for a complete description of the simulation methodology validation. Table 2. Throttle operating conditions. Parameter
Quantity
Fuel
[-]
ISO-4113
Fuel temperature
[°C]
30
Injection pressure
[MPa]
10
Outlet pressure
[MPa]
0-4.5
4. Result analysis Before to analyze in detail the cavitation behavior characterizing the “J”, “U”, and “W” throttle configurations, a briefly analysis of their overall fluid dynamic performance is presented. Then, the analysis of the cavitation behavior was divided into two steps: firstly the results obtained for the “U” configuration were presented, secondly the “U” configuration was compared from the cavitation point of view to the other two considered configurations. 4.1. Overall fluid dynamic behavior of the considered throttle layouts Figure 3-a shows the comparison between the experimental mass flow profiles presented in [22] and the corresponding trends obtained by the proposed simulation approach. As shown, the experimental mass flow evolutions versus the pressure drop were well reproduced. Moreover, all the three main effects linked to the increased nozzle contraction (from “J” to “W” layouts) were correctly predicted: • • •
Under non-cavitating conditions, the mass flow rate for a given pressure drop should be reduced The onset of choked flow should be delayed The ultimate choked mass flow rate should not be influenced
Therefore, the adopted simulation strategy allowed to correctly capture the mass flow variation as a function of the throttle contraction area. About the velocity profiles, Figure 3-b shows the comparison between experimental and numerical velocity trends recorded downstream the hole entrance (V1 probe line, Figure 3-b) for two pressure drops: 5.5MPa (noncavitating condition) and 8.5MPa (choked flow). The experimental velocity profiles were characterized by two peaks close to the wall that gradually decreased to a local minimum velocity value at the throttle axis. This shape was due to low vapour density that, by conservation of momentum, led to an increase in the velocity in the near-wall region where the vapour concentration increased significantly. For both non-cavitating and choked flow conditions, the simulations correctly predicted the peak radial positions and the velocity profiles in the throttle central part. About the velocity peak magnitude, it was well predicted only for non-cavitating conditions (5.5MPa). At chocked flow condition (8.5 MPa), the experimental data showed in the shear layer quite high velocity peak magnitudes respecting to the simulation results (Figure 3-b). This may be a consequence of the adopted homogeneous approach
760
Federico Brusiani et al. / Energy Procedia 81 (2015) 755 – 764
that, assuming infinite momentum transfer between phases, did not allow a good reproduction of velocity gradients in the liquid-vapour transition zone (i.e. the zone where the mismatch between experimental and numerical velocity profiles is more evident). 8,5
0,0003
0,00025
Radial Position [m]
Mass Flow Rate [g/s]
7,5
6,5
J_Exp_Mass_Flow J_Sim_Mass_Flow U_Exp_Mass_Flow U_Sim_Mass_Flow W_Exp_Mass_Flow W_Sim_Mass_Flow
5,5
4,5
3,5 6 2 10
0,0002
U_Exp_5.5MPa U_Sim_5.5MPa U_Exp_8.5MPa U_Sim_8.5MPa
0,00015
0,0001
-5
5 10
0 6
3 10
6
4 10
6
5 10
6
6 10
6
7 10
6
8 10
Pressure Difference [Pa]
6
9 10
7
1 10
0
(a)
50
100
150
Axial Velocity [m/s]
200
(b)
Fig. 3. “J”, “U”, and “W” throttle layouts: comparison between experimental and numerical mass flow and velocity profiles.
4.2. “U” throttle configuration: analysis of the cavitation behavior and of the corresponding erosion risk In agreement to the Wiklhofer experimental data [22], the cavitation onset (CS) for the “U” configuration was identified for a pressure drop close to 6MPa (Figure 4-a). Over this value, the cavitation intensity increased progressively till the choked flow condition (CC) reached for a pressure drop close to 7.5MPa (Figure 4-b). Over this pressure drop value, the mass flow became independent from the outlet pressure while the vapour region inside the throttle span toward the hole end (Figure 4-c). Focusing the attention over the pressure drop range bounded between 8MPa to 10MPa, Figure 5-a shows the vapour fraction integral value trends (VOF_Int) calculated inside the boundary layer and the throttle core volumes over the pressure drop. By these trends it was possible to point out two main aspects: • •
The vapour amount inside the boundary layer volume was significantly higher than inside the core volume. It enhanced the erosion risk promoted by the vapour re-condensation over the hole wall The vapour amount over the pressure drop was increasing also after the CC condition. It means that the critical condition identified from the throttle flow field point of view (chocked flow) was not expected to correspond to the erosion risk critical condition.
To evaluate the cavitation erosion risk associated to the vapour distribution synthetized in Figure 5-a, the authors started to evaluate the total vapour mass condensed in the unit of time inside the boundary layer volume. To do that, the condensation source term Sc was integrated over the boundary layer volume obtaining the trend showed in Figure 5-b. The Sc integral value was increased by the reduction of the back pressure pressure till a maximum value was reached at the highest considered pressure drop (10MPa). The grow rate associated to the Sc integral value was progressively reduced over the pressure drop. Matching the data showed in Figures 5-a and 5-b, it was possible to note as the VOF_Int rate and the Sc integral rate were not characterized by the same trend. The VOF_Int rate increased continuously over the pressure drop while the Sc rate decreased progressively over the same pressure range. It meant that, over a specific vapour mass, a further increment of the cavitation intensity (i.e. vapour mass) inside the hole did not result in an increment of the total vapour condensed mass inside the hole volume itself. This behaviour can be explained by the following two remarks: •
Increasing the pressure drop, the vapour mass increment inside the hole volume was mainly due to an
Federico Brusiani et al. / Energy Procedia 81 (2015) 755 – 764
•
extension of the cavitation zone toward the hole exit and not to a vapour concentration increment downstream the hole entrance (Figure 4). Closer was the vapour to the hole exit, lower was the time available for such a vapour fraction to condensate inside the hole volume. The Sc parameter was directly linked to the difference between the vapour pressure and the “local liquid pressure” (¨Pcond) identified as the fluid pressure over the hole axis. Moving from the hole inlet section to the hole outlet section, the ¨Pcond was progressively reduced. Therefore, also the Sc value was reduced accordingly. Figure 6 clearly shows the relation between the ¨Pcond and Sc rates over the hole axis for the 10MPa pressure drop.
The Sc integral trend showed in Figure 5-b was useful to evaluate the total mass condensed inside a volume but not to extract physical information about the effective cavitation erosion risk. In fact, two different throttle layouts characterized by the same total vapour mass condensed on the hole surface can be characterized by a quite different cavitation erosion risk depending on the effective extension of the area on which the condensation takes place. To overcome this problem, the authors defined the Sc_A parameter by which, at each time step, the total vapour condensed mass on the hole physical surface was correlated to the actual condensation area (Eq.1). Figure 7-a shows the trends recorded for the Sc_A parameter and the Sc integral value (evaluated on the hole physical surface) over the simulation period at the highest considered pressure drop (10MPa). As depicted in Figure 7-a, even if the total vapour condensed on the hole surface (Sc integral) considerably changed passing from the first half to the second half of the injection period, the erosion risk evaluated by the Sc_A parameter did not change significantly. It was possible because by the Sc_A parameter the total vapour condensed mass was weighted on the effective condensation area (Acond). No changes in the ratio between Sc integral and Acond were not recorded as a variation in the cavitation erosion risk. Figure 7-b shows the variation of the Sc_A magnitude over the pressure drop. Similarly to the Sc integral trend showed in Figure 5-b, the Sc_A value was increasing over the pressure drop. However, differently from the Sc integral value (Figure 5-b), the Sc_A value increased also between 9.5MPa and 10MPa pressure drop values. Physically it was explained by the reduction of the effective condensation area recorded between 9.5MPa and 10MPa (Figure 7-b).
4.3. “J”, “U”, and “W” throttle configurations: comparison between the corresponding erosion risk On the basis of the analysis performed for the “U” layout about the vapor condensation, it was possible to appreciate how the Sc_A parameter seemed able to well synthetize the vapour condensation phenomena over the pressure drop and over the injection time. Subsequently, the authors verified the capability of the Sc_A parameter to represent the variation of the cavitation erosion risk as a function of the hole layout. As detailed in the introduction, switching from the “J” configuration to the “W” configuration the progressive narrowing of the nozzle outlet was expected to result in a reduction of the cavitation tendency. The evolution over the hole outlet width of the VOF_Int values showed (Figure 8-a) the expected cavitation evolution (pressure drop equal to 10MPa). Differently to the VOF_Int rates, passing from the “J” to the “W” configurations the Sc integral value increased. It was expected because the increased nozzle convergence promoted the re-condensation of the vapour fraction generated at hole entrance (Figure 8-a). By the trends showed in Figure 8-a it was difficult to understand if the cavitation erosion risk was promoted or not by the narrowing of the nozzle outlet section. From one side the reduction of the hole outlet width naturally promoted the reduction of the vapour re-condensation probability because of the reduction of the total vapour generated mass (VOF_Int). On the other side, the hole outlet width reduction promoted the enhancement of the vapour condensation rate over the hole wall. The Sc_A trend showed in Figure 8-b helped to overcome this uncertainty because it was summarizing all the information about vapour concentration, condensation rate, and actual condensation area. By the Sc_A parameter, it was possible to identify the “J” configuration as the most safe layout from the cavitation erosion risk point of view. It was possible because, respecting to the “U” configuration, the reduction recorded about the Sc integral value was higher than the reduction recorded on the effective condensation area. In general, by the Sc_A parameter, the narrowing of the nozzle outlet section was recorded as an aspect enhancing the cavitation erosion risk because the reduction in vapour generation was outclassed by the increment of the condensation rate normalized respecting to the actual condensation area.
761
762
Federico Brusiani et al. / Energy Procedia 81 (2015) 755 – 764
(a)
(b)
(c)
Fig. 4. “U” throttle layout. Vapour distribution on the throttle axial section for three pressure drops: 5.5MPa (a), 7.5MPa (b), 8.5MPa (c). Condensation Rate (Sc) Integral Value [mg/s]
Vapor Fraction Integral Value [mm^3]
0,008 VOF_Int_Boundary Layer
0,007
VOF_Int_Core 0,006 0,005 0,004 0,003 0,002 0,001 0 6 8 10
8,5 10
6
9 10
6
9,5 10
6
Pressure Difference [Pa]
1 10
7
0,009 Sc_Int_Boundary Layer 0,008
0,007
0,006
0,005
0,004 6 8 10
8,5 10
6
9 10
6
9,5 10
6
1 10
7
Pressure Difference [Pa]
(a)
(b)
Fig. 5. “U” throttle layouts. Vapour fraction (a) and Condensation rate (b) trends versus the pressure drop across the hole. Vmag 0-160[m/s]
6
700
7 10
Condensation rate probe line
VOF 0-0.5[-]
Sc 0-680[kg/m^3/s]
6
Condensation Rate
6 10
500
6
400
6
300
5 10 4 10 3 10
6
200
2 10
Axial Pressure
6
1 10
0 0
Vapor condensation
Vapor generation
(a)
600
6
0,0002
0,0004
0,0006
0,0008
Condensation Rate [Kg/m^3/s]
Throttle Axial Pressure Profile [Pa]
Axial pressure probe line
100 0 0,001
Throttle Axial Coordinate [m]
Fig. 6. “U” throttle layout. Relation between the ¨Pcond and Sc rates over the hole axis at 10MPa of pressure drop.
(b)
763
Federico Brusiani et al. / Energy Procedia 81 (2015) 755 – 764
Sc_Integral
1,0e-4
200
5,0e-5
100
0 0
0,0002
0,0004
0,0006
0,0008
Sc_A [(Kg/m^3/s)*(m^2)]
Sc_A [(Kg/m^3/s)*(m^2)]
1,5e-4
300
0,75
0,65
Condensation Area
0,6
300
0,55
Sc_A
0 0,001
250 6 8 10
Injection Time [s]
0,7
350
8,5 10
6
Condensation Area [mm^2]
2,0e-4
Sc_A
Sc_Integral [(kg/m^3/s)*(m^2)]
400
0,8
400
2,5e-4
500
6
9 10
9,5 10
6
0,5 7 1 10
Pressure Difference [Pa]
(a)
(b)
Fig. 7. “U” throttle layout. (a): Sc_A and Sc_Int trends recorded on the hole wall at 10MPa over the injection time. (b) Sc_A and Sc_Int trends recorded on the hole wall at 10MPa over the pressure drop.
Sc_Integral
1,5e-4 VOF_Int_Boundary_Layer
0,004
1,0e-4
VOF_Int_Core 5,0e-5
0 0,27
0,275
0,28
0,285
0,29
Hole Outlet Width [mm]
0,295
Sc_A
(a)
0,6
333,3
300 0,27
0 0,3
0,65
366,7
0,275
0,28
0,285
0,29
Hole Outlet Width [mm]
0,295
Condensation Area [m^2]
2,0e-4
0,008
Condensation Area Sc_A [(kg/m^3/s)*(m^2)]
2,5e-4
Sc_Integral [(kg/m^3/s)*(m^2)]
Vapor Fraction Integral Value [mm^3]
0,7
400
3,0e-4
0,012
0,55 0,3
(b)
Fig. 8. “J”, “U”, and “W” throttle layouts. (a): VOF_Int and Sc_Int trends at 10MPa over the hole outlet width. (b) Sc_A and Acond trends at 10MPa over the hole outlet width.
5. Conclusion The present paper was devoted to verify the possibility to find out information about the cavitation erosion risk characterizing high pressure injector nozzles starting from the condensation rate source term proposed in the Zwart cavitation model. In detail, the authors defined a new parameter named Sc_A by which the total vapor condensed mass was normalized respecting to the actual condensation area at each time step. The proposed simulation methodology was applied to three throttle layouts named “J”, “U”, and “W” characterized by different hole outlet width and therefore by different cavitation tendency. The throttle narrowing increased passing from the “J” configuration to the “W” configuration. All the three throttles were experimentally characterized. About the “U” throttle configuration, by the Sc_A parameter the highest cavitation erosion risk over the hole wall was identified at the highest pressure drop equal to 10MPa. It was not predicted by the trend of the total condensed vapor mass (Sc integral) whose gradient was significantly reduced over the pressure drop. The comparison between the information provided by the Sc_A and Sc integral parameters about the hole erosion risk clearly showed the advantage provided by the correlation between the total vapor condensed mass and the actual condensation area.
764
Federico Brusiani et al. / Energy Procedia 81 (2015) 755 – 764
Applying the Sc_A parameter also to the “J” and “W” throttle configurations, it was possible to appreciate the increment of the erosion risk on the hole surface produced by the hole narrowing. It could be an unexpected result because the reduction of the hole outlet width resulted in a significant reduction of the hole cavitation tendency. However, at the same time, the increment of the cavitation rate produced by the hole narrowing was not compensated by a significant increment of the vapor condensation area. Therefore the vapor condensed mass per unit of hole area was enhanced by the hole outlet width reduction. The “J” layout was recognized as the configuration characterized by the lowest cavitation erosion risk. At this stage of the work the main drawback of the proposed simulation methodology resulted in the impossibility to correlate the Sc_A magnitude to the erosion severity on the hole surface. This lack in the methodology will be fixed by the next step of the work when the Sc_A distribution will be directly correlated to cavitation erosion experimental evidences recorded over the injector internal surfaces. Reference [1] Silberrad, D, Propeller Erosion. Engineering, 33-35, 1912. [2] Vogel, A., Lauterborn, W., and Timm, R., Optical and Acoustic Investigations of the Dynamics of Laser-Produced Cavitation Bubbles Near a Solid Boundary, J. Fluid Mech. 206, 299-338, 1989. [3] Lauterborn, W., Cavitation Bubble Dynamics - New Tools for an Intricate Problem, Appl. Sci.Res. 38, 165-178, 1982. [4] Philipp, A., Lauterborn, W., Cavitation Erosion by Single Laser-Produced Bubbles, Journal of Fluid Mechanics, 361, pp 75-116, 1998. [5] Versteeg, H.K., Malalasekera, W., An Introduction to Computational Fluid Dynamics: The Finite Volume Method (2nd edition), Longman, 2006. [6] Soteriou, C., Andrews, R., and Smith, M. (1995) Direct Injection Diesel Sprays and the Effect of Cavitation and Hydraulic Flip on Atomisation. SAE 950080, pp. 128 – 153. [7] Soteriou, C., Andrews, R., Torres, N., Smith, M and Kunkulagunta, R. (2001) Through the Diesel Nozzle Hole – A journey of Discovery II. ILASS-Europe, Zurich 2-6 September, 2001. [8] Arcoumanis, C., Badami, M., Flora, H. & Gavaises, M. 2000 Cavitation in Real-Size Multi-Hole Diesel Injector Nozzles. SAE Trans. J. Engines 2000-01-1249 109-3. [9] Badock, C., Wirth, R., Fath, A. & Leipertz, A. 1999 Investigation of Cavitation in Real Size Diesel injection Nozzles. Intl J. Heat Fluid Flow 20, 538–544. [10] Chaves, H. & Obermeier, F. 1998 Correlation Between Light Absorption Signals of Cavitating Nozzle Flow Within and Outside of the Hole of a Transparent Diesel Injection Nozzle. Proc. ILASS-EUROPE. Manchester, UK. [11] Chaves, H., Knapp, M., Kubitzek, A. & Obermeier, F. 1995. Experimental Study of Cavitation in the Nozzle Hole of Diesel Injectors Using Transparent Nozzles. SAE Paper 950290. [12] Bianchi G., Falfari S., Brusiani F., Pelloni P. et al., Numerical Investigation of Critical Issues in Multiple-Injection Strategy Operated by a New C.R. Fast-Actuation Solenoid Injector, SAE Technical Paper 2005-01-1236, 2005. [13] Bianchi G., Falfari S., Brusiani F., Pelloni P. et al., Advanced Modelling of a New Diesel Fast Solenoid Injector and Comparison with Experiments, SAE TRANSACTIONS- JOURNAL OF ENGINES. vol. 113, pp. 1 - 14. [14] Bianchi G. M., Falfari S., Brusiani F., Pelloni P., Osbat G., Parotto M., Di Gioia R., The Role of Simulation in the Development of a FastActuation Solenoid C.R. Injector System, ICEF2004-847, ASME Internal Combustion Engine Division: 2004 Fall Technical Conference, Long Beach, California, USA, October 2004. [15] Brusiani F., Bianchi G. M., and Di Gioia R., Experimental Characterization of the Geometrical Shape of ks-hole and Comparison of its Fluid Dynamic Performance Respect to Cylindrical and k-hole Layouts, SAE International Journal of Engines 2013-24-0008, 2013. [16] Brusiani F., Bianchi G.M., Negro S., Comparison of the Homogeneous Relaxation Model and a Rayleigh Plesset Cavitation Model in Predicting the Cavitating Flow Through Various Injector Hole Shapes,SAE Technical Paper 2013-01-1613, 2013. [17] Brusiani, F., Bianchi, G., Falfari, S., Onorati, A. et al., Influence of Cylindrical, k, and ks Diesel Nozzle Shape on the Injector Internal Flow Field and on the Emerging Spray Characteristics, SAE Technical Paper 2014-01-1428, Detroit, Michigan, United States, 2014. [18] Brusiani, F., Falfari, S., Pelloni, P., Influence of the Diesel Injector Hole Geometry on the Flow Conditions Emerging from the Nozzle, Energy Procedia, Volume 45, 2014, Pages 749-758. [19] Brennen, C. E., Cavitation and Bubble Dynamics, Oxford University Press, Oxford, 1995. [20] Zwart, P. J., Gerber, A.G., and Belamri, T., A Two-Phase Model for Predicting Cavitation Dynamics, in Proceedings of the International Conference on Multiphase Flow (ICMF ’04), Yokohama, Japan, 2004. [21] Fluent v12 User Manual, Fluent Inc. [22] Winklhofer, E.,Kull, E., Kelz, E., and Morozov, A., Comprehensive Hydraulic and Flow Field Documentation in Model Throttle Experiments Under Cavitation Conditions, 17th Annual Conference on Liquid Atomization and Spray Systems, Zurich, Switzerland, September 2001. [23] Benajes J , Pastor J.V., Payri R., Plazas,A. H., Analysis of the Influence of Diesel Nozzle Geometry in the Injection Rate Characteristics, J. Fluids Eng 2004; 126:63–71. [24] Mirosław Chorazewski, M., Dergal, F., Sawaya, T., Mokbel, I., Grolier J.P., Jose, J., Thermophysical properties of Normafluid (ISO 4113) over wide pressure and temperature ranges, Fuel Volume 105 2013 440 – 450.