Delegation Diagrams: Visual Support for the Development of Object-Oriented Designs Ewan Tempero Department of Computer Science University of Auckland Private Bag 92019 Auckland New Zealand
[email protected]
James Noble, Robert Biddle School of Mathematical and Computing Sciences Victoria University of Wellington P. O. Box 600 Wellington New Zealand (kjx,robert)@mcs.vuw.ac.nz
Abstract Developers have long used pictures to aid design activities and there has been a lot of interest in standard notations for design. We have developed delegation diagrams, a graphical notation that provides visual support for developing object-oriented designs and that makes the relationship between the requirements and the design explicit. We describe both the notation and tool support, and evaluate delegation diagrams using the cognitive dimensions of notations framework. Keywords: Object-oriented design, visual design, delegation. 1 Introduction Developers have long used pictures to aid design activities and there has been a lot of interest in standard notations for designs. In this paper, we describe the motivation, design rationale, and tool support we have developed for delegation diagrams, a notation that complements existing notations and provides direct support for developing object-oriented designs. Existing design notations such as UML (Object Management Group 2001) focus on design capture, that is, they are intended to describe a design as an independent artifact and in whatever level of detail is considered appropriate. While such capability is clearly necessary to support the software development process, we see two areas where it is not sufficient: helping the decision making process that is inherent in design, and relating the design to the system requirements. In fact, these two areas are not independent. Any decision that affects the design must be made in the context of the requirements. We argue that if the support for the design process makes the relationship between the requirements and design explicit, then the design process can be made more efficient, either by allowing good decisions to be made faster, or by making it easier to evaluate decisions that have been made. We have been developing an object-oriented design technique, which we call Distribution of System Responsibilities (DSR) (Biddle, Noble & Tempero 2002a). This technique essentially forces every design design to be made in the context of the requirements. Our initial discussion of DSR assumed it was very much text-based, since the requirements were text, and the design decisions involved describing classes as sets of text. We developed a Copyright c 2004, Australian Computer Society, Inc. This paper appeared at the 5th Australasian User Interface Conference (AUIC2004), Dunedin, New Zealand. Conferences in Research and Practice in Information Technology, Vol. 28. A. Cockburn, Ed. Reproduction for academic, not-for profit purposes permitted provided this text is included.
tool called Ukase that supported this view of DSR (Biddle, Noble & Tempero 2002d). Its user interface was through a web browser, which provides good support for managing text. However, we quickly found that this was tedious, error-prone, and it was difficult to understand the current state of a design. We found ourselves drawing simple diagrams to show the current design, and so were determined to harness these to support DSR. The formalisation of the diagrams are what we now call delegation diagrams. The user interface to Ukase has been modified to use these diagrams to support DSR. Delegation diagrams differ from UML diagrams in that they show both requirements and design on a single diagram. There are two main concepts shown by delegation diagrams, responsibilities (from DSR) that are related by delegation, hence the name. The information shown on delegation diagrams complements various UML diagrams, in particular class, sequence, and collaboration diagrams. We believe delegation diagrams can significantly support any software development process that uses UML or similar notations. The rest of this paper is organised as follows. In the next section, we discuss the background to this work, in particular we present a brief overview of DSR. In section 3, we present delegation diagrams in detail and in section 4 we demonstrate the prototypical support we have added to Ukase, the tool we are developing to support DSR. Section 5 discusses the rationale and evaluates the effectiveness of delegation diagrams in their current form using the Cognitive Dimensions of Notations evaluation framework (Green 1989), and also discusses related work. Finally, we present our conclusions. 2 Background The DSR technique begins with the requirements, and so there needs to be some way to represent them. We use use cases. 2.1 Use Cases We represent the functional requirements as a particular form of use cases, based on essential use cases (EUCs) (Constantine & Lockwood 1999, Constantine & Lockwood 2001). EUCs were developed for user interface design, but we have been successful in using them for object-oriented design (Biddle et al. 2002a). An EUC is a “stripped-down” version of the more traditional form of use case (Jacobson, Christerson, Jonsson & Overgaard 1992). The term “essential” refers to essential models that “are intended to capture the essence of problems through technology-free, idealised, and abstract descriptions”(Constantine & Lockwood 1999). Essential use cases are documented in a format representing
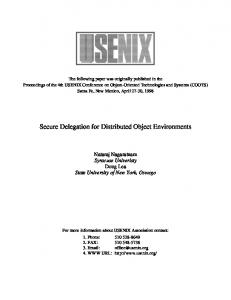
Figure 1: Some of the use cases for Sokoban, as shown by Ukase a dialogue between the user and the system. This resembles a two-column format used by Wirfs-Brock (WirfsBrock 1993). The steps of the essential use case are more abstract, and permit a variety of concrete implementations. It is still easy to follow the dialogue, however, and the essential use case is shorter. The important observation is that the set of system responsibilities from all essential use cases represent the requirements of the system. Figure 1 shows two of the use cases for the game of Sokoban, which involves the player directing a “worker” to push boxes around a warehouse until all boxes are on a shelf. We have used this application for a case study of DSR (Biddle, Noble & Tempero 2002b). 2.2 Distribution of System Responsibilities Distribution of System Responsibilities (DSR) is a technique to develop an object-oriented design from requirements expressed as use cases. DSR assumes the requirements describe a set of responsibilities that the system under development must fulfil. An object-oriented design of a system can also be thought of as sets of responsibilities (each set belonging to a class) collaborating to meet the system responsibilities. This is the view presented by the Class-Responsibility-Collaborator (CRC) design technique (Beck & Cunningham 1989). DSR essentially organises the CRC process to make the decisions made about which responsibilities go in which class explicit. The starting point for DSR is to gather all of the system responsibilities identified in the use cases together and treat them as class responsibilities for a (potentially fairly large!) class. If there were such a class that had such responsibilities, then it would represent an objectoriented design (albeit not a very good one) that satisfied the requirements of the system under development. There would only ever need to be one instance of this “system” class, and so we refer to this design as the system object. The observation on which DSR is based is that, given an object-oriented design (with more than one class), there has to be a relationship between the system responsibilities and the sets of class responsibilities in the design. This means that the design process is about distributing the system responsibilities among the classes. DSR advocates thinking of the design process as making decisions
about how to do the distribution. As well as relationships between the system responsibilities and class relationships, there are also relationships between class responsibilities. In order for one class to discharge one of its responsibilities, it may make a request of, or delegate part of that responsibility to, another class. Establishing that such delegation should take place can also be thought of as distributing responsibilities, and so DSR can be used to refine the design by specifying interclass relationships. DSR is a conceptual model, or frame of reference for thinking about design, or more particularly, the delegation relationships between requirements and design. DSR does not constrain the order of the design process, or restrict the kinds of final designs that are produced. This means DSR can accommodate design decisions that depend on the domain model, software architecture, the use of design patterns, and/or frameworks. Further details are available elsewhere (Biddle et al. 2002a, Biddle et al. 2002b). 3 Delegation Diagrams What we call a “delegation diagram” is really made up of two parts: a notation (the static marks we make on some media) and the environment that allows manipulation of the notation. We describe the notation here, and a prototypical environment in the next section. Delegation diagrams show the relationships between the various form of responsibilities that make up a design. The purpose of a delegation diagram is to help developers understand how the system responsibilities are distributed throughout the design, to help understand consequences of changes to the current distribution, and to help them make decisions about future distributions that may take place. To fulfil these goals, the delegation diagram notation must show both system and class responsibilities, while distinguishing between them. It must allow responsibilities in the same class to be identified, and it must show how responsibilities are distributed. The criteria on which distribution is determined is that of delegation, and the delegation is from one responsibility to one or more other responsibilities, that is, delegation is between responsibilities not classes. It is this relationship that best charac-
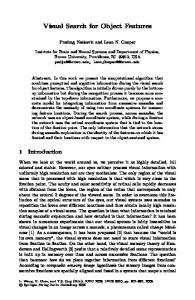
Location objects to create themselves (LOC10), and also to report whether they contain the worker (LOC11) or a shelf (LOC5). In order for a Location object to create itself, it has to ask a Shelf object to create itself (SH3). One can also determine how a class responsibility is met. For example, the responsibility of the Level class “Change location of worker to specified location” (LEV4) is partially met by the Location class responsibilities “Record that now empty” (LOC4) and “Record that now contains worker” (LOC9). There are of course other ways that these responsibilities could be met, which would result in different designs, and hence different delegation diagrams. 4 Tool support for Delegation Diagrams
Figure 2: A manually drawn delegation diagram showing one design for Sokoban terises the decisions that leads to a given design, and it is this relationship that distinguishes the delegation diagram notation from other diagrams and notations. Formally, a delegation diagram is a directed graph where the vertices represent responsibilities and the edges represent the delegation relationship. The vertices are partitioned into disjoint sets, where each set corresponds to the class responsibilities for one class. This is sufficient to meet the requirements described above. System responsibilities are represented by virtue of belonging to the “system object” class. Since no responsibility should delegate to a system responsibility, vertices corresponding to system responsibilities must be sources in the graph, and hence are distinguished. Since the edges have direction, consequences of any decisions made at any point can be computed. In practical terms, a responsibility is drawn as a geometric shape of some colour and has a label. All responsibilities of the same class use the same shape/colour combination. There are no further aspects to the notation, however, we do follow certain conventions. We tend to use the same shape/colour combination for system responsibilities across all diagrams, and we tend to arrange them down the left side of diagrams. We also tend to arrange responsibilities of the same class in a vertical line. The labels are used to distinguish responsibilities to avoid the amount of space that would be required to show the complete text of the responsibility. The convention is to use a common prefix for all responsibilities in the same class. While this is redundant on the actual diagrams, it does help when discussing diagrams, such as in the example below. Figure 2 shows a delegation diagram for one design resulting from using DSR to build the Sokoban system. The triangles on the left hand side are the system responsibilities, GD identify responsibilities for the GameDescription class, LEV for the Level class, LOC for the Location class, SH for the Shelf class, and DIR for the Direction class. One can determine how a particular system responsibility is met by looking at the subgraph associated with that system responsibility. For example, SO8 is the system responsibility “Set the current Level to its initial configuration”. In this particular design, this responsibility is met by asking a Level object to be created (LEV7). The Level class meets this responsibility by asking (several)
We have been building a tool called Ukase to support DSR, and are currently incorporating support for delegation diagrams in it. In this section, we briefly show how Ukase supports delegation diagrams, and discuss future development of this support in the next section on evaluation. Ukase is a web-based application. That is, one uses the tool by using a web browser to go to a URL. The latest version is implemented in Java ServerPages (JSP) (Sun Microsystems, Inc 2003b) using Java Data Objects (Sun Microsystems, Inc 2003a) to provide persistence, with the information stored in a MySQL database (MySQL 2003). It is highly accessible (anywhere on the Internet), and may be used as groupware (multiple people can access a model simultaneously). It is light-weight, that is, requires little effort to learn to use effectively, and imposes few restrictions on how it can be used. Ukase provides tool support for DSR, and so a significant part of its functionality is management of use cases. Some of this functionality has been discussed elsewhere (Biddle, Noble & Tempero 2002c) for an earlier version of Ukase, but we summarise it here. Ukase provides a mechanism for entering the details of the essential use cases, and a mechanism for displaying the results. The input is done using a HTML form laid out the way that a use case would look in a report. Developers will typically use the view shown in Figure 1, and once development is complete, the resulting model is available as a report. Once the use cases have been determined, Ukase allows the user to create the design by specifying how system responsibilities in each use case get delegated to (sets of) responsibilities of classes. As mentioned in the introduction, Ukase originally used a text-based interface to do this. Figure 3 shows an example of the set of responsibilities belonging to a class called “Level”. This view of the design proved difficult to use. Ukase now uses delegation diagrams as the mechanism for describing and showing the design. The diagrams are drawn using a technology we call “clicki” that is based on dynamic image maps (Gordon, Biddle, Noble & Tempero 2003). The user clicks on the image map to indicate the desired action, the JSP server determines what the click means in the current context, regenerates the image based on that meaning, and sends the image back to the browser. The general usage is as follows. For any responsibility, there are four possibilities for the responsibility it should be delegated to: the delegatee is a responsibility that is already visible on the diagram, the delegatee already exists in a class but not currently shown on the diagram, the delegatee is a new responsibility that should be added to an existing class, or a new class must be created which will contain the delegatee. In the first case, the user simply selects to the two responsibilities on the diagram, and Ukase will make the connection. In the remaining cases, Ukase provides an HTML form allowing the class and responsibility to be
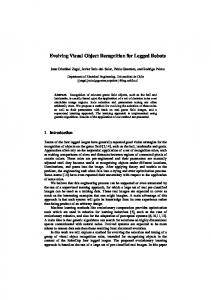
Figure 3: The Level class in a design for Sokoban. specified, and, if necessary, created. The image is then updated as necessary. Figures 4-6 show delegation diagrams managed by Ukase. Note that these and other figures have been cropped from the full Ukase display to save space. Each diagram was produced by making one or more delegation decision based on the previous diagram, so these diagrams represent a sequence of refinements of one design. Figure 4 shows the initial state of any diagram, which is to have just the system responsibilities. The complete diagram for Sokoban has 12 system responsibilities, and the Ukase display has various controls for manipulating the diagram. The rectangles down the left hand side are the system responsibilities from the use cases (see figure 1). The top responsibilities, labelled SO:hof, has been selected. The full text of the current selection is shown at the top of the figure. Figure 5 shows that one new responsibility as been added. That responsibility required specifying the creation of the new class (called HallOfFame in this case). What this diagram shows is that the system responsibility SO:hof–“List all players in the Hall of Fame” has been (partially) delegated to the HallOfFame class responsibility HoF:rd–“Read players’ names from persistent storage”. The result is a design that is a refinement of the original “system object” design. The difference between this design and the original is that now there is a new class, with one method that would be called from the appropriate place in the system object code. Figure 6 shows a series of refinements on the design. In diagram (a), another responsibility has been added to the HallOfFame class that is delegated to from SO:hof. In diagram (b) two new classes have been added, Level (prefix LEV) with two responsibilities and Location (prefix LOC) with one. Diagram (c) introduces no new classes or responsibilities, just the delegation from LEV:done to LOC:cnts. The user specified this by just selecting these two responsibilities in diagram (b). Diagram (d) introduces a new class GameDescription (prefix GD) with a responsibility, and new responsibilities on two other existing classes.
Figure 4: Part of the initial delegation diagram derived from the requirements.
Figure 5: A new class has been created, and two responsibilities added
5 Discussion and Evaluation In this section we evaluate delegation diagrams, discuss our experience with them so far, and compare them to related work. At this early stage of development of delegation diagrams, many of the standard evaluation techniques cannot be applied, however, there is one technique, the Cognitive Dimensions of Notations framework, that is ideally suited to what we need. We first summarise this technique. 5.1 Cognitive Dimensions of Notations The Cognitive Dimensions of Notations (CDs) framework is a discussion tool to help people evaluating notational systems (Green 1989). It provides a vocabulary for analysing the interactions between the structure of information, environments that can manipulate that information, and the types of activities that users want to perform. It is intended to offer a “broad-brush” evaluation, rather than the detailed evaluations offered by many usability evaluation techniques. The vocabulary provided by CDs consists of a set of “dimensions” that each describe a general aspect of an information structure. While any pair of dimensions can be manipulated independently, doing so will typically require allowing other dimensions to change. This illustrates the frequent need to trade-off one aspect of usability with another. The CDs framework currently describes six general categories of user activities, and 13 dimensions. For space reasons, we cannot cover all of these, and so will describe only the most interesting. There are a number of resources on CDs available that will provide more detail (Blackwell 2003).
(a)
(b) 5.2 Application of the CDs Framework The purpose of delegation diagrams is to support the development of designs. This is necessarily an exploratory process, and so, while a number of CDs framework activities apply, it is “exploratory design” that is most important and what we will concentrate on here. The CDs framework describes notational systems as having four components: the notation, the environment for editing the notation, the medium of interaction, and possibly sub-devices. We have described the notation in section 3 and the editing environment and medium of interaction in section 4. It is these that we will evaluate here. We will describe where delegation diagrams are located in the dimensions, and then discuss these findings further below.
(c)
(d) Figure 6: Further refinements of the design
Closeness of mapping This dimension represents how closely related the notation is to what it is meant to describe. In our case, the delegation diagrams notation is meant to represent object-oriented designs. Such designs consists of classes, their interfaces (that is, the methods that can be called on them), and the relationships between classes. Delegation diagrams describe class responsibilities (which would be implemented as methods), and the “delegates” relationship between responsibilities. A relationship that is only shown through the use of conventions, as discussed in section 3, is which responsibilities belong to the same class. This is an important relationship in objectoriented designs, and so the notation should probably provide better support for it. There are also other relationships that are considered important in object-oriented designs that delegation diagrams do not show, such as inheritance or aggregation. Viscosity This dimension represents resistance to change. It is particularly important that notations for ex-
ploratory design have low viscosity, as otherwise the effort involved to make changes would discourage exploration. Ukase currently allows changes to be made at the responsibility level, including moving single vertices and changing their contents. Larger scale change is not supported, although clearly necessary. Also, some form of version control seems necessary to allow easy exploration of design alternatives. Visibility This represents the ability to view components easily. In exploratory design, the design decisions need to be made in the context of what is already there (for example, is a new class needed or not), which requires being able to see all of what is there easily. Ukase does allow the entire design to be shown (in that, the viewport can in theory be made as big as is needed), but ultimately the view is restricted to the size of the browser, and hence the monitor. We anticipate the same problems in scaling up delegation diagrams as with other visual notations, and plan to apply standard focus+context solutions to this problem. There is work currently underway on providing a “thumbnail” view for navigation. Premature commitment This dimension represents the constraints that exist on the order of doing things. In exploratory design, it is very common to want to try different alternatives before committing to one. Like other similar notations, delegation diagrams require commitment to layout. The user has to decide where to place a responsibility when it is created, and, without knowing the future design decisions that may be made, may choose a location that is inappropriate for some reason (such as making the diagram too hard to read). Ukase does not allow responsibilities to be deleted that have existing delegations to other responsibilities. This means that changing delegation from a particular responsibility may require the designer to commit to remove delegations before she knows that is what she wants. Hard Mental Operations This dimension represents how much cognitive effort is required to deal with the notation. Exploratory design already requires significant cognitive effort, and so any extra effort required for the notation will reduce effectiveness. One potential problem is being able to understand exactly who delegates to whom. In a large diagram with lots of crossing lines, this could be difficult to determine. Ukase solves this by providing the ability to highlight related vertices in various ways. For example, figure 7 shows all the class responsibilities that a particular system responsibility delegates to. This shows the “responsibility flow” from the system responsibility through the design. Nevertheless, there is still a concern that large diagrams with lots of crossing lines will be hard to understand. In order to reduce the diffuseness (a dimension that represents the verbosity of the language, and is not discussed here) of the notation, vertices of the delegation diagram graph only show labels rather than the entire text of the responsibility. This makes it harder to understand what the complete relationship is between a responsibility and the set of responsibilities it delegates too. At the moment, Ukase will show the text of any responsibility that is selected, and it is fairly easy to quickly select each relevant vertex in turn. Nevertheless, it does require the designer to have to remember a number of things, and so better support for this activity could be better supported. Options include allowing the full text to be shown on the diagram, perhaps by toggling. 5.3 Discussion We have identified a number of issues relating to delegation diagrams as currently supported by Ukase. The most
Figure 7: Helping to understand the diagram, by highlighting relationships important are those related to changing a design. As noted above, delegation diagrams are intended to support the exploratory process of creating a design, and change is an inherent part of this kind of activity. While Ukase supports changes at the level of responsibilities reasonably well, it provides no support for large-scale changes, such as moving or removing large parts of a design. An important part of the exploration process is understanding the current situation, which requires being able to see large and/or widely separate parts of the design at once. Ukase’s support for this is minimal. Improving both these aspects are the main goal in the future. In other words, we regard increasing visibility and reducing viscosity as being important. The other issues mainly relate to visibility and viscosity as they affect exploration. Premature commitment is mainly an issue because it increases viscosity, while diffuseness affects visibility. As we observed with closeness of mapping, delegation diagrams only show one relationship between classes, namely delegation. However, this relationship may correspond to a number of the traditional class relationships. For example, in figure 6 (d), the relationship between the Level and Location classes is quite likely to be that of composition, whereas that between GameDescription and Level is that GameDescription creates instances of Level, but is otherwise unrelated. At some point in the design process, a decision will need to be made as to how the delegation relationship is represented in the final design. We argue that delaying this decision is better than committing to it too early, and delegation diagrams support this. A similar argument can be made about inheritance. 5.4 Related work UML (Object Management Group 2001) is the predominant design notation for object-oriented designs. As we have noted earlier, its support for the design process is to capture designs rather than help make design decisions. We regard delegation diagrams as complimentary to the UML suite, and so it is worth commenting on the relationships to the UML diagrams. Delegation diagrams can directly derive class diagrams, although the only UML relationship shown will be the unspecific dependency relationship. The delegation relationship can be used to represent “invokes” from the method of one class on a method of another. Thus interaction diagrams can be partially derived, although the ordering relationship is not available. Delegation diagrams are closest in nature to collaboration diagrams in this regard since layout can be used in the same way in both. We have so far resisted increasing complexity of the nota-
tion by requiring (or at least allowing) an ordering of delegation relationships until we have more experience with the notation. The main distinction between collaboration diagrams and delegation diagrams is that delegation diagrams represent “methods” (responsibilities) individually, whereas collaboration diagrams do not. It is this distinction that makes it difficult generally to represent delegation diagrams as an extension to UML, although this is something we will revisit once we have more experience. Delegation diagrams are similar in nature to the collaboration graphs of Responsibility-Driven Design (WirfsBrock, Wilkerson & Wiener 1990). In that work, a collaboration “represents a request from a client to a server in fulfilment of a client responsibility”, which is what we mean by delegation. The difference is that collaboration graphs only show delegation relationships between classes, rather than between responsibilities. Delegation diagrams are very much like call graphs. There are different definitions as to exactly what a call graph is (see, for example, (Murphy, Notkin, Griswold & Lan 1998)), but what distinguishes delegation diagrams from all definitions is that delegation diagrams are only meant as a design tool, and so represent systems at a higher level of abstraction than call graphs operate at. This means that constructs that create problem with call graphs, such as self-calls, recursion (whether direct or indirect), and aliasing, can be ignored. 6 Conclusions and Future Work In this paper, we have described delegation diagrams, a notation and environment that provides visual support for a design style based on distributing responsibilities. Delegation diagrams provide a view of the design that shows the static aspects of a class diagram and the dynamic aspects of a sequence or collaboration diagram. They emphasises the delegates relationship, which we believe is an important heuristic for developing good designs. Delegation diagrams also show both requirements and design together, and so support identifying traceability between the two, as well as ensuring that, whatever state the design is in, it satisfies the requirements. Our main goal in the near future is to do formal evaluations of delegation diagrams to determine how effective they are in supporting the design process. This requires Ukase to have the features discussed in section 5. There is also development of the notation itself to be done. In particular, we want to explore how much the notation should support the conventions discussed in section 3. It is clear from section 5 that “closeness of mapping” could be improved by directly representing which responsibilities belong in the same class. Acknowledgments We thank the anonymous reviewers for their suggestions. References Beck, K. & Cunningham, W. (1989), A laboratory for teaching object-oriented thinking, in ‘Proc. of OOPSLA-89: ACM Conference on Object-Oriented Programming Systems Languages and Applications’, pp. 1–6. Biddle, R., Noble, J. & Tempero, E. (2002a), Essential use cases and responsibility in object-oriented development, in ‘Proceedings of the Twenty-Fifth Australasian Computer Science Conference’. Biddle, R., Noble, J. & Tempero, E. (2002b), Sokoban: a system object case study, in J. Noble & J. Potter, eds, ‘Proceedings of the 40th International Con-
ference on Technology of object-oriented languages and systems’, Vol. 10, Sydney, Australia. Biddle, R., Noble, J. & Tempero, E. (2002c), Supporting reusable use cases, in C. Gacek, ed., ‘Seventh International Conference on Software Reuse (2002)’, Springer, Austin, TX, USA., pp. 210–226. LNCS 2319. Biddle, R., Noble, J. & Tempero, E. (2002d), Tool support for traceability between requirements and design, Technical Report CS-TR-02-7, Victoria University of Wellington. Blackwell, A. (2003), ‘Cognitive dimensions of notations resource site’, http://www.cl.cam.ac.uk/ afb21/CognitiveDimensions/. Constantine, L. L. & Lockwood, L. A. D. (1999), Software for Use: A Practical Guide to the Models and Methods of Usage Centered Design, Addison-Wesley. Constantine, L. L. & Lockwood, L. A. D. (2001), Object Modeling and User Interface Design, AddisonWesley, chapter Structure and Style in Use Cases for User Interface Design. Gordon, D., Biddle, R., Noble, J. & Tempero, E. (2003), Supporting web-based lightweight visual software engineering, in J. Hosking & P. Cox, eds, ‘2003 IEEE Symposium on Human Centric Computing Languages and Environments’, pp. 245–247. Green, T. R. G. (1989), Cognitive dimensions of notations, in A. Sutcliffe & L. Macaulay, eds, ‘People and Computers V’, Cambridge University Press. Jacobson, I., Christerson, M., Jonsson, P. & Overgaard, G. (1992), Object-Oriented Software Engineering, Addison-Wesley. Murphy, G. C., Notkin, D., Griswold, W. G. & Lan, E. S. (1998), ‘An empirical study of static call graph extractors’, ACM Transactions on Software Engineering and Methodology 7(2), 158–191. MySQL (2003), http://www.mysql.com. Object Management Group (2001), ‘Unified Modeling Language (UML) 1.4 specification’. Sun Microsystems, Inc (2003a), ‘Java Data Objects’, http://java.sun.com/products/jdo/. Sun Microsystems, Inc (2003b), ‘JavaServer Pages’, http://java.sun.com/products/jsp/. Wirfs-Brock, R. J. (1993), ‘Designing scenarios: Making the case for a use case framewor’, The Smalltalk Report 3(3). Wirfs-Brock, R., Wilkerson, B. & Wiener, L. (1990), Designing Object Oriented Software, Prentice Hall.