Do UML Object Diagrams Affect Design Comprehensibility? Results from a Family of Four Controlled Experiments Marco Torchianoa , Giuseppe Scanniellob , Filippo Riccac , Gianna Reggioc , Maurizio Leottac a
Politecnico di Torino, Italy,
[email protected] Universit` a della Basilicata, Italy,
[email protected] c Universit` a di Genova, Italy, {filippo.ricca, gianna.reggio, maurizio.leotta}@unige.it b
Abstract Objective: The main objective of this study is to assess whether the use of UML object diagrams improves the comprehensibility of software design when these diagrams are added to UML class diagrams. Method : We have conducted a family of four controlled experiments involving 124 participants. The original experiment and the three replications have been conducted with groups of bachelor and master students. Results: The results of the data analysis suggest that the use of object diagrams does not always introduce significant benefits in terms of design comprehensibility. We found that benefits strongly depend on the experience of participants and their familiarity with UML. Students having more experience and a higher familiarity with UML obtained the highest benefits from object diagrams. On the contrary, less experienced students seemed to be damaged when using these diagrams. For the comprehension effort, the results confirmed the absence of substantial variations in the time needed to comprehend UML models, with or without object diagrams. Implications: Our results suggest that it is important to be aware and take into account experience and UML familiarity before using object diagrams in software modeling. Keywords: Object Diagram, Family of Experiments, Model Comprehension, UML
Preprint submitted to Visual Languages and Computing
July 25, 2014
1. Introduction The software engineering community has developed a number of methods and approaches to model software systems. Most of them use the Unified Modeling Language (UML) [1] as the notation to represent structural and behavioral properties of object-oriented software systems. The class diagram is the main building block and it is used to represent object (or conceptual) models during analysis and design [2]. In the analysis phase, class diagrams are used to model entities (or objects of the problem domain) by reporting for each entity some attributes and operations, and relationships among entities. In the design phase, the classes are elements of the solution domain. At class-level we can think of a software system as made up of classes and their associations. To define the behavior of a software, developers write classes that refer to each other. Though, if we observe the program during its execution (i.e., at run-time) we see it as made up of objects linked to each other and interacting; this is the object perspective. Currently the prevailing perspective in the object-oriented community is the class-based. That is, class diagrams are used more frequently than object diagrams. However, also the object diagrams are recognized useful, especially when added to class diagrams. Object diagrams provide a complete or partial view of the structure of a software system at run-time in a given instant [3]. This is even more useful in the analysis phase, where class diagrams added with object diagrams are used to capture the concepts of the problem domain of a system and to highlight relationships among these concepts [2]. Despite the supposed importance of object diagrams, very few evaluations have been conducted in the literature with the goal of assessing their benefits in the software development life cycle [4]. In this paper, we present the results of a family of four controlled experiments to study whether the use of UML object diagrams improves the comprehension of the design of a software system when these diagrams are added to class diagrams. The context of the original experiment [5] is constituted of a group of 17 master students in Computer Science at the Polytechnic of Turin. The first replication was performed at the same university with 17 bachelor students of a Computer Engineering course. The other two experiments are external replications [6] conducted with a group of 24 master students in Computer Science at the University of Basilicata and a group of 66 bachelor students in Computer Science at the University of Genova. Our study extends [5] and [6]. With respect to these papers, we provide 2
here the following new contributions: 1. Two further replications are presented; 2. The analysis of the individual experiments is presented in unified way. In other words, for each experiment we have adopted the same analysis strategy. Therefore, the data of the experiments already published in [5] and [6] have been reanalyzed; 3. The results of the family are discussed considering two important context factors (IT experience1 and familiarity with UML). 4. A more thorough discussion of the results is reported; 5. The practical implications for the results of our family of experiments are discussed from the practitioner and the researcher perspectives. The paper is organized as follows: we discuss in Section 2 a subset of the related literature concerning experiments aimed at assessing the use of UML in comprehension tasks. In Section 3, we present the goal, the research questions, and the experimental objects of our family of experiments. Then, we provide an overview of the original experiment and describe the design and execution of the three replications. In this section differences among the experiments and analysis method are highlighted as well. We present the family data analysis in Section 4, while we discuss the results of the family of experiments in Section 5. Threats to validity are discussed in Section 6, while remarks and future directions for our research conclude the paper. 2. Related Work Researchers are looking for ways to improve the comprehension of the various artifacts produced in the software development process. In the early 80s, Woodfield et al. [7] analyzed how different types of modularization approaches and the availability of comments affected the comprehension of programs. In the late 90s, Agarwal et al. [8] compared the comprehension of object-oriented models (tending to focus more on structure) with processoriented models (tending to emphasize the behavior). The latter kind of models was found to be easier to understand when dealing with complex tasks, whilst no significant difference was observed on simpler tasks. 1
We use this term since we believe that building IT experience is a long piecemeal process that starts during the university year – if not even earlier – and during such years get systematized.
3
From the early 2000s, several researchers focussed on: (1) analyzing the comprehension of the various UML diagrams (also comparing them with other kind of diagrams), (2) finding ways to improve the comprehensibility of UML diagrams (e.g., adding stereotypes) and, (3) analyzing the usage of UML diagrams to comprehend other artifacts, such as requirements or code [9, 10, 11, 12]. This was mainly due to the diffusion of UML both in the academy and in the software industry. In this section, we discuss the literature concerning empirical studies aimed at assessing the comprehensibility of UML models and the use of UML models to comprehend other artifacts. These studies cover the majority of the UML diagrams: Class diagrams, Use Case diagrams, Sequence diagrams, Statechart diagrams2 , Activity diagrams, Collaboration diagrams3 and Object diagrams. A systematic literature review concerning empirical evaluations on the models and forms used in UML has been conducted by Budgen et al. [4]. Class diagrams. An empirical investigation concerning the comprehensibility of class diagrams is proposed by Yusuf et al. [13]. The authors used eye-tracking equipment to assess participants’ comprehension in the context of software design problems. Results indicate that more experienced participants prefer to use stereotype information, coloring, and layout to promote the exploration and the navigation of class diagrams. De Lucia et al. [14] presented the results of three controlled experiments involving university students having the goal of comparing the comprehensibility of class diagrams and entity relationship diagrams during maintenance tasks on data models. The results demonstrate that UML class diagrams are better in terms of comprehensibility but the support given by the two notations during maintenance activities is identical. Purchase et al. [10] executed an experiment evaluating the comprehension level of five independent “notational variations” for UML class diagrams. These diagrams differed only in the presentation style (e.g., inheritance arcs can be visually presented in overlapped or disjoint way). They found that there is no a best notation; the best performing notation depends on the task for which it is used. Later, the same authors [15] performed a similar experiment but focusing on stylistically different collaboration diagrams. Also in this case the results were inconclusive. However, the participants’ 2 3
In UML 2, they are called State Machine diagrams. In UML 2, they are called Communication diagrams.
4
preferences were always in favor of the more concise variants. A family of controlled experiments to assess the effectiveness of stereotypes in class diagrams to comprehend object-oriented applications in the telecommunication domain is described by Staron et al. [11]. The results suggest that the use of stereotypes significantly helps the participants in improving their comprehension. Similarly, in [16, 17] a family of experiments with bachelor, master, and PhD students is presented to compare the comprehensibility of the Conallen’s UML profile with respect to bare UML for modeling Web applications. Differently to [11], stereotypes seem scarcely useful in understanding. The main finding of that family of experiments is that stereotypes reduce the gap between more experienced and less experienced participants. Use Case diagrams have been empirically investigated by Andrew and Drew [18] with the goal of understanding whether they improve the effectiveness of textual use cases by providing visual clues. The investigation was conducted by providing a group of students only with use cases (control group) or use cases augmented with use case diagrams (treatment group). Results show that students employing both use case diagrams and use cases achieve a significantly higher level of understanding. In another paper [19], the comprehensibility of requirements models expressed in two visual modeling notations, Use Case, which is a scenario-base language, and Tropos, which exploits goal-oriented modeling, is compared. This experimental evaluation has been conducted within a family of controlled experiments involving 79 university students overall. The experimental results showed that Tropos models seem to be more comprehensible, although more time consuming than Use Case models. Sequence diagrams have been considered in several empirical studies. For instance, Xie et al. [20] focussed on sequence diagrams used to model multi-threaded concurrency. In particular, they proposed a variation of this kind of diagram called synchronization adorned UML (saUML) sequence diagram. Xie et al. evaluated saUML sequence diagrams by mean of an empirical experiment. A statistically significant benefit from adopting saUML sequence diagrams was found, thus the authors concluded that this variant of sequence diagrams improves the comprehension of concurrent programs. A family of three experiments, involving undergraduate computer science students, carried out to investigate the influence of using stereotypes in UML sequence diagrams is presented by Cruz-Lemus et al. [21]. In particular, the authors studied the compressibility of UML sequence diagrams with and 5
without stereotypes from three different perspectives: semantic, retention, and transfer. The authors found that the use of stereotypes improves comprehensibility, particularly for participants not familiar with the application domain of the object understudy. Gravino et al. [22] present a controlled experiment executed with bachelor students to assess whether the comprehension of software requirements is influenced by the use of the dynamic models abstracted by employing sequence diagrams is described. The obtained results were inconclusive: the difference in the comprehension of system requirements when using or not dynamic models was not statistically significant. On the contrary, the results of an external replication conducted with more experienced participants (i.e., master students) showed that the use of dynamic models facilitates the interpretation and comprehension of software requirements. The results were confirmed in three subsequent replications conducted in Italy and Spain with professionals and master and Ph.D students [9]. Finally, Glezer et al. [23] compare two types of interaction diagrams (sequence and collaboration) in two application domains: management information systems and real-time systems. Results suggest that collaboration diagrams are easier to comprehend than sequence diagrams in real-time systems, but this is not true in management information systems; in these last systems there is no difference in comprehension of the two diagram types. Statechart diagrams have been extensively empirically investigated, too. For example, Cruz-Lemus et al. [24] studied the impact of composite states (which allow to group related states) on understandability of UML statechart diagrams. They carried out three empirical studies, consisting of five experiments in total using relatively small statechart diagrams as experimental objects while, as participants, they employed undergraduate and graduate students of Computer Science at several universities, along with a number of professionals with an average of two years of experience in UML modeling. The authors stated that the use of composite states improves understandability and efficiency when statechart diagrams are consulted/analyzed. Nevertheless, participants experience with statechart diagrams was considered essential to gain the improved understandability. Activity diagrams have been empirically investigated in the comprehensibility context. For this kind of diagrams, we selected two papers. The first work [25] reports on two controlled experiments aimed at comparing UML activity diagrams and the event-driven process chains (EPCs). The main objective of that comparison concerned the model understandability 6
from the perspective of both requirements engineers and customers. In the case of requirements engineers, better performances have been obtained when participants use activity diagrams. On the other hand, the customers do not get significant differences in terms of business process understandability, when they use both the business process visual notations. The second paper [26] presents the results of two experiments with bachelor and master students. These experiments have been conducted to assess whether the level of formality/precision in business process modeling, based on UML activity diagrams, influences two aspects of comprehensibility: correctness of understanding and task completion time. The considered styles were: a precise style (with specific rules and imposed constraints) and an ultra-light style (no rules, no imposed constraints). The results indicate that: the participants achieved a significantly better comprehension level with the precise style, the used style did not have any significant impact on the effort and more experienced participants benefited more from the precise style than the ultra-light style. Object diagrams and inexperienced students have been considered in the experiment by Thomas et al. [27]. The authors involved a group of first year programming students attempting multiple-choice code tracing questions4 on an object-oriented program. Students were provided (or not) with partially completed object diagrams. The goal of the experiment was testing the experimental group (source code provided with objects diagrams) against the control group (source code provided without objects diagrams). The conjecture is that the students belonging to the experimental group would do better than the control group since they had at least some help. This turned out not to be the case since the results were inconclusive. The results obtained by Thomas et al. [27] reinforce our findings: the use of object diagrams does not always introduce significant benefits in terms of comprehension, but it depends on IT experience and familiarity with UML. In addition, the results of two out of four conducted experiments were consistent with those by Thomas et al. [27]: providing inexperienced students with object diagrams do not improve their understanding. Although this study might be considered similar to that we present in this paper, there are two remarkable differences: type of empirical study (controlled experiment 4
Code tracing questions require students to demonstrate their understanding of code’s execution, or describing what the code does in general.
7
vs. family of experiments involving students with different IT experience and different familiarity levels with UML) and type of comprehension questions (code tracing questions vs. more general questions concerning related class diagram and application domain). 3. The Family of Experiments In this section, we first present the goal of our family of experiments, the research questions, and the used experimental objects. Then, we present an overview of both the original experiment and the three replications. Finally, we summarize the differences among the experiments and the data analysis procedure we adopted to compare the results of the experiments in our family. The original experiment (PoliTo1, from here on) [5] was carried out at the Polytechnic of Turin in 2003. It was first internally replicated in 2004 (PoliTo2, from here on) and later it was externally replicated two times: at the University of Basilicata in 2010 (UniBas, from here on) [6] and at the University of Genova in 2011 (UniGe, from here on). The Polytechnic of Turin and the University of Genova are located in the northern Italy, while the University of Basilicata in the southern. For replication purposes, we made available on the web5 an experimental package and the raw data of all the experiments. To design and execute the experiments, we followed the guidelines proposed in [28, 29]. 3.1. Goal and Research Questions On the basis of the Goal Question Metric (GQM) template [30], the goal of our family of experiments can be defined as follows: Goal: Analyze the use of UML object diagrams with the purpose of assessing whether they improve design comprehensibility of software systems when these diagrams are added to UML class diagrams. The quality focus is to ensure high comprehensibility, taking the perspective of both Researchers, evaluating how effective are object diagrams, and Project managers, evaluating the possibility of adopting object diagrams in their organizations, in the context of students having different IT experience and different familiarity with UML. 5
www2.unibas.it/gscanniello/ObjectDiagrams/
8
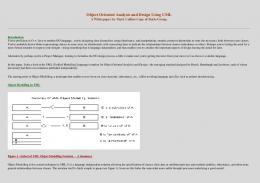
Figure 1: The class and object diagrams of FS.
In our family of experiments, we formulated and investigated the following two research questions: RQ1 Does the effectiveness to comprehend software systems vary when object diagrams are used in conjunction with class diagrams? RQ2 Does the effort6 required to complete a comprehension task vary when object diagrams are used in conjunction with class diagrams? 3.2. Experimental Objects We used the following four experimental objects: FS. The File System Manager handles folders, files, and links. Folders can contain other elements (e.g., files), while links refer to other elements in the file system (e.g., folders). Both the used class diagram (up) and the object diagram (down) are shown in Figure 1; 6
We consider the time as an approximation for effort. This is almost customary in literature (e.g., [12]) and it is compliant with the ISO/IEC 9126 standard, namely effort is the productive time associated with a specific project task.
9
Object FS R T C
Class diagram Classes Relations 4 5 2 2 4 5 5 6
Object diagram Instances Links 8 8 9 8 15 22 6 7
Table 1: Characteristics of experimental objects used in the family of experiments.
R. The Roads system handles maps made up of cities connected by means of roads. Each road starts and ends in a city. Furthermore, a road is characterized by a length; T. Train is a system to manage timetables, trains, and paths; C. The Catalogue system collects category of items (e.g., cars) and items (e.g., car models) based on a set of features (e.g., number of doors). Some details on the experimental objects are shown in Table 1. We used four experimental objects to diversify the application domains so as to reduce external validity threats (see Section 6). To observe a possible contribution of object diagrams, we selected UML class diagrams having a significant structure (i.e., containing classes with several associations). In particular, the class diagram of File System has a tree-like structure that is achieved by means of an indirect self-loop association (i.e., an instance of the design pattern composite [31]). The class diagram of Roads contains two classes and two associations forming a loop that allows representing a graph, while the class diagram of Trains has four classes forming a cycle and an additional self-loop association on class Station. The Trains system presents a type-instance duality: TrainPath and Station describe a “type”, while Train and Passage can be seen as “instances” of this type. Finally, the class diagram of Catalogue contains cycles (but no self-loop association) and presents a type-instance duality. The used models of the experimental objects can be downloaded from the home page of our family of experiments. 3.3. PoliTo1 17 master students carried out PoliTo1 [5]. They were enrolled at the first year of the Master program in Telecommunication Engineering. Some of them were, or had been, industry professionals. The experiment was a 10
Tasks Task 1 Task 2 Task 3 Task 4
Groups Group 0 Group 1 FS+ FSRR+ T+ TCC+
Table 2: PoliTo1 experiment design. Class diagram augmented with object diagram (+), only class diagram (-)
class exercise of a basic course in software development including a quick introduction to UML and object-oriented programming. These students had no previous experience with UML. In their career, they attended only introductory computer science courses. The participants were required to perform some comprehension tasks on the experimental objects alternating the following treatments: − the system is documented using a textual description supplemented by a class diagram only (no object diagram is provided); + the system is documented using a textual description supplemented by both a class diagram and an object diagram. The experiment used a factorial design with two groups, one treatment, and four tasks. Each task was performed on a single experimental object according to the schema shown in Table 2. The participants were randomly assigned to the groups Group 0 and Group 1. The original experiment was designed to answer RQ1 only. For this reason only the comprehension level of the participants was measured. The comprehension achieved by the participants on each experimental object was assessed through a questionnaire. It included four multiple-choice questions with only one correct answer (i.e., closed-ended questions) for each experimental object. Each question could be answered examining the provided UML models (depending on the administered treatment: class diagram augmented with object diagram or class diagram only). That is, we designed the experiment so as to the class diagrams alone were sufficient to answer the questions of the comprehension questionnaire. An example of comprehension question for FS is: “Which object types can belong to a Folder object? ”. To answer this question is sufficient looking at the aggregation present in the class diagram (see on the top of Figure 1) or to consider also the example provided by the object diagram (see on the 11
bottom of Figure 1). The correct answer for this question is composed by the following items: Folder, File, and Link. The comprehension level achieved by a participant has been measured counting the number of correct answers (i.e., score). For each experimental object, the comprehension level achieved by a given participant in the experiment ranges in between 0 (null comprehension) and 4 (perfect comprehension). 3.3.1. Summary of the Results for PoliTo1 Here we give only a summary of the PoliTo1 results. The interested reader can found the complete analysis in [5]. The data analysis was performed considering the experimental objects together and alone. The analysis on each object separately revealed a significant statistical difference in favor of the object diagrams only on FS and T. Given the preliminary nature of PoliTo1, the author accepted 17% of committing Type-I-error instead of 5% [29]. Such an alpha level has been chosen to have the statistical power of the Mann-Whitney test greater than 75%. In all the other experiments of the family, we decided to accept a probability of 5% of committing Type-I-error. The analysis of the magnitude of the observed differences, measured using the Cohen’s “d” standardized difference between two groups [32], revealed that the effect size7 was medium for FS and T and negligible for R and C. A significant positive effect of the object diagrams was observed when considering all the experimental objects together. The effect size was small. 3.4. PoliTo2 The participants in PoliTo2 were 17 bachelor students of a Computer Engineering degree. The experiment was a class exercise of an Object-Oriented Programming course, which included an introduction to UML. Before attending this course, the students had no previous experience with UML. In particular, they had only attended an introductory programming course and an Algorithms and Data Structures course. Therefore, they had a limited familiarity with UML and a limited experience in software development. The results from this experiment have never been published. Also in this case the experiment was designed to answer only RQ1. To reduce the time required to conduct the replication (only one hour and half 7
Typically, the effect size is considered negligible for d < 0.2, small for 0.2 ≤ d < 0.5, medium for 0.5 ≤ d < 0.8, and large for d ≥ 0.8.
12
Task Task 1 Task 2
Group 0 FST+
Groups Group 1 Group 2 FS+ TTFS+
Group 3 T+ FS-
Table 3: PoliTo2 experiment design. Class diagram augmented with object diagram (+), only class diagram (-)
was available in total) and to adapt the experiment to the limited experience of the students, only the experimental objects FS and T were used. We adopted a within-participants counterbalanced design with two tasks and four groups summarized in Table 3. The participants were randomly assigned to the four groups shown in this table. 3.5. UniBas The UniBas replication has been conducted in 2010 with 24 students of the Master program in Computer Science at the University of Basilicata (Italy) [6]. The experiment represented an optional activity of an advanced Software Engineering course. Before the experiment, the students have already passed a basic Software Engineering course where they learned UML. Some of them were, or had been, industry professionals. Thus, we can state that the participants in UniBas had a reasonable level of technical maturity and knowledge of UML, requirements engineering, and object-oriented software development. In this replication, the experimental objects were paired in assignments as follows: A1. the pair of objects FS and T; A2. the pair of objects R and C. We adopted the within-participants counterbalanced design shown in Table 4. This design ensures that each participant work on two tasks (each consisting of an assignment), experimenting alternatively class and object diagrams together (+) or class diagrams alone (-). The participants performed the two tasks without time limit. The participants could have a break between the two tasks. We equally distributed high and low ability participants among the four groups (i.e., Group 0, Group 1, Group 2, and Group 3) [6]. This was possible
13
Task Task 1 Task 2
Group 0 A1+ A2-
Groups Group 1 Group 2 A1A2+ A2+ A1-
Group 3 A2A1+
Table 4: UniBas experiment design. Class diagram augmented with object diagram (+), only class diagram (-)
because the participants were asked to fill out a pre-questionnaire. In particular, we asked the participants their GPA (Grade Point Average) and used this information to assign them to the groups. We equally distributed the participants with a GPA less than or equal to 24 (low ability participants) in the four groups [9]. The scope of UniBas is broader than PoliTo1 (i.e., the original experiment). In fact, we also measured comprehension effort to answer RQ2. Therefore, the considered dependent variables are: comprehension level and comprehension effort. Similarly to PoliTo1, the comprehension level has been assessed by employing a comprehension questionnaire. However, we decided to convert the questions in the comprehension questionnaire in open-ended questions. Therefore, the comprehension level of the participants has been measured using an information retrieval based approach [16]. In particular, the correctness of the provided answers has been measured using the precision measure. On the contrary, for estimating the completeness of the answers, we exploited the recall measure. To get a single value representing a balance between correctness and completeness of the answers, we used the F-measure (i.e., the harmonic mean between precision and recall). A single value for the comprehension level is obtained computing the overall average of the FMeasure values of all the questions. This mean assumes values ranging from 0 to 1. A value close to 0 indicates a null comprehension of the design of the system, whilst a value close to 1 means a complete comprehension. Further details on the dependent variable comprehension level can be found in [6]. The dependent variable comprehension effort measures the time to accomplish a task. The time was expressed in minutes and was directly recorded by the participants by writing down their start and stop times on the comprehension questionnaire. A post-experiment questionnaire was administered at the end of the experiment with the goal of gaining insights about the participants’ behavior during the experiment. That is, we used a qualitative approach to explain 14
the quantitative results from the experiment. To design this questionnaire, we used standard approaches and scales [33]. 3.5.1. Summary of the Results of UniBas Table 5 summarizes the results in terms of comprehension level (both significance and effect size) of UniBas. For comparison purposes, this table also shows the results obtained in the original experiment. The interested reader can found further details in [6]. Object All FS T R C
Significance PoliTo1 UniBas yes yes yes yes yes yes no yes no yes
Effect size PoliTo1 UniBas small large medium large medium large negligible large negligible large
Table 5: Comparison between PoliTo1 and UniBas in terms of comprehension level
Globally, (see row “All”) the results confirm and strengthen the findings of the original experiment, thus increasing our confidence in the benefits deriving from the use of object diagrams. Complementing class diagrams with object diagrams improves comprehension of circa 35%. Regarding the comprehension effort, the experiment did not reveal any significant difference. This result suggests that the provided additional information (i.e., the object diagrams) does not require addition effort to complete a comprehension task. Finally, the analysis of the answers to the post-questionnaires suggests the usefulness of object diagrams. In addition, the participants found object diagrams useful to understand the cardinality of associations. 3.6. UniGe The participants in UniGe were 66 students of the Bachelor program in Computer Science. These students were enrolled in a Software Engineering course of the third year, where they learned UML. As a mandatory activity of this course, students were grouped in teams and allocated on projects to develop a software system using specifications based on UML. As for UniBas, the experiment was conducted as part of laboratory exercises carried out within the course in which the experiment was conducted. The participants had knowledge of object-oriented programming and database systems modeling. To conduct this replication, we used the same design as UniBas. 15
3.7. Differences Among the Experiments in our Family We introduced some differences in the experiments. Some of these differences have been intentionally introduced to improve the material and/or the data analysis, while others were added because of time constraints (e.g., the laboratory was available only for two hours). We summarize the differences as follows: Comprehension questionnaire. Before executing the replications in our family of experiments, we removed some minimal sources of possible confusion found in the experimental material of PoliTo1. Furthermore, in UniBas and UniGe, we modified the questionnaire by turning the closed questions of the original experiment into open ones. The rationale for this modification relies on the fact that open questions should reduce participants guess and hence decrease the possibility to give correct answers by chance. Dependent variables. Apart from comprehension, we added effort as dependent variable in UniBas and UniGe. This variable was added to further investigate the effect of object diagrams in performing comprehension tasks. Experiment design. For PoliTo2, UniBas and UniGe, we used a withinparticipants counterbalanced experimental design. On the contrary, a factorial design with two groups, one treatment, and four objects was used in PoliTo1. We added this modification to better analyze the effect of the main factor (i.e., the presence or the absence of object diagrams to execute a comprehension task) and the co-factors (e.g., task). Other modifications have been introduced as a natural consequence of having used a different design. Another modification has been introduced in UniBas. In particular, a break between the two tasks was provided, thus expecting a lower fatigue effect with respect to the original experiment. As for UniGe, we had time constraints and then the participants did not have a break between the two tasks. Group composition. For UniBas, we used the information from a prequestionnaire to equally distribute high- and low-ability participants among the four groups shown in Table 4. In the original experiment and in the other replications, the participants were randomly assigned to the groups. 16
Number of participants Kind of students Geographic distribution Research questions Comprehension questionnaire Design Tasks Comprehension level
PoliTo1 17
PoliTo2 17
UniBas 24
UniGe 66
Master
Bachelor
Master
Bachelor
Torino
Torino
Potenza
Genova
RQ1 only
RQ1 only
RQ1 and RQ2
RQ1 and RQ2
Closed answers
Closed answers
Open answers
Open answers
Factorial 2
Counterbalanced
Counterbalanced
Counterbalanced
4
2
2
2
Score
Score
F-measure
F-measure
Comprehension effort
No
No
Yes
Yes
Time limit
Yes
Yes
No
Yes
Break between the tasks Group composition Post-experiment questionnaire Participants’ IT experience Familiarity with UML Empirical strategy
No
No
Yes
No
Randomized
Randomized
Blocking factor (Ability)
Randomized
No
Yes
Yes
No
High
Low
High
Low
Low
Low
High
High
Quantitative
Quantitative
Quantitative and Qualitative
Quantitative
Table 6: Key features of the four experiments in our family
Post-experiment survey questionnaire. As for UniBas, a post-experiment questionnaire was employed. Data analysis. Owing to the new dependent variable introduced (i.e., comprehension effort), we considered a new null hypothesis in both UniBas and UniGe. Moreover, in all the replications of our family we accepted the standard probability of 5% of committing Type-I-error instead of 17% as done in the original experiment. Participants’ IT experience. We measured participants’ experience as their level of education, i.e., either bachelor or master. Master students were considered to have high IT experience, while bachelor students low. Familiarity with UML. The familiarity of participants with UML has been measured as high or low. It has been estimated by the teachers on the basis of UML contents provided to the students both in the course where the experiment took place and in previous university courses. To better highlight the differences among the four experiments in the family, we summarize their key features in Table 6. 17
3.8. Family Analysis Procedure Since the four experiments have been conducted in different settings and with different number of tasks, we cannot combine the results and analyze them together. Moreover, the measure to quantify the comprehension level in the two experiments conducted at the Polytechnic of Turin (PoliTo1 and PoliTo2) is different from that used in UniGe and UniBas (score vs. Fmeasure). Since the measure adopted in the latter two experiments is more sophisticated (being based on information retrieval concepts), we devised a transformation of measures that allows for a direct comparison of the results from the different experiments. The idea is to discretize the continuous variable Comprehension level (computed as F-measure in the UniBas and UniGe) into a dichotomous variable indicating whether the answer is correct or not (i.e., analogous to the variable used in PoliTo1 and PoliTo2). The threshold we adopted for such discretization is the most conservative one, i.e., correct ⇔ F-measure = 1. This transformation is similar to what has been used in [34, 35]. After this transformation, in this paper, we report the summary statistics of the four experiments given in terms of the absolute number of correct answers per task (score) with and without object diagrams. Since the distributions of the scores are not normal, we use the median and the median absolute deviation (MAD). We also provide the Mann-Whitney tests, which were consistently applied in all experiments of our family. Since the number of questions per task is different among the four experiments (namely four in PoliTo2 and eight in the others), the score is not a suitable measure for a comparison among the experiments in our family. Therefore, we decided to build, for each experiment, a contingency matrix of the correct/wrong answers vs. the presence/absence of object diagrams. The contingency table allows us to look at the benefits achievable by object diagrams in terms of odds ratio, which is a measure of the effect size that can be used for dichotomous categorical data. An odds ratio indicates the likelihood of the occurrence of an event as opposed to the non occurrence. Odds ratio is defined as the ratio of the odds of an event occurring in one group (e.g., experimental group) to the odds of it occurring in another group (e.g., control group), or to a sample-based estimate of that ratio. If the probabilities of the event in each of the groups are indicated as p (experimental group) and q (control group), then the odds ratio is precisely defined as:
18
OR =
p/(1 − p) q/(1 − q)
An odds ratio of 1 indicates that the condition or event under study is equally likely in both groups. An odds ratio greater than 1 indicates that the condition or event is more likely in the first group. Finally, an odds ratio less than 1 indicates that the condition or event is less likely in the first group. Moreover, on the basis of the contingency tables we apply the Fisher exact test, which is well suited for small samples 2 × 2 tables [36]. The test allows to check for the existence of a significant difference between the two treatments in term of correctness. Since the context of the four experiments is different, we aim at finding how the context factors can influence the benefits achievable with object diagrams. The two context factors considered are the IT Experience and the familiarity with UML. Both are ordinal measures that can assume High and Low as the values, respectively. To identify a possible correlation between the two context factors and the experiment outcome we fit a linear model. Given the nature of the factors and the lack of other empirical evidence, we opted for the simplest model. 4. Family Data Analysis In this section, we present the results of the data analysis according to the defined research questions. 4.1. RQ1 - Comprehension level The summary statistics concerning the score of the four experiments are reported in Table 7. This table reports the median and median absolute deviation (MAD) for both the treatments. Table 7 also reports the MannWhitney p-values computed using the considered dependent variable. We observe a statistical significant difference only in UniBas. Figure 2 shows the boxplots for the scores grouped by treatments and experiments. The number of participants is proportional to the widths of the boxes. The boxes can be compared only pairwise since the experiments differ in both number of tasks and number of questions per task. As mentioned in Section 3.8, we use the odds ratio of a correct answers to make comparable the outcomes of the four experiments. Table 8 reports
19
Table 7: Summary statistics of raw score for the four experiments NO OD OD MW Exp median MAD median MAD p-value PoliTo2 3.00 1.48 3.00 1.48 0.77 UniGe1 5.73 1.58 5.58 0.96 0.77 PoliTo1 3.00 1.48 3.00 1.48 0.09 UniBas1 4.50 1.68 6.50 0.74 < 0.01
8 7
NO_OD OD width ~ # participants
Score
6 5 4 3 2 ●
1 PoliTo1
PoliTo2
UniGe1
UniBas1
Figure 2: Score in the four experiments.
the odds ratio (OR) estimates and 95% confidence interval8 , with the Fisher test p-value. Based on either the odds ratio confidence interval or the Fisher test, we can reject the first hypothesis only for the UniBas experiment with a large effect size (OR=1.76), while we cannot reject it for the other three experiments. The result is consistent with the analysis conducted on the score (see Table 7). A graphical representation of the odds ratios and the relative confidence intervals is shown in Figure 3. Both the estimates and intervals can be directly compared. We can graphically infer the significance of effect observed in the UniBas experiment, and the lack of statistical significance in the other 8
The width of the confidence interval gives us some idea about how uncertain we are about the unknown parameter (in our case odds ratio estimate)
20
in the four experiments Fisher p-value 0.55 0.57 0.28 < 0.01
Estimate 95% CI
2.0
●
● ●
1.0
Odds Ratio
3.0
Table 8: Odds ratio estimate with 95% CI Odds ratio Exp est. 95% CI PoliTo2 0.73 0.31 1.71 UniGe1 1.08 0.84 1.40 PoliTo1 1.39 0.79 2.47 UniBas1 1.76 1.15 2.70
●
0.0
●
Experiment UML knowledge Experience
PoliTo2
UniGe1
PoliTo1
UniBas1
( n= 17 )
( n= 66 )
( n= 17 )
( n= 24 )
Low
High
Low
High
Bachelor
Master
Figure 3: Odds ratio estimate with 95% CI in the four experiments.
experiments (the lower extreme of the CI overcomes the straight line OR=1 only in the UniBas case). The effect of the context factors – IT Experience and UML Familiarity – can be estimated by means of a linear model. Fitting a linear model on the four estimates vs. the IT Experience and UML Familiarity levels yields the following equation: OR = 0.73 + 0.67 · MasterITExperience + 0.36 · HighUMLFamiliarity (1) Where MasterITExperience is 1 for master students and 0 for bachelor students. HighUMLFamiliarity is 1 for participants with a high familiarity with UML and 0 otherwise. All the three coefficients are statistically significant as well as the overall 21
70
NO_OD OD width ~ # participants
60
Time [min]
50 40 30 20 10 NO_OD
OD
NO_OD
UniBas
OD
UniGe
Figure 4: Time to complete the task in UniBas and UniGe.
model (p-value = 0.0111). The goodness of fit is very high (R2 > 99%)9 . 4.2. RQ2 - Comprehension effort As far as effort is concerned, only the experiments UniBas and UniGe collected timing information. The values are summarized in Figure 4. A statistically significant difference was found neither in UniBas (p=0.22) nor in UniGe (p=0.99). 5. Discussion Running a family of experiments rather than an individual experiment provide us with more evidence about external validity – including generalizability – of results [37, 38]. The same hypotheses were tested in three distinct 9
R2 measures how well a regression approximates the real data points; R2 =100% indicates that the regression perfectly fits the data.
22
contexts (University of Torino, University of Genova, and University of Basilicata) employing two different profiles of participants (master and bachelor students) having different familiarity with UML. The first result that emerges from this family of experiments is that the use of object diagrams does not always introduce significant benefits in terms of comprehension of design models. Although the models might appear small, their size has been chosen in accordance to software engineering book recommendations (e.g., [39]). In addition, we chose the diagrams to be realistic for small/medium sized comprehension tasks. Our result partially contrasts a general belief that UML object diagrams are useful to increase the comprehension of class diagrams in the modeling of object-oriented software systems. For example, Fowler wrote: Object diagrams are useful for showing examples of objects connected together. In many situations, you can define a structure precisely with a class diagram, but the structure is still difficult to understand. In these situations, a couple of object diagram examples can make all the difference [3]. We found that the variability of our results strongly depends on two cofactors: IT Experience and UML Familiarity. They play an important role in our family of experiments. Students having a higher IT experience (master) and high UML familiarity obtained clear benefits. On the contrary, less experienced participants (i.e., bachelor students) having low UML familiarity obtained no advantage from the usage of object diagrams (this outcome is consistent with the those obtained by Thomas et al. [27]). This is quantitatively shown by the odds ratio that provides a measure of the effect size. More in detail, master students having high UML familiarity improve their comprehension level of UML models of circa two times (OR=1.76), when object diagrams are provided. The improvement is reduced when the familiarity with UML decreases, OR = 1.39 in the PoliTo1 experiment where the students have a low familiarity with UML, and collapse with less IT experienced students (OR=1.08 in UniGe and OR=0.73 in PoliTo2). The relationship between IT experience and UML familiarity and the magnitude of benefits in terms of comprehension of UML models is highlighted by the linear model (equation 1). From it, we can observe that the coefficient for the IT Experience is roughly two times larger than the one for UML Familiarity, indicating a larger importance of IT experience in determining the magnitude of benefits achievable from the presence of object diagrams. The fact that students having more IT experience and High UML familiarity obtained the highest benefits in the usage of object diagrams is, in some 23
sense, counter-intuitive. Our result contrast the common belief that specific examples (in our case object diagrams) are more useful than generalizations (in our case class diagrams) for novices while examples are less useful for experienced participants. In our family of experiments, we obtained exactly the opposite. This result probably depends on the capability of participants to integrate different sources of knowledge, namely class diagrams and objects diagrams. Some of them are able to quickly find associations between different artifacts and for them object diagrams are useful, while others find this kind of notation more difficult and in this case having or not the objects diagrams does not make difference. We observed a similar phenomenon in [26] where a precise style and an ultra-light style for modeling business processes were compared. Also in that case, more experienced participants (master students) benefited more from the precise style, in which a combination of UML diagrams has been used to model a business process, than less experienced participants. Similarly Abrah˜ao et al. [9] observed that in the case of high ability and more experienced participants the use of sequence diagrams, in combination with other UML notations, improves functional requirements comprehension. As for comprehension effort, the results confirmed the absence of substantial variations in the time needed to perform a comprehension task, whatever is the treatment applied. 5.1. Implications We adopted a perspective-based approach to judge practical implications of our family of experiments from the practitioner/consultant and the researcher perspectives. To this end, we exploited the reading method inspired by perspective-based and checklist-based reviews suggested Kitchenham et al. [40]. The practical implications suggested by our results can be summarized as follows: • The comprehension of the design of a software system improves when class diagrams are augmented with object diagrams only in certain cases. The improvement depends on the IT experience and the familiarity with UML of the participants. This outcome is relevant for practitioners/consultants. They should expect an improvement in comprehension only for young software engineers with a little of IT experience and good familiarity with UML. This outcome is also relevant for
24
the researcher. Understanding the reasons of such result from a cognitive point of view of the participants is a challenge and our results together with previously published results (e.g., [9],[26]) pose the basis for future work in such a direction. • The use of object diagrams could reduce the number of defects originated in the model comprehension and could also positively impact communication among stakeholders. This is true only in case stakeholders have a given experience and familiarity with UML. This implication is very relevant for the practitioner. • Using different layouts for a diagram could lead to different results. This aspect is relevant for practitioners, interested in understanding the best way for creating UML class and object diagrams, and researchers, interested in investigating why a different layout should affect comprehension. Although our empirical work has not been specifically designed for pursuing these concerns, our outcomes pose the base for future work. That is, IT experience and UML familiarity have to be taken into account in designing future empirical studies on the effect of layouts on diagram comprehensibility. • The use of object diagrams induces no additional time burden, while performing a comprehension task. This result is relevant for practitioners/consultants even if this opens an issue that deserves future dedicated empirical investigations: does the use of object diagrams impact on the time to create/maintain UML models? Researchers could be interested in such a kind of future research direction. • The study focussed on UML models in domains in which participants were familiar with. We cannot claim that, in less familiar domains, the gap in comprehensibility between the two treatments would increase or decrease. However, based on the experience we gained in conducting our family of experiments, we might postulate that the presence of object diagrams should help more in unfamiliar domains. This aspect deserves future investigations. Researchers are particularly interested in such open issue. • When trying to balance the costs related to the adoption of a new notation, one should also take into account the time/cost needed for 25
the training of stakeholders. In this case, the cost of training is almost zero, since object diagrams are often well-known. Practitioners and consultants are particularly interested in such point. • The adoption of object diagrams as complement to class diagrams does not require a complete and radical process change in any company interested in doing so. This aspect is clearly relevant for practitioners/consultants. • Although the models were realistic for small-sized software projects, we are not sure that the achieved results scale to real software projects. This point is relevant for practitioners/consultants, but it is even more relevant for the researcher interested in assessing whether the achieved results hold also in real projects. 6. Threats to validity Internal validity threats concern factors that may affect results in an undesirable way. We choose the experimental design in UniBas, UniGe and PoliTo2 (within-participants counterbalanced design) to mitigate learning effects. To limit the fatigue effect, we introduced a break between the tasks in UniBas. This should not hold for PoliTo1, where the factorial design has been employed. Fatigue threat is not present in PoliTo2 since only two experimental objects were used by each participant (instead of four). Other possible threats concern the information exchanged among participants within the same experiment and among the experiments in our family. This was prevented by monitoring students while performing the tasks and by asking them back all material they used. Finally, to avoid apprehension, students were informed that they were not assessed on their performance. External validity concerns the generalization of results. Threats belonging to this category are mainly related to tasks, experimental objects, and participants. We can argue that the chosen UML models were simple, without being trivial. Moreover, they are related to four different domains (file systems, roads, trains, and catalogues). Future empirical investigations are needed to reduce external validity threats. To this end, we plan to conduct case studies on larger and more complex UML models. The rationale behind this choice is that the tasks have been chosen to be simple to fit the time constraints of the experiment and the capacity of the students. In addition, the tasks can be considered realistic in the context of small-sized software 26
projects. Different and special conceived empirical investigations (i.e., case studies) are needed to assess whether the obtained results hold also in actual projects. Our results pose the basis for such a kind of empirical studies and justify their need. The use of students as participants may also affect external validity. However, they were trained on software engineering tasks and the execution of these tasks did not require a high level of industrial experience. Then, we can claim that the use of students here is appropriate as suggested in the literature [41, 42]. Working with students has also advantages, such as their prior knowledge being rather homogeneous, so to give a chance to test experimental and initial hypotheses [43] reducing failure risks and related costs. An additional advantage of using students is that the cognitive complexity of the objects under study is not hidden by participants experience. However, the participants in PoliTo1 and UniBas could be considered close to junior software developers. Moreover, Kitchenham et al. [44] argue that using students as subjects instead of software engineers is not a major issue, as long as the research questions are not specifically focused on experts. Another possible threat to external validity is that we have conducted a family of controlled experiments in artificial laboratory settings with specific constraints. To increase our awareness on the results, we promoted independent replications (i.e., performed by other experimenters) making available a laboratory package to the web. This will allow cheap execution and design of future external replications [45]. Construct validity threats concern relationships between theory and observations. This kind of threat is related to how comprehension of UML models and time were measured. For comprehension, we used comprehension questionnaires. We carefully defined the questions so that they were neither too complicated, to make tasks impossible to perform, nor too simple, to make it difficult to observe any difference among participants. Answers were quantitatively evaluated using two different approaches: score in PoliTo1 and in PoliTo2 and F-measure in UniBas and in UniGe. These approaches avoid as much as possible any subjective evaluation [11, 17, 46]. As far as IT experience and UML familiarity are concerned, the ordinal measures we used are a proxy of the actual participants’ experience and UML familiarity. Therefore, it is possible that a different measure could lead to different results. Comprehension effort was measured by means of time sheets and was validated qualitatively by researchers. This practice is very common in the empirical software engineering community.
27
Conclusion validity threats concern relationships between treatment and findings. In our family of experiments, we applied non-parametric tests to statistically reject null hypotheses. We opted for non-parametric tests because of sample size and non-normality of data. For rejecting the null hypotheses, we exploited the Mann-Whitney and Fisher tests, because they are very robust and sensitive, even with small datasets [47]. In particular, the Fisher test is more accurate than the χ2 test for small sample sizes. To compare the results of the four experiments we: (1) applied some transformations to discretize the comprehension level computed as F-measure (only for UniBas and UniGE), (2) built a contingency matrix of the correct/wrong answers vs. the presence/absence of object diagrams to compare PoliTo2 with the other experiments, (3) for each experiment computed the odds ratio and 95% confidence interval using the contingency table. Given the nature of the factors and the lack of other empirical evidence, we used the simplest possible model (i.e., the linear model) to study the effect of the IT Experience and UML familiarity context factors. Finally, the post-experiment questionnaire, mainly intended to get qualitative insights, was designed using standard ways and scales [33]. Finally, we ensure the replicability of our experiments by providing an experimental package on the web. 7. Conclusions In this paper, we report the results from a family of experiments aimed at investigating the combined effect of object and class diagrams on the comprehensibility of software design. In each experiment, the participants were provided with either class diagrams alone or class and object diagrams together. The participants in our family of experiments were bachelor and master students having different IT experience and familiarity with UML. Results suggested that participants having different IT experience and UML familiarity achieved different levels of benefit from the use of object diagrams. Our findings partially contrast the common beliefs: higher experienced participants having good UML familiarity benefited more of object diagrams in terms of comprehension than lower experienced participants. We speculate that this result depends on the capability of participants to integrate different sources of knowledge, in our case class diagrams and objects diagrams, that is good for experienced participants and bad for inexperienced ones. As for comprehension effort, our results showed the absence of substantial variations in the effort needed to comprehend UML models. 28
Based on our experiments, a project manager should carefully think about the potential benefits of object diagrams considering her/his own industrial context. In a context where the software is developed/maintained by high experienced people with a good UML level, object diagrams could be used because useful. This result could have implications with respect to the use of object diagram in the software industry. From a practical point of view, it would be also crucial knowing whether the additional cost needed to develop object diagrams is adequately paid back by an improved design comprehensibility. In this respect, the results obtained in our research justify and draw the need of future empirical studies to assess cost/benefit in the use of object diagrams to improve design comprehensibility. On the other hand, if the software is developed/maintained mainly by low experienced people with modest UML knowledge, it might not be convenient to adopt object diagrams. The experiments belonging to our family of experiments involved participants possessing different UML familiarity and experience levels and made the use of UML models representing software systems belonging to different domains. Despite such a prominent variety, further empirical studies are highly desirable to provide further evidence or to contradict our results. For example, it would be useful to perform case studies with industrial developers on the comprehension of larger and more complex applications. 8. Acknowledgments The authors would like to thank all the participants in the experiments of our family. References [1] OMG, Unified modeling language (OMG UML) specification, version 2.4.1, Tech. rep., Object Management Group (May 2011). [2] B. Bruegge, A. H. Dutoit, Object-Oriented Software Engineering: Using UML, Patterns and Java, 3rd Edition, Prentice-Hall, 2010. [3] M. Fowler, S. Kendall, UML Distilled: A Brief Guide to the Standard Object Modeling Language (4th ed.), Addison-Wesley Professional, 2010.
29
[4] D. Budgen, A. J. Burn, O. P. Brereton, B. A. Kitchenham, R. Pretorius, Empirical evidence about the UML: a systematic literature review, Software: Practice and Experience 41 (4) (2011) 363–392. [5] M. Torchiano, Empirical assessment of UML static object diagrams, in: Proceedings of the 12th IEEE International Workshop on Program Comprehension, IWPC 2004, IEEE Computer Society, Washington, DC, USA, 2004, pp. 226–230. [6] G. Scanniello, F. Ricca, M. Torchiano, On the effectiveness of the UML object diagrams: A replicated experiment, in: Proceedings of the 15th International Conference on Evaluation and Assessment in Software Engineering, EASE 2011, IET Digital Library, 2011, pp. 76–85. [7] S. N. Woodfield, H. E. Dunsmore, V. Y. Shen, The effect of modularization and comments on program comprehension, in: Proceedings of the 5th International Conference on Software Engineering, ICSE 1981, IEEE Press, Piscataway, NJ, USA, 1981, pp. 215–223. [8] R. Agarwal, P. De, A. Sinha, Comprehending object and process models: an empirical study, IEEE Transactions on Software Engineering 25 (4) (1999) 541–556. [9] S. Abrah˜ao, C. Gravino, E. Insfran, G. Scanniello, G. Tortora, Assessing the effectiveness of sequence diagrams in the comprehension of functional requirements: Results from a family of five experiments, IEEE Trans. on Soft. Eng. 39 (3) (2013) 327–342. [10] H. C. Purchase, L. Colpoys, M. McGill, D. Carrington, C. Britton, UML class diagram syntax: an empirical study of comprehension, in: Proceedings of the 2001 Asia-Pacific Symposium on Information Visualisation Volume 9, APVis 2001, Australian Computer Society, Inc., Darlinghurst, Australia, 2001, pp. 113–120. [11] M. Staron, L. Kuzniarz, C. Wohlin, Empirical assessment of using stereotypes to improve comprehension of UML models: A set of experiments., Journal of Systems and Software 79 (5) (2006) 727–742. [12] G. Scanniello, C. Gravino, M. Genero, J. A. Cruz-Lemus, G. Tortora, On the impact of UML analysis models on source code comprehensibility and modifiability, ACM Trans. on Soft. Eng. and Meth. 23 (2). 30
[13] S. Yusuf, K. Kagdi, J. I. Maletic, Assessing the comprehension of UML class diagrams via eye tracking, in: Proceedings of the 15th International Conference on Program Comprehension, ICPC 2007, IEEE Computer Society, Washington, DC, USA, 2007, pp. 113–122. [14] A. De Lucia, C. Gravino, R. Oliveto, G. Tortora, An experimental comparison of ER and UML class diagrams for data modelling, Empirical Software Engineering 15 (5) (2010) 455–492. [15] H. C. Purchase, L. Colpoys, M. McGill, D. Carrington, UML collaboration diagram syntax: An empirical study of comprehension, in: Proceedings of the 1st International Workshop on Visualizing Software for Understanding and Analysis, VISSOFT 2002, IEEE Computer Society, Washington, DC, USA, 2002, pp. 13–22. [16] F. Ricca, M. Di Penta, M. Torchiano, P. Tonella, M. Ceccato, The role of experience and ability in comprehension tasks supported by UML stereotypes, in: Proceedings of the 29th International Conference on Software Engineering, ICSE 2007, IEEE Computer Society, Minneapolis, MN, USA, 2007, pp. 375–384. [17] F. Ricca, M. Di Penta, M. Torchiano, P. Tonella, M. Ceccato, How developers’ experience and ability influence web application comprehension tasks supported by UML stereotypes: A series of four experiments, IEEE Transactions on Software Engineering 36 (1) (2010) 96–118. [18] A. Gemino, D. Parker, Use case diagrams in support of use case modeling: Deriving understanding from the picture, Journal of Database Management 20 (1). [19] I. Hadar, I. Reinhartz-Berger, T. Kuflik, A. Perini, F. Ricca, A. Susi, Comparing the comprehensibility of requirements models expressed in use case and Tropos: Results from a family of experiments, Information and Software Technology 55 (10) (2013) 1823–1843. [20] S. Xie, E. Kraemer, R. E. K. Stirewalt, Empirical evaluation of a UML sequence diagram with adornments to support understanding of thread interactions, in: Proceedings of the 15th IEEE International Conference on Program Comprehension, ICPC 2007, IEEE Computer Society, Washington, DC, USA, 2007, pp. 123–134. 31
[21] J. A. Cruz-Lemus, M. Genero, D. Caivano, S. Abrahao, E. Insfran, J. A. Carsi, Assessing the influence of stereotypes on the comprehension of UML sequence diagrams: A family of experiments, Information and Software Technology 53 (12) (2011) 1391–1403. [22] C. Gravino, G. Scanniello, G. Tortora, An empirical investigation on dynamic modeling in requirements engineering, in: Proceedings of the 11th International Conference on Model Driven Engineering Languages and Systems, MoDELS 2008, Springer-Verlag, Berlin, Heidelberg, 2008, pp. 615–629. [23] C. Glezer, M. Last, E. Nachmany, P. Shoval, Quality and comprehension of UML interaction diagrams - an experimental comparison, Information and Software Technology 47 (10) (2005) 675–692. [24] J. Cruz-Lemus, M. Genero, M. Manso, S. Morasca, M. Piattini, Assessing the understandability of UML statechart diagrams with composite states – a family of empirical studies, Empirical Software Engineering 14 (6) (2009) 685–719. [25] A. Gross, J. Doerr, EPC vs. UML activity diagram - two experiments examining their usefulness for requirements engineering, in: Proceedings of the 17th IEEE International Conference on Requirements Engineering, RE 2009, IEEE, Los Alamitos, CA, USA, 2009, pp. 47–56. [26] G. Reggio, F. Ricca, G. Scanniello, F. Cerbo, G. Dodero, On the comprehension of workflows modeled with a precise style: results from a family of controlled experiments, Software and Systems Modeling (2013) 1–24. [27] L. Thomas, M. Ratcliffe, B. Thomasson, Scaffolding with object diagrams in first year programming classes: some unexpected results, in: Proceedings of the 35th SIGCSE Technical Symposium on Computer Science Education, SIGCSE 2004, ACM, New York, NY, USA, 2004, pp. 250–254. [28] N. Juristo, A. Moreno, Basics of Software Engineering Experimentation, Kluwer Academic Publishers, 2001. [29] C. Wohlin, P. Runeson, M. H¨ost, M. Ohlsson, B. Regnell, A. Wessl´en, Experimentation in Software Engineering, Kluwer, 2012. 32
[30] V. Basili, G. Caldiera, D. H. Rombach, The Goal Question Metric Paradigm, Encyclopedia of Software Engineering, John Wiley and Sons, 1994. [31] E. Gamma, R. Helm, R. Johnson, J. Vlissides, Design Patterns: Elements of Reusable Object Oriented Software, Addison-Wesley, 1995. [32] J. Cohen, Statistical power analysis for the behavioral sciences (2nd ed.), Lawrence Earlbaum Associates, Hillsdale, NJ, 1988. [33] A. N. Oppenheim, Questionnaire Design, Interviewing and Attitude Measurement, Pinter, London, 1992. [34] E. Kamsties, A. von Knethen, R. Reussner, A controlled experiment to evaluate how styles affect the understandability of requirements specifications., Information and Software Technology 45 (14) (2003) 955–965. [35] G. Scanniello, M. Staron, H. Burden, R. Heldal, On the effect of using sysml requirement diagrams to comprehend requirements: results from two controlled experiments, in: International Conference on Evaluation and Assessment in Software Engineering, ACM, 2014, pp. 49:1–49:10. [36] A. Agresti, An Introduction to Categorical Data Analysis, WileyInterscience, 2007. [37] V. Basili, F. Shull, F. Lanubile, Building knowledge through families of experiments, IEEE Transactions on Software Engineering 25 (4) (1999) 456–473. [38] J. C. Carver, N. J. Juzgado, M. T. Baldassarre, S. Vegas, Replications of software engineering experiments, Empirical Software Engineering 19 (2) (2014) 267–276. [39] B. Bruegge, A. H. Dutoit, Object-Oriented Software Engineering: Conquering complex and changing systems, Prentice-Hall, 2000. [40] B. Kitchenham, H. Al-Khilidar, M. Babar, M. Berry, K. Cox, J. Keung, F. Kurniawati, M. Staples, H. Zhang, L. Zhu, Evaluating guidelines for reporting empirical software engineering studies, Empirical Software Engineering 13 (2008) 97–121.
33
[41] J. Carver, L. Jaccheri, S. Morasca, F. Shull, Issues in using students in empirical studies in software engineering education, in: Proceedings of the 9th International Software Metrics Symposium, METRICS 2003, IEEE Computer Society, Washington, DC, USA, 2003, pp. 239–249. [42] M. Svahnberg, A. Aurum, C. Wohlin, Using students as subjects - an empirical evaluation, in: Proceedings of the 2nd ACM-IEEE International Symposium on Empirical Software Engineering and Measurement, ESEM 2008, ACM, New York, NY, USA, 2008, pp. 288–290. [43] D. I. K. Sjoberg, J. E. Hannay, O. Hansen, V. B. Kampenes, A. Karahasanovic, N. Liborg, A. C. Rekdal, A survey of controlled experiments in software engineering, IEEE Transactions on Software Engineering 31 (9) (2005) 733–753. [44] B. Kitchenham, S. Pfleeger, L. Pickard, P. Jones, D. Hoaglin, K. El Emam, J. Rosenberg, Preliminary guidelines for empirical research in software engineering, IEEE Transactions on Software Engineering 28 (8) (2002) 721–734. [45] M. Lindvall, I. Rus, F. Shull, M. V. Zelkowitz, P. Donzelli, A. M. Memon, V. R. Basili, P. Costa, R. T. Tvedt, L. Hochstein, S. Asgari, C. Ackermann, D. Pech, An evolutionary testbed for software technology evaluation, Innovations in Systems and Software Engineering 1 (1) (2005) 3–11. [46] L. C. Briand, Y. Labiche, M. Di Penta, H. Yan-Bondoc, An experimental investigation of formality in UML-based development, IEEE Transactions on Software Engineering 31 (10) (2005) 833–849. [47] H. Motulsky, Intuitive biostatistics: a nonmathematical guide to statistical thinking, Oxford University Press, 2010.
34