Dense Stereo Range Sensing with Marching Pseudo-Random Patterns Danick Desjardins, Pierre Payeur School of Information Technology and Engineering University of Ottawa, Ottawa, Ontario, Canada
[email protected],
[email protected] Abstract As an extension to classical structured lighting techniques, the use of bi-dimensional pseudo-random color codes is explored to perform range sensing with variable density from a stereo calibrated rig and a projector. Pseudo-random codes are used to create artificial textures on a scene which are extracted and grouped in a confidence map to ensure reliable feature matching between pairs of images taken from two cameras. Depth estimation is performed on corresponding points with progressive refinement as the pseudo-random pattern projection is marched over the scene to increase the density of matched features, and achieve dense 3D reconstruction. The potential of bi-dimensional pseudo-random color patterns for structured lighting is demonstrated in terms of patterns computation, ease of extraction, matching confidence level, as well as density of depth estimation for 3D reconstruction.
1. Introduction The collection of 3D data on free-form objects has been achieved in several ways. The most accurate acquisition method still remains the use of laser range sensors. This, however, entails buying highly-priced specialized equipment which most of the time allows for the coverage of only a limited field of view. A second popular method relies on a calibrated stereovision setup to perform triangulation on matched pairs of feature points. When not relying on a complementary structured lighting device, matching can only occur on sharp edges and unique textures, which results in sparse 3D data about the scene. Similarly, dense stereo disparity estimation schemes that have been proposed to augment the resolution of 3D reconstruction from stereo vision without extra features projection demonstrated limited performance [1, 2].
Fourth Canadian Conference on Computer and Robot Vision(CRV'07) 0-7695-2786-8/07 $20.00 © 2007
Artificial textures created by structured lighting reveal to be an excellent solution for complete surface 3D imaging with affordable equipment given that camera calibration and epipolar geometry now offer accurate and reliable techniques for 3D reconstruction. Numerous types of patterns have been proposed to create virtual textures on a scene for active vision, achieving variable resolution, speed of acquisition and robustness to ambient lighting as well as surface color and reflectance characteristics [5, 6, 12, 15]. Among those, pseudo-random codes, which represent a subset of perfect maps [3], have not yet been fully evaluated and exploited for 3D imaging. This paper develops a procedure for collecting 3D data using active stereovision. Bi-dimensional pseudorandom color patterns are projected to create virtual features that can be matched with high confidence while their density is adaptively controlled in the context of progressive refinement exploration and 3D reconstruction of free-form surfaces. A review of classical structured lighting patterns is presented before pseudo-random color codes are described. Image processing and confidence map creation approaches used to extract and validate pseudo-random codes between pairs of images are detailed. Finally, our experimental setup is presented along with a description of the selected calibration and reconstruction techniques before experimental results are evaluated.
2. Patterns for structured lighting Different kinds of artificial textures, usually called “patterns” can be projected on a scene. Most of them have been introduced for use with a single camera, implying a calibration between the projector and the camera. Four main classes of patterns are found in the literature and are summarized in this section: gray codes, continuous patterns, direct codification and pseudo-random codes.
2.1. Gray codes Gray codes belong to the category of timemultiplexing patterns. They are created by sequences of binary values in which two consecutive numbers only differ by one bit [4]. By correctly deriving the Gray code for a given resolution, each row results in a grayscale pattern made of white and black stripes to be projected successively. Images are saved after the projection of every row and the grayscale value of every pixel is determined throughout all images. Gray code projections are repeated vertically to identify the vertical position. The Gray code identifies the position of a certain point from the projector’s side, since the pattern is known, and matches this point accurately on the image side. This provides the necessary correspondence between the projector and the camera epipoles for triangulation to be performed.
2.2. Continuous patterns Unlike Gray codes that only utilize two colors, black and white, continuous patterns take advantage of the entire range of intensities available from the projector [5]. As a result, continuous patterns can theoretically label positions with fewer images or with a higher precision with the same number of images since a single pattern can contain more information. It results in the projection of different periodic patterns, such as sinusoidal or trapezoidal functions, known as fringe projections, from which depth can be recovered via the phase signature of the pattern on the surface [6]. Though high density and accuracy can be achieved, pattern extraction requires sophisticated image processing approaches and tend to remain sensitive to surface shading since sharp color variations are absent from the projected pattern.
of the spectrum from red to blue is used. Two images of the scene are taken with different color filters. The unique code is found by calculating the ratio between the two images. This method shows robustness to illumination and to the colors present on the objects.
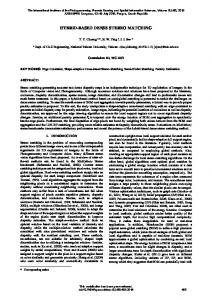
2.4. Pseudo-random codes Pseudo-random codes are a class of spatial neighboring patterns. They can be defined as a series of pseudo-random arrays composed of different color intensity regions in a particular order [9]. Within a given pseudo-random pattern, each array appears only once, making the corresponding color code unique. The array can be of variable size. But a practical implementation of bi-dimensional pseudo-random codes that makes every point of interest being uniquely defined by its surrounding points, while limiting the spatial dimension of the code, consists of developing arrays of 3x3 color elements, C(x), where x represents the array number. Figure 1 illustrates such unique 3x3 color codes, each being delimited here by a white bounding box. An interesting property resides in the fact that unique codes can partially overlap, therefore increasing the density of codes over a limited surface. For a given number of colors used to create the pseudo-random code, here 3 colors (r = red, g = green, b = blue), a code C(x) is defined as the color elements found by traversing the 3x3 array row by row from the top left corner. The codes in this example are: C(x1) = {b,g,r,r,r,r,r,r,g} and C(x2) = {g,g,r,r,r,b,g,b,b}.
2.3. Direct codification These patterns encode each location uniquely over the projection area. They are either based on grey levels or on color. Carrihill and Hummel developed a system called intensity ratio depth sensor to find the correspondence between pixels [7]. The pattern projected consists of a linear wedge spread along the vertical columns containing varying grey levels. A ratio is then calculated between the intensity values of every pixel under the linear wedge and under a pattern of constant illumination. This ratio determines the position of every pixel. However, this method remains sensitive to noise and to non-linearities of the devices. Codification based on color follows a similar strategy. Tajima and Iwakawa suggest a rainbow pattern [8]. A large set of vertical slits are encoded using different wavelengths such that a large sampling
Fourth Canadian Conference on Computer and Robot Vision(CRV'07) 0-7695-2786-8/07 $20.00 © 2007
Figure 1. Two examples of 3x3 unique color codes.
3. Bi-dimensional pseudo-random patterns Algorithms have been proposed to create onedimensional sequences in which a code covered by a window of a given length appears only once [3]. These have also been extended to create bi-dimensional maps of unique codes by orthogonally overlapping two such uniquely defined sequences with a progressive shift along one dimension [10]. Implementation of these bidimensional grids has been proposed under the form of
color-coded intersecting lines projected on a surface to extract feature points from a single camera [11, 12]. But simultaneous overlapping projection of different colors can create interference that results in numerous color combinations, making code extraction and validation less reliable. Bi-dimensional pseudo-random codes are introduced here to avoid such overlap in order to ensure high confidence and possible error correction in matches between the stereo pair of images. This is ensured as only blobs of predefined colors are expected on the scene, under slight variations resulting from objects coloring or shadowing effects. Classical color image processing approaches are then sufficient to achieve highly confident dense disparity maps. In our prototype, bi-dimensional pseudo-random codes are projected under the form of a grid of square color regions such that color patches are easily created on the surface using a standard LCD projector. The 3x3 color codes are generated off-line for a selected number of colors, k, following a pseudo-random iterative approach. The goal is to obtain a complete grid of square color regions where every 3x3 sub-array appears at most once in the complete pattern of NxM color elements. Our pseudo-random grids use only a subset of perfect maps as every 3x3 color code is not guaranteed to appear once and only once, which would make the generation of the grids prohibitive. A perfect map of 3x3 independent color-coded regions composed of k possible color elements offers the possibility for defining k9 different color codes. The pseudo-random projection is built from a list, L, containing three color elements, respectively (red, green and blue) or (cyan, magenta and yellow). The projector used has a resolution of 1024x768 pixels and the size of each square color area is empirically set to 9x9 pixels with a horizontal and a vertical black gap of 9 pixels in between adjacent color areas to facilitate segmentation, as shown in Figure 1. It results in a maximum pseudo-random grid size of 56 columns (1024/18) and 42 rows (768/18). To avoid using the exterior part of the optics, pseudo-random grids of 55 columns and 40 lines of color elements are defined, which contain 53x38 different color codes. Each code being composed of a 3x3 color region, a total of 2014 different color codes can be projected simultaneously, for k=3 colors. This represents 10% of all possible colors codes (39) that are available from the combination of 3 colors to form 3x3 color codes. To compute the pseudo-random pattern, color elements chosen from L are progressively added to an initially empty NxM array. The array construction starts off by adding one 3x3 code in the upper left corner. Every element of this 3x3 code is chosen
Fourth Canadian Conference on Computer and Robot Vision(CRV'07) 0-7695-2786-8/07 $20.00 © 2007
randomly from L. The next step is to fill out the first three rows and then the first three columns of the array. This is done by randomly adding three color elements in the current column until the width, M, of the array is reached or in the current row until the height, N, of the array is reached. Every time three new color elements are added, a new code is created and compared with all previously introduced codes to assure its uniqueness. Different possible permutations of color elements are tested until the new 3x3 code created is unique or until all k3 possible permutations have been exhausted. In the latter case, the procedure is reinitialized. After this step, a 3xM and a Nx3 borders of codes are defined on the top and left-hand side of the array. The remainder of the array is filled out one color element at a time to create a new 3x3 code for every entry. The new code is compared to all existing codes in the array to be validated. In this case, the number of permutations that can be tried is reduced to k. This iterative process continues until a full array of unique 3x3 codes is created for a given number, k, of candidate color elements. It takes about 10 sec to randomly generate a grid of 53x38 color codes given that only 10% of all possible permutations is used when k=3. This computation time drops drastically when k>3 as the number of necessary permutations is further reduced as summarized in Table 1. Once generated for a given value of k, the pseudo-random array definition remains constant and colors can easily be interchanged without compromising the uniqueness of color codes. Table 1. Permutations and time required to compute a 53x38 pseudo-random pattern with k colors. Number of Percentage of possible Generation colors (k) permutations required time (sec) 3 10% 10 4 0.8% 0.44 5 0.1% 0.34 6 0.02% 0.33
4. Color codes extraction and matching Once a pseudo-random pattern is projected on the scene and a calibrated stereo pair of images of the scene is taken, color regions are segmented and the corresponding pseudo-random codes are recovered. Color image segmentation is performed and a confidence map is computed to provide only valid matches for 3D reconstruction.
4.1. Color regions segmentation Segmentation of the HSV-mapped color regions is performed in three steps separately over the left and
the right images. First, the color regions are segmented from the black areas created by the 9-pixel gaps left between every colored area. The hue intensity histogram is computed resulting in k peaks, taking advantage of the sharp color set contained in the pseudo-random pattern,. Thresholding on local minima creates k binary images, one for each different color element. These are used are as initial masks to locate the color regions of interest. Second, a labeling algorithm locates the different regions on each of the k binary images and groups pixels in closed color regions. Labeling is performed by scanning the image following a raster-scan pattern. When a pixel of interest is detected, a new label is assigned only if none of the left, top left, top and top right pixels already has a label. Otherwise, the current pixel takes on their label. In some cases, relabeling is required, as shown in Figure 2. Here the top left and top right pixels have different values. Therefore, the pixels labeled as region 2 are relabeled as region 1. Finally, in order to reinforce the location of color regions, a statistical evaluation is performed on labelled regions. The average size and standard deviation of every labelled region is calculated for each color image. A threshold related to the original size of color regions, here 9x9 pixels, is applied on the average size of the regions. Regions that are larger than the average size plus one standard deviation are further segmented into multiple smaller regions. Those that are under 5 pixels in size are removed.
Figure 2. Labelling color regions.
In some circumstances, two or more distinct regions are labelled as a single one, as shown in Figure 3. This occurs mainly when the normal to the surface of some parts of the scene is close to the orientation of the image plane, as well as on shiny surfaces. But given the uniform projection of square blobs permitted by the pseudo-random pattern projection, all color regions should be approximately the same size over a given area of the image. Any regions that are significantly larger are refined based on the fact that the intensity tends to be greater at the center of a region compared to its border. The average intensity (extracted from the V channel) and its standard deviation are calculated over the entire area of merged color blobs and a threshold is locally applied to eliminate lower intensity pixels, as shown in Figure 4a, which leaves the desired disconnected regions. The center point of each region is finally extracted as a feature point, as shown in Figure 4b with white dots.
Fourth Canadian Conference on Computer and Robot Vision(CRV'07) 0-7695-2786-8/07 $20.00 © 2007
Figure 3. Overlapping color blobs.
a) b) Figure 4. Results from color regions segmentation.
4.2. Code validation and confidence map Once the color regions are properly segmented, 3x3 color codes can be recovered from separate color blobs. However, in spite of a clear projection of the bidimensional pseudo-random pattern and robust image segmentation, some erroneous codes can still be detected. To alleviate this problem and minimize the number of false stereoscopic matches, a confidence map is computed for every detected code. A code, C(x), is composed of nine elements, that is a central color region and its eight neighbor color regions. A search for the eight spatially closest color regions is performed over the set of k segmented images. Every element in a 3x3 color code, besides the middle element, will be part of another 3x3 code. This means that a given code will also have eight neighboring codes containing one of its elements, as shown in Figure 5, except on the borders of the pseudo-random pattern. These neighboring codes are extracted from the captured image and compared to the original pattern, which is known a priori.
Figure 5. Code validation with confidence map.
The number of neighboring codes that can be matched between the image and the original map defines the confidence, S(x), attributed to the given
code, C(x). Mathematically, the level of confidence for a code is defined as follows:
S (C ( x)) = ∑i= x−1 ∑ j = x−1[Cimage (i, j ) ∧ Coriginal (i, j )] x +1
x +1
(1)
Ideally, all of the nine codes should match and the maximum confidence level of S(C(x)) = 9 would be reached for the central color code, C(x). But due to occlusions, changes in depth, borders, errors in acquisition and segmentation, a perfect confidence level is not always achieved even if the matches between C(x) and C’(x) from the left and right images are in fact correct. Code correction is then applied for codes that have a high confidence level, while codes that receive a low confidence level are removed from the list of matching points. Experimentation with the confidence map demonstrated a major reduction of outliers in the 3D reconstruction while the high density of points is preserved, as shown in Figure 6.
a) b) Figure 6. 3D reconstruction a) without confidence map validation, and b) with confidence map.
5. Setup calibration and triangulation The stereo rig used for experimentation consists of two Lumenera LU135C color CCD cameras with a 1392x1040 resolution and one Electrohome EPS1024 projector with a resolution of 1024x768, as shown in Figure 7. Cameras are selected to have a resolution at least slightly higher than that of the projector to provide a capture of sharp colored regions. Focal length of the optics, here 6 mm, is preferably selected to cover a field of view only slightly larger than the projection to ensure that the pseudo-random pattern covers most part of the image plane.
Figure 7. 3D imaging setup.
Fourth Canadian Conference on Computer and Robot Vision(CRV'07) 0-7695-2786-8/07 $20.00 © 2007
One advantage of using a stereoscopic approach rather than a classical structured light system with only one camera is that no calibration is required between the projector and the cameras. Given that projectors are more cumbersome than CCD sensors, preserving the registration between the cameras over a long period of time is easier than with the projector, especially when the sensor is to be mounted on a mobile platform, as is the purpose of this setup. It also gives access to focusing, zooming and brighness adjustment functionalities of the projector to adapt to various operating conditions without influencing the calibration of the system, opening the door to operation out of the laboratory. Moreover, very accurate inter-camera calibration schemes are available, while calibrating a projector with a camera still remains more challenging.
5.1. Calibration Intrinsic and extrinsic calibration between the two CCD cameras is performed. First, a series of images of a checkerboard calibration pattern are taken for each camera. The classical Tsai’s algorithm is implemented to estimate intrinsic parameters, including radial distortion, individually for each camera. Second, extrinsic calibration is performed between the two cameras using a second set of checkerboard images captured simultaneously by both sensors at different positions over the workspace. Tsai’s algorithm is also used to estimate the relative rotation and translation between the stereo pair. In the resulting setup, both cameras are tilted about 20o with respect to the main axis of the projector and separated by a baseline distance of about 50 cm.
5.2. 3D reconstruction 3D reconstruction is performed on matching center points of the central color blob extracted for every 3x3 color code in the left and right images, as shown in Figure 4b. Only pairs of points that received a high confidence level are processed. Triangulation is applied with respect to a reference frame attached to the left camera. The matched center point from the right camera is converted to the left camera’s reference frame along with the focal points of both cameras using the stereo calibration parameters. Combining the image plane matches and the two focal points, an optimal triangulation technique proposed by Hartley and Sturm [13] is used. In our experimentation, this approach demonstrated a clear superiority to the classical midpoint method [14] that was initially considered.
6. Marching pseudo-random patterns The number of color codes that can be projected on the scene is limited by the resolution of the projector and of the cameras as color areas must be wide and separated enough from each other to be reliably extracted and achieve a high confidence on the stereo matches. This introduces a limitation on the density of 3D points that can be estimated over a given surface of the scene. While the default spatial density of artificial feature points created with a 40x55 color grid projection is usually much higher than the density of actual features required to perform stereoscopic vision without structured lighting, it still cannot provide high resolution surface maps of large objects. In order to overcome this limitation, we extend the approach with marching bi-dimensional pseudorandom patterns. The principle consists of collecting a sequence of pairs of images while the same pseudorandom color pattern is progressively shifted over the scene by realignment of the color grid over the projector LCD array. The fact that the projector is not calibrated with respect to the cameras provides a maximum of flexibility to manipulate the projection. Moving the same pattern over many positions in space also preserves the ease and reliability of the segmentation and confidence map computation as the size of colored regions remains constant. The number of different possible positions for the entire pseudorandom pattern to be shifted horizontally, Gh, and vertically, Gv, is given by:
reconstructed. For a projection over a scene covering a 1x1 meter surface, the spatial resolution of the 3D points distribution can reach up to 1.24 mm. This spatial resolution varies inversely proportionally with the size of the surface that is covered by the pseudorandom pattern. Unlike structured lighting systems that use time-space analysis to achieve sub-pixel resolution [15] but require synchronization with the projector, the sequential marching pseudo-random pattern projection remains independent from projector’s calibration and can still achieve dense 3D reconstruction. This approach also provides the opportunity to operate sub-sampling to create on-demand selective acquisition in which spatial resolution of the artificial features distribution on the scene can be increased only over regions of interest. The latter can be identified previously from a coarse resolution scan using a single pattern projection, which takes about 15 sec to process. Scanning can also be scaled to scenes of various dimensions using the same projector and cameras equipped with motorized optical lenses and dynamic intrinsic calibration.
G h = Gv = c + d
(2) where d is the width in pixels of the black separation zone between color regions, and c is the number of pixels defining the width of a color region. As shown in Figure 8 for the case where each color region is 9 pixels wide and 9 pixels high, and where a separation area of 9 black pixels (here depicted in white) is preserved in between color squares, the entire pseudo-random pattern can be shifted horizontally in 18 different positions, and vertically in 18 different positions before becoming redundant. This leads to 324 possible projections of the pseudo-random pattern on the scene, each projection providing a separate set of feature points. The projections being performed successively, there is no interference created in between the patterns but requires the scene to be static over the entire duration of the acquisition. Given that the pseudo-random pattern used in our implementation contains 40 rows and 55 columns, each projection offers 38x53 unique color codes, and therefore 2014 potential point matches. When the full range of shifting values is exploited, a maximum of 652536 feature points can be extracted and
Fourth Canadian Conference on Computer and Robot Vision(CRV'07) 0-7695-2786-8/07 $20.00 © 2007
Figure 8. Marching pseudo-random patterns.
7. Experimental results 3D imaging and reconstruction was performed over various objects to evaluate the performance of the proposed range sensor using a 3-color pseudo-random pattern projection. Figure 9a shows a piece of foam shaped like a small chair which offers many planar surfaces with very different orientations. Due to its geometrical characteristics, this object has served has a benchmark for the evaluation of various range sensing approaches in our research group [2]. Figures 10 presents the left and right images after application of thresholds on the hue histogram to highlight the colored pixels as projected on the object. Figure 11a presents the reconstruction of 3D points obtained with one projection of the 40x55 pseudorandom pattern. Only points belonging to the object are kept here while background points are removed for clarity. Figure 11b shows a higher density 3D
reconstruction when 16 shifted patterns (a distribution over 4 horizontal shifts x 4 vertical shifts) are projected. On the lower resolution representation, we observe the regular distribution of reconstructed 3D points as well as the absence of outliers, which confirms an accurate extraction of matching points from colored regions. Figure 12 presents a mesh mapped on the cloud of 3D points. As expected, we notice that the proposed 3D imaging system performs better on surfaces with a normal direction close to the projector’s main axis as color regions receive a higher confidence level after image segmentation. Missing points on the inside part of the right-hand side arm of the chair are due to the absence of valid matches between the left and the right images given the impossibility to extract complete 3x3 color codes in this area from the right image. But these are extreme cases where the object’s surfaces are nearly parallel to the direction of projection and to the optical axis of the cameras. The operation of the range sensing system has also been validated on objects with smoother surface transitions and different textures or levels of reflectance. The kettle shown in Figure 9b is one of those objects which exhibits a shiny plastic surface that results in reflectance characteristics totally different from the matt surface of the foam chair. Figure 13 presents the set of 3D points reconstructed from the surface of the kettle after the pseudo-random pattern was shifted 16 times. We observe the high density of points, which is sufficient to correctly map the small bump all around the base of the kettle. This deformation is about 5 mm deep, which provides a good illustration of the accuracy of the sensor on depth estimation, which is estimated to be within 2 mm for an object located about 1.5 m from the sensor. On the other hand, the need for a 3x3 color code to be extracted for every 3D point to be reconstructed preempts the sensor from perceiving small surfaces, such as the side of the handle of the kettle. But the field of view being scalable with this system, the issue can be overcome by reducing the distance between the object and the sensor, resulting in smaller color blobs on the scene. In the scenarios presented here, the objects were located at about 1.5 m in front of the sensor, making each color blob to cover a surface of about 2 mm x 2 mm on the object. Moreover, the example of the kettle demonstrates that performance is neither affected by the change of shade between the upper and the lower part of the object, nor by the higher reflectivity of the upper white plastic surface, except for those few regions where ambient light originating from the room’s fluorescent tubes creates a strong glare.
Fourth Canadian Conference on Computer and Robot Vision(CRV'07) 0-7695-2786-8/07 $20.00 © 2007
a) b) Figure 9. Benchmark objects a) foam chair, b) kettle.
Figure 10. Left and right images of the pseudo-random pattern projected on the object.
a) b) Figure 11. 3D reconstruction with a) only one, and b) 16 shifted pseudo-random pattern projections on the foam chair.
Figure 12. Surface mesh mapped on the foam chair 3D reconstruction.
Figure 13. 3D reconstruction with 16 shifted pseudorandom pattern projections on the kettle.
8. Conclusion This experimental evaluation of the use of bidimensional pseudo-random pattern projection to assist in imaging of 3D objects from a stereoscopic pair demonstrated the flexibility of the approach and the accuracy that can be reached to compute dense 3D maps. The definition of an explicit bi-dimensional pseudo-random pattern of unique color codes has been presented, as well as a straightforward image segmentation and code extraction procedure that relies on a confidence map to eliminate outliers that usually result from erroneous matches in passive stereoscopic vision. The use of marching patterns provides an efficient way to increase scanning resolution ondemand, in accordance with the accuracy and computation time requirements of a specific application. Refinements to the proposed 3D imaging system that are currently under development include the dynamic selection of the number of colors, k, and of the hue value of each color present in the pseudorandom pattern to further improve robustness to lighting and chromatic conditions found in various environments. Advantage is also to be taken of the fact that two color CCD cameras are used to collect not only matching features for depth estimation but also the color/texture characteristics of all points on which a valid match can be extracted by collecting a supplementary image with the projector turned off. This extension aims at providing simultaneously a dense 3D reconstruction with the corresponding texture information reliably mapped on every point.
[4] G. Sansoni, S. Corini, S. Lazzari, R. Rodella, and F. Docchio, “Three-Dimensional Imaging Based on Gray-code Light Projection: Characterization of the Measuring Algorithm and Development of a Measuring System for Industrial Applications”, Applied Optics, 36(19), 1997, pp. 4463-4472. [5] D. Scharstein and R. Szeliski, “High-Accuracy Stereo Depth Maps Using Structured Light”. Proc. of IEEE Computer Vision and Pattern Recognition, vol. 1, Madison, WI, June 2003, pp. 195-202. [6] S. Zhang, and P.S. Huang, “High-Resolution, RealTime 3D Shape Acquisition”, Proc. of IEEE Conference on Computer Vision and Pattern Recognition, Washington DC, MA, 2004, pp. 28-38. [7] B. Carrihill, and R. Hummel, “Experiments with the Intensity Ratio Depth Sensor”, Computer Vision, Graphics and Image Processing, vol. 32, Academic Press, 1985, pp. 337–358. [8] J. Tajima, and M. Iwakawa, “3-D Data Acquisition by Rainbow Range Finder” Proc. of the Intl Conf. on Pattern Recognition, 1990, pp. 309-313. [9] R.A. Morano, C. Ozturk, R. Conn, S. Dubin, S. Zietz and J. Nissanov. “Structured Light Using Pseudorandom Codes”, IEEE Trans. on Pattern Analysis and Machine Intelligence, 20(3), 1998, pp. 322-327. [10] P.M. Griffin, L.S. Narasimhan, and S.R. Yee, “Generation of Uniquely Encoded Light Patterns for Range Data Acquisition”, Pattern Recognition, 25(6), 1992, pp. 609-616. [11] J. Salvi, J. Battle, and E. Mouaddib, “A Robust-Coded Pattern Projection for Dynamic 3D Scene Measurement”, Pattern Recognition Letters, vol. 19, 1998, pp. 1055-1065.
The authors gratefully acknowledge the financial support from Ontario Centres of Excellence (CITO) and the collaboration of Neptec Design Group.
[12] J. Pagès, J. Salvi, and C. Matabosch, “Robust Segmentation and Decoding of a Grid Pattern for Structured Light”, Proc. 1St Iberian Conf. on Pattern Recognition and Image Analysis, LNCS 2652, Mallorca, Spain, 2003, pp. 689696.
10. References
[13] R. Hartley, and P. Sturm, “Triangulation”, Computer Vision and Image Understanding, 68(2), 1997, pp. 146-157.
9. Acknowledgments
[1] S. Birchfield, and C. Tomasi, “Depth Discontinuities by Pixel-to-Pixel Stereo”, Proc. of IEEE Intl Conf. on Computer Vision, Bombay, India, 1998, pp. 1073-1080. [2] C.S. Yang, P. Curtis, and P. Payeur, “Calibration of an Integrated Robotic Multi-Modal Range Scanner”, IEEE Transactions on Instrumentation and Measurement, 55(4), 2006, pp. 1148-1159. [3] C. J. Mitchell, T. Etzion, and K.G. Paterson, “A Method for Constructing Decodable de Bruijn Sequences”, IEEE Trans. on Information Theory, 42(5), 1996, pp. 1472-1478.
Fourth Canadian Conference on Computer and Robot Vision(CRV'07) 0-7695-2786-8/07 $20.00 © 2007
[14] P.A. Beardsley, A. Zisserman, and D.W. Murray, “Navigation using Affine Structure from Motion”, Proc. of European Conference on Computer Vision, LNCS Series 801, Springer-Verlag, Berling, New York, 1994, pp. 85-96. [15] L. Zhang, B. Curless, and S.M. Seitz, “Rapid Shape Acquisition Using Color Structured Light and Multi-pass Dynamic Programming”, Proc. of Intl Symp. On 3D Data Processing, Visualization and Transmission, Padova, Italy, 2002, pp. 24-36.