The Use of Dense Stereo Range Data in Augmented Reality Gaile Gordon†, Mark Billinghurst††, Melanie Bell†††, John Woodfill†, Bill Kowalik†††, Alex Erendi†††, Janet Tilander††† Tyzx, Inc.† 301 Bryant Street Palo Alto, CA 94301
[email protected]
Human Interface Technology Laboratory †† University of Washington, Box 352-142 Seattle, WA 98195 USA
[email protected]
Abstract This paper describes an augmented reality system that incorporates a real-time dense stereo vision system. Analysis of range and intensity data is used to perform two functions: 1) 3D detection and tracking of the user’s fingertip or a pen to provide natural 3D pointing gestures, and 2) computation of the 3D position and orientation of the user’s viewpoint without the need for fiducial marks calibration procedures, or manual initialization. The paper describes the stereo depth camera, the algorithms developed for pointer tracking and camera pose tracking, and demonstrates their use within an application in the field of oil and gas exploration. Keywords: vision-based tracking, natural interaction,
unprepared environments, depth sensing, stereo
1
Introduction
Low power, compact hardware support for fast dense stereo depth computation enables new techniques for many applications. In Augmented Reality (AR), fast depth sensing can help in a number of areas including: more natural methods for interaction via robust gesture analysis, computing camera pose without requiring fiducial marks in the scene, and rendering dynamic real world objects with correct occlusion relationships with virtual objects. This paper addresses the first two issues. New algorithms are presented to perform 3D detection and tracking of the user’s fingertip or a pen to provide natural 3D pointing gestures, and to compute the 3D position and orientation of the user’s viewpoint without the need for fiducial marks or complex calibration procedures. These methods are incorporated into an existing AR system [4] and demonstrated within an application in the field of oil and gas exploration. Dense stereo depth has traditionally been too computationally intensive to use in real-time systems without one-of-a-kind specialized hardware [8] – producing issues of cost, form factor, and power consumption. Recently, a specialized ASIC [22, 19] has been developed for real-time dense stereo processing, creating new
ChevronTexaco††† PO Box 6046 San Ramon, CA 94583
[email protected]
opportunities for low-power, real-time 3D systems. The AR system presented here uses a Tyzx stereo vision system, which is described in more detail in Section 3. The rest of the paper describes the pointer tracking and pose tracking algorithms, followed by a target application in the field of oil and gas exploration. Finally we discuss directions for future work and our conclusions.
2
Related Work
Automated 3D detection of the user’s fingertip or a held pointer facilitates interaction with the virtual objects in an AR application. Rendering of the detected pointer also contributes to a shared understanding of the virtual space during collaboration [3, 18]. Previous approaches to pointer tracking have largely relied on instrumenting the pointer, e.g. with a Polhemus tracker [18, 12] or haptic device [20], which is undesirable from a usability perspective. There has also been some work on 2D vision based techniques [5] that has limited value because the motion of the hand is only captured in two dimensions (e.g. these methods require additional interface protocols - such as a pause or independent hand gesture - to indicate a “click” in a 3D mouse application). This work has also assumed a fixed camera position. A few authors have addressed 3D vision-based pointer tracking [15, 14] from a fixed viewpoint, however these approaches have been limited to tracking a hand, relying on skin color for segmentation or a full kinematic model of the hand. In both approaches the pointer features are extracted independently in two views and combined to compute 3D position. No previous vision-based method has addressed 3D tracking of generalized pointers with a dynamic camera viewpoint against complex backgrounds. The method presented here addresses all these issues through the use of dense stereo and intensity data. Automated real-time computation of the viewer/camera pose relative to the coordinate system of the virtual data is crucial in AR systems in order to maintain the perception that the virtual data is part of the real world. There are many successful systems for vision based camera pose tracking [11, 23], most of which are based on fiducial markers introduced into the scene at known 3D positions.
Depth Image
Left intensity Image
Select range in volume of interest
Camera Pose
Transform to camera view
Background model
Image difference
Update background model Construct foreground mask mask
Find pointer tip (x,y)
Figure 1: The handheld display
These methods are not appropriate for operation in unprepared (natural) environments. Some work has focused on augmenting a limited set of fiducials with natural features automatically detected in the image [7, 9]. Several authors have also addressed unprepared environments by using general structure from motion algorithms or modifications of these algorithms [17] to compute relative inter-frame motion. These methods require manual initialization to determine absolute camera pose and cannot operate in real time without simplifying assumptions. Little work has been done in real-time camera pose in unprepared environments using depth sensors. Using a depth sensor has the advantage of providing direct measured 3D relationships between image points – information which otherwise is provided by calibrated fiducials or manual initialization. The use of feature based (sparse) stereo to compute camera pose using natural features has been investigated [9]. Our approach differs in several important ways from this work: our system uses dense rather than sparse stereo, it does not require initialization with fiducial markers, does not integrate an inertial tracker, and runs on a single PC (rather than SGI Onyx2 IR with 16 CPU’s). The camera pose-tracking algorithm presented does assume that the virtual data coordinate system is defined relative to a plane in the scene (table, floor, etc). This simplification is similar to that in [17], and fits well with the paradigms of many AR systems. It does not require any other prior knowledge about the scene, and can operate with natural complex backgrounds.
3 Dense Real-time Stereo System The AR system developed is related to a previous handheld opera-glass display used in the MagicBook system [4]. A binocular display (800x600 pixel Inviso eShades) is coupled to a Tyzx stereo camera head (Figure 1) for image capture. The stereo camera head is a lightweight (6 ounces) pre-calibrated unit with a baseline of 1.5 inches. The left and right images are sent to a PCI board
Kalman Filter
Find pointer tip z
Transform to Virtual Coord.s
Figure 2: Pointer detection and tacking algorithm
that hosts the Tyzx DeepSea ASIC. The DeepSea card is low power and contains the complete stereo computation engine, leaving the PC's processor essentially unburdened and available for other tasks. The DeepSea ASIC is capable of processing 512x480 images at rates of 132 frames per second (fps) with a high depth resolution of 52 disparities. The imagers used in this application provide imagery at 30 fps. Depth resolution in the near field (about 30 cm from the camera) is better than 1 mm based on 3 bits subpixel match accuracy. At about 60 cm (maximum reach of the user) the depth resolution is just under 3 mm. Unlike feature based stereo systems, which compute sparse depth measures based on correspondence of high level features detected independently in each image, this stereo system computes depth on a pixel by pixel basis. This approach requires no a priori or application dependent knowledge about the scene. The underlying stereo matching algorithm used is the Census correlation [24], which is based on comparisons of relative intensity patterns. The DeepSea ASIC uses a parallel, pipelined architecture first demonstrated in an FPGA implementation [22]. The system outputs 16 bit depth images as well as synchronized and rectified left and right images. Rectification aligns the images’ epipolar geometry and eliminates image distortion; the left image is registered to the depth image. This imagery is ideal for use by binocular displays, and would not be available from any other type of depth sensor (laser scanner, time of flight).
4
Natural Pointer Detection and Tracking
The 3D position of a pointer controlled by the user is a valuable input for interaction design. If a viewer would like
Z
Y
X
Reference plane
Square fiducial target of known size
A
B
C
D
Figure 3: Virtual model coordinate system. Origin is center of target. Target plane is X/Y plane. Z axis is perpendicular to the target.
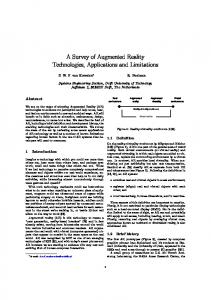
to discuss a location in the virtual dataset, it is very natural to simply point at this location as they view the data. We introduce a method of computing the 3D location of a viewer’s fingertip or held pointer, such as a pen, in the coordinate system of the virtual data. A virtual pointer can be rendered into the scene at this location or into different views of the virtual data to aid in collaboration. Our pointer detection and tracking algorithm uses both range and intensity data. A Kalman filter is used to increase stability. The algorithm is summarized in Figure 2 and can be broken down into the following steps, which we describe in more detail below. 1. Threshold range data beyond the reference plane 2. Compute the intensity difference between the background model and the current frame 3. Evaluate range support within the difference mask to reduce the effect of shadows and noise 4. Locate the (x,y) tip of the pointer using a priori location estimate from the Kalman filter 5. Use depth data to determine z coordinate of the pointer tip 6. Update the Kalman filter with the detected location 7. Use the difference mask to update the background model
4.1 Selecting 3D region of interest The first three steps in the pointer tracking algorithm focus on segmenting the image data to identify in which pixels the hand or pointer appears. We first segment the range data, then the intensity data, then combine these results to produce a foreground mask used in the remaining stages of the algorithm. In the paradigm of the earlier MagicBook system [4], the virtual data coordinate system is positioned with respect to one or more square targets on a planar surface (Figure 3). The planar surface provides an intuitive reference on which a virtual object rests. Following this approach, the pointer detection search is limited to the space between the reference plane and the viewer. The transform between the virtual data coordinate system and the camera view coordinate system is often referred to as the model view matrix, M, or the camera
Figure 4: A) left image, B) difference mask, showing range support in white, C) geodesic distance from the border, light colors are further, minimal path shown in red, and D) background model.
pose. The virtual data coordinate system is defined as shown in Figure 3. In the camera coordinate system, the x/y plane is parallel to the imager, and the z axis points perpendicular to the imager, out into the scene. M is computed either from the target image (based on known metric relationships between points on the target), or using the 3D data on the planar surface as described in Section 5. This transform defines the position of the reference plane (x/y plane in the model coordinate system) in the camera view. We use the z coordinate of the reference plane in camera view to threshold the depth data at every pixel such that we consider only data closer to the viewer than the reference plane.
4.2 Computing the foreground mask We use intensity data to improve reliability of the pointer detection when range can not be measured at all points on the hand/pointer and to improve the segmentation of the pointer boundary. Background subtraction is a classic method of image segmentation in which the typical appearance at each pixel is used to model the background. Any pixel that isn’t modeled well by the background statistics is then taken to be part of the foreground. This has been used very successfully in fixed camera views with both depth and intensity image statistics [6]. However, the viewpoint with the handheld display is constantly varying. Therefore, we model the background in the more stable coordinate system of the virtual world. We define the background model to be the intensity pattern on the reference plane, as seen from the positive z-axis in the virtual model coordinate system (see Figure 4D). The background model is initialized (using M-1 and taking the depth at each pixel to be the depth of the plane) based on the view when there is no object detected in the scene (or at
the time the pointer mode is turned on). The background model is updated at each frame, using the foreground mask to insure we do not corrupt the model with foreground data. To perform the background subtraction we use M to transform the background model into the current camera view, and then take the absolute value of the difference between the transformed model and the current left image at every pixel where data is defined for both views. The raw difference image has several undesirable properties that we must address. First, small errors in the estimation of the camera pose will cause slight misalignments in view. These misalignments can cause high difference values that do not correspond to foreground pixels. The difference mask is filtered with a morphological opening to eliminate up to approximately one pixel misalignment effects. A larger morphological closing is also used to fill holes in the mask caused when there are similar intensity values in background and foreground. Second, shadows will be represented in the difference mask but are not part of the pointer itself. The depth values on the shadows would be at the depth of the plane (or undefined if there is no texture), so we eliminate components of the difference mask that have no depth support. Although we eliminate these points from the mask used for further pointer tip analysis, we do not update the background at the detected shadow points. Figure 4 shows some intermediate steps of the pointer processing. The image in Figure 4A is the left intensity image, showing a hand reaching into the scene holding a pen. The foreground mask computed is shown in Figure 4B, with the range support shown in white.
4.3 Locating the pointer tip The pointer tip detection is done in the camera view space. The location algorithm is based on the simple observation that if the viewer is reaching into the scene their hand or arm will always intersect the border of the image. The location of the tip of the pointer in the 2D foreground mask will therefore be the point farthest from the image border, where distance is measured only within the shape of the foreground mask. More specifically, the tip will be the maximum geodesic distance from the border (Figure 4C). The z value at the tip is computed from the depth image. The 3D orientation of the pointer is also computed by considering the minimal path away from the tip location towards the border (shown in red in Figure 4C). The 3D points along the first 2 cm of this path are fit to a line that provides the orientation vector of the pointer. A Kalman filter with a constant velocity motion model is used to stabilize the tip location and provide an estimate of the tip location for the subsequent frame. M-1 is used to transform the position of the pointer into the virtual model space where it can be used to interact with the virtual content.
Depth image Detect planes Plane i-1
Track Plane
Left intensity image
Map intensity to normalized view, Ni
(M′)−1(α, β, 0, Tx, Ty, Tz)
Align Ni to Ni-1
Ni-1 update
Map intensity to adjusted normalized view, Ng
Align Ng to global feature map to correct for drift
M−1(α, β, γ, Tx, Ty, Tz)
Global feature map
update M
Figure 5: Camera pose tracking algorithm
5 Camera Pose Tracking Camera pose tracking is a critical part of any AR system. The task is to determine the six degree of freedom transform between the virtual data coordinate system and the camera coordinate system, M, which is often referred to as the model view matrix because it maps the model into the current view. M is determined by three rotation angles, α, β, γ, and a 3D translation, Tx, Ty, Tz. The pose tracking algorithm we have developed, summarized in Figure 5, makes use of the dense range data to determine the equation of the reference plane in each frame. Fitting the depth data from a large number of pixels to a plane reduces instability due to measurement error. The orientation of the reference coordinate system on the plane (γ), and the location of the origin of the reference coordinate system on the plane are determined based on the relative locations of intensity data features on the surface of the plane. The three degrees of freedom that are determined directly from the depth data at each frame will not be subject to drift. This provides an advantage over structure from motion algorithms that determine all six degrees of freedom relative to the previous frame, and hence are subject to drift in all six parameters. We also provide an explicit drift correction step based on a map of “global” intensity features. The algorithm can be broken down into the following steps: 1. Detect planes in depth image: set α, β, Tx, Ty, Tz
2. 3. 4. 5.
Map intensity on candidate plane to the model coordinate system creating the normalized view, Ni Find 2D transform matching Ni to Ni-1: set γ, and update Tx, Ty, Tz Match adjusted Ni to global view: refine γ, Tx, Ty, Tz to correct for drift Update global view with newly visible features
5.1 Detecting the Reference Plane At each frame the incoming depth image is first processed to find candidate reference planes. A least squares plane fit is performed in each 25x25 window of the data. The regions are iteratively merged, beginning with the best fit plane, with other similar planes detected. The final set of planes is compared with the tracked plane from the previous frame to determine correspondence. Correspondence is based on a comparison of plane orientation and distance from the viewer. If no planes were previously tracked, a track is initialized based on the detected plane that includes the most data points. The orientation and distance of the plane provides 3 degrees of freedom of the pose. The 2D position of the origin of the model coordinate system on the plane and the rotation of the coordinate system about its z axis (γ) cannot be determined from the range data itself in our application (in which the view often contains only the reference plane). The origin is set arbitrarily (to the projection of the image center on the plane) at this point and corrected in the following steps based on the intensity data and the pose in previous frames. Similarly, γ is initially set to zero. We refer to the model view transform in this partially determined state as, M′.
5.2 Normalized View The intensity data in the left image that is part of the detected plane is mapped to the model view using (M′)−1. This transform will place the image data on the x/y plane of the model coordinate system. The image will look as if we are seeing the scene from a constant distance directly above the plane. We refer to this as a normalized view because we have factored out the effect of plane orientation and viewing distance. Computing the normalized view in each frame reduces the pose tracking problem to a search for a 2D rigid transform: a single angle of rotation and a 2D translation, aligning Ni to Ni-1, the previous frame’s normalized view.
5.3 Determining On-Plane Rotation and Translation There have been many solutions presented to find the best 2D transform aligning two images. For efficiency, we use a feature based method. The feature selection and tracking method presented in [16] is used to identify local intensity regions that are considered optimal for tracking (regions that have strong edges in multiple directions). The
feature locations identified in the first image are independently tracked into the second image, based on a Newton-Raphson method minimizing the difference between two image windows. Since a rigid transform should preserve distances, we use this principle to remove features that have been tracked poorly before computing the transform. More specifically, we construct an F x F matrix, D, where F is the number of features tracked between images. D(i,j) = | ||fi –fj || - ||fi′ –fj′ || |, where fi is the detected location of feature i and fi′ is the tracked location. Based on the observation that a badly tracked feature would have higher relative distance to most correctly tracked features, we begin with the feature that has the highest row (or column) sum, and remove features until the maximum entry of any row is below a threshold. The optimal 2D transform that maps the features onto their tracked locations is computed using a singular value decomposition as presented in [2]. The resulting 2D rotation angle is added to the previous frame’s solution for γ, the rotation angle about the model z axis. The 2D translation is used to modify the previous frame’s estimate of the origin of the model coordinate system.
5.4 Compensating for Drift Pose parameters that are computed relative to the previous frame’s solution will typically exhibit drift over time as error accumulates. We introduce a global feature map in order to reduce the effect of drift. The global feature map is a 2D map indicating the location of intensity features (and the intensity pattern around the points) on the reference plane that have been identified as good areas for tracking. It is maintained in the normalized view, representing the x/y plane of the model coordinate system. At the time the reference plane is initially detected, the first set of intensity features is added to the map. In each subsequent frame, new features are added that do not overlap those already on the map. A new normalized view, Ng, based on the inverse of the current full pose estimate, M, is created and compared to the global feature map. The alignment error between these two views will be due to error in the pose computation process, and should be very small – indeed, it is typically less than a pixel. We find the best 2D transform aligning Ng to the global map using the same method discussed above. The resulting rotation and translation are used to refine the pose parameters. The 3D rotation and translation transforms based on the estimated α, β, γ, Tx, Ty, Tz, are composed to form the final camera pose estimate, M. By anchoring the results to the global features at each frame, the camera pose remains stable over many frames.
6
A Prototype Application
The techniques we have described remove the need for fiducial based AR tracking and allow users to interact with virtual content using their free hands or natural objects. As such dense stereo methods can be used in a wide range of possible application areas. The application area we have initially selected is scientific visualization in the petroleum industry. The dense stereo tracking and interaction techniques have been implemented in a prototype AR visualization system being developed at ChevronTexaco. In this section we first describe the motivation for this system, then the implementation and user experience.
6.1 Motivation The oil and gas exploration and production (E&P) industry has been using visualization techniques for a number of years. Immersive projection environments are becoming common. These are used to create, understand and refine large and complex models of the earth’s subsurface for the purposes of finding oil and gas bearing reservoirs. One of the greatest recognized values of the immersive projection environments is the collaboration they provide to cross-functional teams of earth scientists and engineers working on a field. However, collaboration in a stereo projection environment has several drawbacks. Currently, only one or two distinct user perspectives can be supported and all other views have some distortion. A high level of expertise is needed to drive the application in the environment, which causes some participants to be unable to participate in determining the view of the model. Costs limit the number of immersive projective environments, allowing only a few teams to work at a time and the technology is not available at all office or work locations. Due to the high cost of drilling wells (up to $35 million USD) and the high risk of failure (1 in 10 exploration wells result in an economic reservoir), most E&P companies do not explore and produce fields alone but partner with other E&P companies. Partner meetings are frequent, with the involved companies coming together to agree on the earth model, the risks involved in drilling, well path direction and final well location. These meetings, unfortunately, do not always take place where an immersive projection environment is available. The goal of our AR application research is to provide a method of viewing the data at partner meetings. The application must be portable, secure, and intuitive. Data models are always changing, as more information about the subsurface becomes available. To incorporate these changes, the data models must be easily updated. The current method of viewing the data is to show 2D paper maps that display the earth model at various depths or fixed views from a 3D modeling application. (Figure 6) Using AR technology we can provide a portable visualization system that gives some of the capability of immersive projection displays at considerably less cost. In addition, if each user has their own handheld display they can get independent views into a dataset and collaboratively
Figure 6: Fixed view plot of 3D earth model
Figure 7: AR View of the Oilfield Wells
discuss the same model. In working toward this vision we have developed several prototype interfaces that we describe in the next section.
6.2 Implementation In the first version of this interface, the ARToolKit tracking library [1] was used to superimpose virtual models on a set of fiducial markers. When users look through the handheld display at a sheet of paper with squares printed on it, they see 3D virtual seismic and oilfield information overlaid on the paper (Figure 7). On this terrain model, virtual cubes represent the location of wells in an oil field. Some of the wells in the field produce oil while others inject steam into the reservoir. (The steam loosens the oil, allowing it to flow.) Users can interact with the model using a handheld paddle (Figure 8). They are able to touch individual oil wells in the model to see information about the capacity and flow rate of that well. Users have the option to show all wells, production wells or steaming wells.
Figure 8: Paddle Interaction with Well Models
A
Figure 9: Virtual Terrain Model The paddle can also be used to manipulate the entire model. In the viewpoint move mode the motions of the paddle are mapped onto model rotation and zooming. As the user moves the paddle left and right the entire model rotates about its vertical z axis, while up and down motion rotates the model about the horizontal x axis, and moving closer and further to the user’s view (along the z axis) zooms the model in and out. In this way the user can see the model from any viewpoint, or zoom in to get a close view of the wells (Figure 9). Users can toggle between pointer/selection mode and the viewpoint move mode either through keyboard commands or voice commands (using Microsoft Speech SDK 5.1). The current prototype builds on this earlier work by replacing the fiducial tracking with dense stereo interaction. Three dimensional pointer detection and tracking capability was added to the system to provide a natural alternative to the paddle interface. Figure 10 shows the AR view of a subsurface view of a virtual earth model. This model displays two surfaces and five faults to represent the reservoir location. Red lines and yellow derricks represent the well locations in the reservoir. The users can use either their finger (Figure 10a) or a pen (Figure 10b) as a pointing device. This allows them to show interesting parts of the model to others involved in the discussion. They can
B Figure 10: AR view of earth model and the finger or pen used as 3D pointer. physically move around the model or move the pattern sheet around to show the different orientations of the model. The camera pose that is required in the pointer tracking can be computed via the traditional ARToolKit target-based method, or via the depth based camera pose method of the previous section. With the natural pointer detection method described in section 4, users can interact with virtual models with the same functionality as provided by the fiducial paddle. However, there is no need to use a specially marked object; users can select and rotate the model with their hand or an ordinary pen. Natural plane camera pose tracking is included as an alternative for the target-based method. Figure 11A shows the instantiation of the earth model into an AR scene using the camera pose solution of the new natural plane method. Figure 11B shows the same model based on the camera pose computed with the target method after fiducial patterns are introduced to the scene. The position of the camera is the same in both views. The orientation of the model is aligned with the table in both cases and the model is shown at the same scale. The primary difference between the two
methods is in how the initial position of the virtual data on the reference plane is established. With the ARToolKitbased system, the user indicates the initial position and orientation of the virtual model by selecting the position and orientation of the physical target. In the case of the non-target mode, the origin on the plane and the rotation about the model’s z axis cannot be detected directly from the input data. The model is instantiated at the orientation of the reference plane, but with a zero degree rotation about its z axis, and at the projection of the center of the image on the plane. As the viewpoint changes, the model maintains this position. The user can move the origin of the model by pointing at a new location with their finger, and can rotate the model about its z-axis with pointer gestures in viewpoint move mode as described above. It would also be straightforward to use a target to provide the initial position of the model, while using the 3D image data to track this position and orientation. This would be useful for interacting with large datasets, for which the target may pan out of view or be blocked by other gestures. With the inViso eShades used in the handheld display, the virtual models can be showed in stereo. The binocular display receives frame sequential stereo images. The ocular separation can also be adjusted for each user to enhance the viewed image. Users can toggle between stereo and monocular views. The pointer detection and tracking mode runs concurrently with the target based camera pose tracking at 10 fps on an HP PC workstation with dual 1.7GHz Xeon CPU’s. The implementation has not been multithreaded to take explicit advantage of the second processor; the same code running on a single processor 1.7GHz P4 runs at 9fps. Additional performance tuning is necessary to improve the interaction speed – at this update rate moderate velocity motions are tracked successfully, but tracking can be lost during higher velocity motions. The depth based pose tracking algorithm runs at 6 fps in its current (unoptimized) implementation. As with the pointer algorithm, the slow frame rate limits the velocity of the camera motion that can be continuously tracked. The user also sees more jitter in the model position using the non-target camera pose solution. We are currently working to improve stability by incorporating a Kalman filter. The models used in this interface were VRML 97 files generated from GIS datasets. The well locations were measured from maps of the oilfields and inserted onto the terrain. The libVRML library was used to perform the VRML rendering [13].
6.3 User Experience User response to viewing earth models in our system has been very positive. The initial rollout of the application included a demonstration to 37 users. Most liked the intuitive and collaborative aspects of the application. Carrying a laptop with the model on disk and a paper target of meaningless symbols is a more secure way to protect
A
B Figure 11: Camera pose tracking based on a 3D table surface (A) and with ARToolkit fiducials introduced into the scene (B) for the same camera position. company information than carrying a stack of paper maps. As the users became accustomed to gathering around the display and discussing possibilities, the top priority for improvement was to add pointer capability to the application. The small group of test users thought that the addition of the natural hand pointer furthered the understanding of the data and created possibilities beyond the basic 3D pointer. The initial system used the natural finger only as a pointer and selector device. After the first user tests, the zoom and rotation functions were added to the application. Further work will include the use of the finger to select portions of the virtual model or to do more complicated grouping of the data in the model. In this way users will be able to operate an AR interface with natural finger pointing to duplicate what is traditionally done on a desktop screen with a mouse. The current prototype was shown to a large, diverse group of potential users at a demonstration held in a hotel ballroom. Due to the surrounding noise levels, voice control was not used. No special lighting was used nor were any adjustments made to the system to handle conditions different from our lab environment. A sheet of markers was
placed on the table and the wall. Each user had a few minutes to interact with the systems. Most were able to work the pointer tracking in the model with minimal instruction. Users had better success with the smaller virtual model since the model did not occlude their hand. The visual feedback showing the location of the hand or pen was important since the pointer will dip underneath the model at times. Users gave the feedback that using the pointer as a selection and interaction tool was valuable.
7
Conclusions
Approaches for interaction with AR content is an active area of research. In the past researchers have explored a variety of technologies including wired magnetic tracking and vision-based fiducial markers. In this work we introduce the idea of using dense stereo technology to provide camera pose information and free-hand interaction. Interfaces that use dense stereo are possible because of the recent development of real time stereo vision systems, such as Tyzx’s DeepSea hardware. In this paper we have described algorithms for pointer tracking and camera pose determination from a reference plane. We have demonstrated both of these algorithms in a visualization interface for the petroleum industry. Although the current performance is slower than desired, users have reported that they find it natural to use their hand to interact with the virtual dataset and can see the potential for the technology. However there are some limitations with the current system. The fact that the image of hand or pointer did not occlude the model in the display was disorienting to the viewer even when a virtual pointer was displayed. Future work will include use of depth information to provide the proper occlusion relationships between real and virtual objects. This has been addressed by [23] in a feature based stereo system, but this approach was limited to skin colored objects, required simple (non-skin colored) backgrounds, and produced only a single depth measurement for the entire hand. Extension to this work [10] removed the focus on skin color by using edge based stereo in the portion of the image occupied by virtual objects. This work achieved 10fps for small virtual objects running on a 16 CPU SGI Onyx2 IR. Wloka used real-time stereo depth to provide occlusion information [21], however his system produced low quality real-time data, creating aesthetically unsatisfactory results. The combination of intensity and higher quality real-time range data as presented in this paper could provide a useful solution to this common issue in AR which would run on a PC. Unlike previous real-time stereo hardware, which was not designed for mass production or embedded applications, the DeepSea ASIC has the potential to be very inexpensive when manufactured at moderate volumes. Its small form factor will allow future versions of the hardware
to incorporate the computation engine and the imagers in a single self-contained unit.
8
Acknowledgements
This project is supported by the ChevronTexaco Corporation Strategic Research program in Visualization. We would like to thank Gary Docktor, Ryan Saiki, William Melendez and Paul Weston of ChevronTexaco for their continued support of the computer systems. The Terrain model was the work of James Waldrop. Thanks also to Hirokazu Kato for helping in the development of the AR Toolkit. Tyzx would like to thank Dave Jurasek for his work on the design and support of the stereo camera head and handheld display. Thanks also to Ron Buck for his continued enthusiasm and support of the project.
References 1. 2.
ARToolKit site: http://www.hitl.washington.edu/artoolkit Arun, Huang, Blostein, “Least-Squares Fitting of Two 3-D Point Sets,” IEEE Transactions on Pattern Analysis and Machine Intelilgence (PAMI), Vol 9, No 5 Sept, 1987. 3. Azuma, et al, “Recent Advances in Augmented Reality. IEEE Computer Graphics and Applications, 2001. Vol. 21, No. 6, pages 34-47. 4. Billinghurst, Kato, Poupyrev, “The MagicBook: A Transitional AR Interface”. Computers and Graphics, November 2001, pp. 745-753. 5. Hardenberg, Berard, “Bare-Handed Human-Computer Interaction,” Proceedings of the ACM Workshop on Perceptive User Interfaces, Orlando, Florida, Nov 2001. 6. Harville, Gordon, Woodfill, "Foreground Segmentation Using Adaptive Mixture Models in Color and Depth", Proceedings of the IEEE Workshop on Detection and Recognition of Events in Video, (Vancouver, Canada), July 2001. 7. Jiang, You, Neumann, “Camera Tracking for Augmented Reality Media,” Proceedings of IEEE International Conference on Multimedia and Expo, July 2000, NY. 8. Kanade, Yoshida, Oda, Tanaka, “Stereo machine for videorate dense depth mapping and its new applications”. In Proc. of IEEE Computer Society Conf. on Computer Vision and Pattern Recognition (CVPR’96), pp. 109-202, 1996. 9. Kanbara, Fujii, Takemura, Yokoya, “A Stereo Vision-based Mixed reality System with Natural Feature Point Tracking”, Proceedings of International Symposium on Mixed Reality (ISMR2001), Yokohama, Japan, March, 2001 10. Kanbara, Okuma, Takemura, Yokoya, “A Stereoscopic Video See-through Augmented Reality System Based on Real-time Vision–based Registration,” Proceedings of IEEE Virtual Reality 2000, pp 255-262, March 2000. 11. Kato, Billinghurst, “Marker Tracking and HMD Calibration for a video-based Augmented Reality Conferencing System.” In Proceedings of the 2nd International Workshop on Augmented Reality (IWAR 99). October, 1999, San Francisco. 12. Kiyokawa, Takemura, Yokoya, “A Collaboration Supporting Technique by Integrating a Shared Virtual Reality and a Shared Augmented Reality”, Proceedings of the IEEE
13. 14.
15.
16.
17.
18.
International Conference on Systems, Man and Cybernetics (SMC '99), Vol.VI, pp.48-53, Tokyo, 1999. LibVRML library: http://www.openvrml.org O’Hagan, Zelinsky, Rougeaux, “Visual Gesture Interfaces to Virtual Environments,” Proceedings of 1st Australasian User Interface Conference (AUIC2000). Canberra, Australia, January 2000. Rehg, Kanade, “DigitEyes: Vision-Based Hand Tracking for Human-Computer Interaction,” Proceedings of the IEEE Workshop on Motion of Non-Rigid and Articulated Objects, Austin, Texas, November 1994. Shi, Tomasi, “Good features to track,” In Proc. IEEE Conf. on Computer Vision and Pattern Recognition (CVPR94), Seattle, June 1994. Simon, Fizgibbon, Zisserman, “Markerless Tracking Using Planar Structures in the Scene,” Proceedings of International Symposium on Augmented Reality 2000 (ISAR 00), Oct 2000, Munich. Szalavari, Schmalstieg, Furhmann, Gervautz. “Studierstube An Environment for Collaboration in Augmented Reality”. Virtual Reality: Research, Development & Applications, 1998.
19. Tyzx DeepSea Development System, www.tyzx.com, 2002. 20. Walairacht, S., Yamada, K., Hasegawa, S., Koike, Y., Sato, M. “4+4 Fingers Manipulating Virtual Objects in Mixed Reality Environment”. In Proceedings of ISMR 2001, March 14-15, Yokohama, Japan, pp. 27-34. 21. Wloka, Anderson, “Resolving Occlusion in Augmented Reality,” In Symposium on Interactive 3D Graphics, ACM SIGGRAPH, 1995. 22. Woodfill, Von Herzen, "Real-Time Stereo Vision on the PARTS Reconfigurable Computer," Proceedings of IEEE Symposium on Field-Programmable Custom Computing Machines, Napa, pp. 242-250, April 1997. 23. Yokoya, Takemura, Okuma, Kanbara, “Stereo Vision Based Video See-through Mixed Reality”. In Mixed Reality – Merging Real and Virtual Worlds, Springer-Verlag, pp. 131145, 1999. 24. Zabih, Woodfill, "Non-parametric Local Transforms for Computing Visual Correspondence", Third European Conference on Computer Vision, (Stockholm, Sweden) May 1994.