This article has been accepted for publication in the Proceedings of the 15th IEEE International Conference on Bioinformatics & Bioengineering (BIBE), but has not been fully edited. Content may change prior to final publication. Citation information: DOI , IEEE International Conference on Bioinformatics & Bioengineering
Density Based Clustering on Indoor Kinect Location Tracking: a new way to exploit Active and Healthy Aging Living Lab Datasets Evdokimos I. Konstantinidis and Panagiotis D. Bamidis, Member, IEEE
Abstract— Gait analysis is nowadays considered, as a promising contributor towards early detection of cognitive and physical status deterioration when it comes to elderly people. However, the majority of recent efforts on indoor gait analysis methodologies are limited as they only exploit the average walking speed. Applying density based clustering algorithms on indoor location datasets could accelerate context awareness on gait analysis and consequently augment information quality with regard to underlying gait disorders. This work presents the application of DBScan, a well-known algorithm for knowledge discovery, on indoor Kinect location datasets collected in the Active and Healthy Aging Living Lab in the Lab of Medical Physics of the Aristotle University of Thessaloniki. The aim of the paper is to provide evidence that such an approach could effectively discriminate indoor activity High Density Regions which may subsequently be transferred to datasets originated from seniors’ real homes in the light of context aware gait analysis.
I. INTRODUCTION
G
analysis is considered, nowadays, as a promising contributor towards early detection of elderly people cognitive and physical status deterioration, in the realm of Active and Healthy Aging. Gait profiles have been shown to correspond to cognitive profiles while gait abnormalities could be potential indicators of MCI [1]. Moreover, gait speed has been correlated with older adults survival [2]. Individual gait features, such as velocity, are deemed as potential contributors to the detection of risk for adverse events of healthy elderly people [3][4]. Especially in the elders’ community, where gait is no longer an automaticity, walking while performing a cognitive task may provoke gait deficits or even falls [5]. Consequently, the importance of gait velocity led to the constitution of normative data [6] as well as the suggestion for incorporating gait speed as a measure in geriatric assessment in clinical settings [7]. In addition, body transition, arm movements, number of steps, stride length and other similar features, complement the AIT
Manuscript received August 15, 2015. This work was supported in part by the UNCAP Horizon 2020 project (grant number 643555), as well as, the business exploitation scheme of the ICT-PSP funded project LLM, namely, LLM Care which is a self-funded initiative at the Aristotle University of Thessaloniki (www.llmcare.gr). E. I. Konstantinidis is with the Assistive Technologies and SilverScience Group of the Lab of Medical Physics, Medical School, Aristotle University of Thessaloniki, Thessaloniki, Greece (corresponding author to provide phone: +030 2310999310; e-mail:
[email protected]). P. D. Bamidis is with the Assistive Technologies and Silver-Science Group of the Lab of Medical Physics, Medical School, Aristotle University of Thessaloniki, Thessaloniki, Greece (e-mail:
[email protected])
cohort of the exploited gait features [1]. Given that gait, and subsequently all its derivatives such as velocity, refers to body transition from one position to another, a considerable number of gait monitoring and analysis approaches are based on indoor localization and positioning. Nowadays, there is an increasing tendency in indoor positioning systems and services [8]. RF Signal Strength [9], WiFi Aps [10] and Active RFID [11] are some of the Indoor 3D Location Sensing Technologies [12]. The advent of camera based technologies, equipped with depth sensing elements, like Microsoft Kinect, extended the available indoor location based technologies range [13]. The value of the indoor location based information has been recognized by researchers on the field of human behavioral analysis. Classification on the location of a moving object in an indoor environment as well as trajectories generated from 2D image coordinates has been investigated [14]. Moreover, automated activity analysis by utilizing an adaptive learning method to estimate the physical location and moving speed [15] as well as object trajectories modelled as motion time series [16] have been used for detection of unusual trajectories in camera datasets. Although the majority of the research efforts focus on the trajectory classification [14], calculating the high activity and trajectory density regions could not only be equally important but even form a new pillar for context aware indoor trajectory analysis. A number of clustering algorithms discovering low and high density regions [17] has already been investigated. More specifically, density based clustering algorithms such as the Density-Based Spatial Clustering of Applications with Noise (DBScan) are proven to be insensitive to noisy data and can be applied to any kind of data in various shapes [18]. The DBScan’s research value along with the need for real time usage led to a number of variations that have been proposed over the years aiming at speed improvement [19][20][21]. Interestingly, such an algorithm has not been yet applied on indoor location datasets. The work presented in this paper applies the DBScan algorithm on indoor (location) transitions. The production of the experimental datasets was carried out in a Living Lab which was mainly developed as an Active and Healthy Aging Living Lab, but used also as the relaxation, brain storming and meeting room of the Lab of Medical Physics in the Aristotle University of Thessaloniki. The aim of this paper is to provide evidence that such an approach could effectively
Copyright (c) 2015 IEEE. Personal use is permitted. For any other purposes, permission must be obtained from the IEEE by emailing
[email protected].
This article has been accepted for publication in the Proceedings of the 15th IEEE International Conference on Bioinformatics & Bioengineering (BIBE), but has not been fully edited. Content may change prior to final publication. Citation information: DOI , IEEE International Conference on Bioinformatics & Bioengineering
discriminate High Density Regions (HDR) [22] in indoor environments when Kinect is utilized as the monitoring sensor. This documented evidence may then be transferred to datasets originating from seniors’ real homes in the light of context aware gait analysis. The remainder of this paper is structured as follows. In the Methodology section, the architecture of the followed approach and its individual components are presented alongside the data collection methodology concluding in the testing and experimental datasets. In the Results section the outcome of a density based clustering algorithm, when this is applied on the indoor location datasets, is illustrated. At the end of the paper a Discussion section puts the threads together by shedding light on the current research work on the field along with research limitations and further envisaged work. II. MATERIALS AND METHODS The architecture adopted by this work focuses on two aspects. First, the implementation of the system facilitated the indoor Kinect based location data acquisition and analysis. Second, the architecture had to be reliable and easily deployed in real environments for further exploitation. The body’s trajectory, was captured by Kinect and recorded by a client as a set of (x, y) locations of the center of mass [14]. An application was used to apply a density based clustering algorithm to the datasets. The output corresponds to the HDR of humans’ activity captured in the Living Lab located in the premises of the Medical Physics Laboratory. A. CAC-framework Kinect connectivity The Controller Application Communication (CAC) framework [23] is a cross platform/device communication platform. It serves the real time communication streaming and data exchanging among controllers and applications. Its functionality relies on a lightweight publish/subscribe messaging mechanism on top of the Websockets, aligned with the Internet of Things (IoT) design principles. Each controller/device (Kinect, Wii, Emotiv, etc) subscribes to the framework and publishes its information to any application or device client subscribed to the same sessions [24]. In our approach, Kinect was connected to the CAC-framework through an application. Utilizing the Microsoft SDK 1.8, the application formed and streamed packets of the skeleton and RGB information conforming to the CAC-framework. B. Node.js CAC-framework client A Node.js client application, utilizing the JavaScript CAC client API (http://www.cac-framework.com), subscribes to the skeleton streaming and stores specific skeleton’s joints in csv files. A new csv file is created with respect to the file size limit of 10MB. The information stored in the files is composed of the body’s position as well as the position of the ankles, knees, hips, hip center, spine, shoulders and shoulder center [25]. Each record is stored along with the skeleton’s id and the timestamp. The application’s
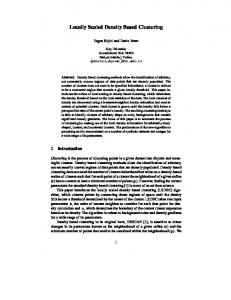
installation as a windows service relied on the NSSM (www.nssm.cc) service helper. C. DBScan Algorithm The Density-Based Spatial Clustering, else DBScan, is a data insensitive algorithm suitable for applications with (any kind) of large datasets data in various shapes in the presence of noise [18]. Given a set of points, the algorithm groups the neighborhood points while marks as outliers these that lie in low-density regions (whose nearest neighbors are far away with respect to the eps parameter defining the minimum proximity radius between each pair of points). The algorithm gets the neighborhood points that abstain less than eps from each point. If the number of the neighborhood points are sufficient for a cluster (defined by the minPts parameter) a cluster is started. All the points that are found within the neighborhood of each neighbor point are added to the cluster. This process ends when the density-connected cluster is completely found. The output of the algorithm gives a number of cluster which are deem as High Density Regions with respect to the two parameters [18]. D. Minimal Enclosing Circle and Convex Hull A convex hull, the smallest convex polygon that surrounds a finite set of points [26], was used to shape the HDR. The algorithm (http://csharphelper.com/blog/2014/07/find-theconvex-hull-of-a-set-of-points-in-c) applied to each of the DBScan clusters produces an equal number of convex polygons constituting the HDRs. Similarly, the Smallest Enclosing Circle algorithm, finding the circle of smaller radius that contains a given set of points in its interior or on its boundary [27], was applied to the DBScan clusters in order to give a different form of the HDRs. E. Software tool for applying and visualizing DBScan The automation of the presented methodology was encapsulated in a desktop application (c.f. Fig. 1). Developed in .Net WPF, the application handles, algorithms’ parameterization as well as visualization (and exporting of transparent images) of the input and output features. The user can configure DBScan and enable minimal enclosing circle and convex hull algorithms. Visualization parameters regarding transition lines and points and HDRs outline and filling can be configured too. The HDRs are annotated with a number pointing to a list with information regarding the number and percentage of points per cluster.
Fig. 1 The software tool for applying and visualizing DBScan analysis
Copyright (c) 2015 IEEE. Personal use is permitted. For any other purposes, permission must be obtained from the IEEE by emailing
[email protected].
This article has been accepted for publication in the Proceedings of the 15th IEEE International Conference on Bioinformatics & Bioengineering (BIBE), but has not been fully edited. Content may change prior to final publication. Citation information: DOI , IEEE International Conference on Bioinformatics & Bioengineering
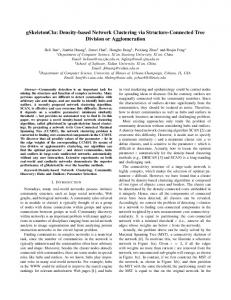
F. Living Lab room resembling home The Active & Healthy Aging Living Lab (AHA LL) [28] was the environment for the production of the datasets and the initial evaluation of the approach [23]. The AHA LL was developed to initially support the trial evaluation of the USEFIL project [29]. There, a number of seniors were visiting the Living Lab daily and performing a set of daily activities. The AHA LL set-up consisted of a living-room space, a bathroom-like space and a hall-kitchen space, all in the same room (c.f. Fig. 2). More specifically, there is a marble kitchen comprising two sinks side by side (c.f. Fig. 3 locations 5 and 6), a water cooler on the right side of the marble (c.f. Fig. 3 location 4) close to the entrance (c.f. Fig. 3 location 8) and a coffeemaker on the left (c.f. Fig. 3 location 7). Next to the entrance there is a kind of kitchen table (c.f. Fig. 3 location 9). A refrigerator completes the kitchen space. On the opposite side, there is a three-seat sofa (c.f. Fig. 3 locations 1, 2 and 3) and a living room table in front of it. Across the living room space there is a smart TV. The AHA LL serves also as kitchen, resting room and meeting room for the personnel of the Lab of Medical Physics. Consequently, the Living Lab is visited many times by the personnel throughout the day when trials with seniors are not in progress.
1234567 (c.f. Fig. 3). The member moved with slow, normal and fast speed with respect to the average movement speed of a person while he stayed at each resting point for approximately 3-8 seconds. H. Experimental Datasets The experimental datasets were generated by capturing the personnel’s daily transitions in the AHA LL for a period of 26 days. The personnel was verbally informed that their body location was recorded without any information that could be used to disclose their identity. The experiment coincided with the period of the personnel’s summer leaves and therefore a reduction of the number of transitions was observed over time. I. Analysis Methodology A number of 69 files were produced within the period of 26 days (from June 29th, 2015 to July, 28th, 2015). However, 18 files suffering from faulty skeleton detection, were discarded thereby concluding in 51 files. Microsoft SDK, occasionally, recognizes by fault a skeleton of which the captured location points are concentrated in a small restricted region (the skeleton does not move since it is not reflecting a real body), occupying more than 75% of the total dataset’s points. The expedient period lasted from July 3rd, 2015 to July, 28th, 2015. The datasets are not organized per day but per file size (the software produces a new file when the size of the recording file reaches the 10MB limit). A number of 9 locations were empirically selected as the predominant regions of activity in the AHA LL. This locations are highlighted in Fig. 3. The analysis of the datasets provided information regarding the percentage of points per cluster. In addition, the number of total points per dataset, the minPts parameter of the DBScan algorithm and the time interval in minutes are documented alongside. III. RESULTS
Fig. 2 Kinect view of the Active and Healthy Aging Living Lab.
G. Testing Datasets A set of three testing datasets, with constant walking speed per dataset, was generated. A member of the personnel was walking with constant speed (different for each dataset) from one resting point to another following the route:
ID
HDR1 (%)a
HDR2 (%)a
HDR3 (%)a
HDR4 (%)a
1 2
12.83 13.58
13.78 14.94
12.31 16.7
12.83 10.14
The analysis of the datasets was conducted separated for the testing and the experimental datasets. The results of the analysis are documented in Table I and Table II respectively. In addition, the aggregated dataset’s analysis is illustrated in Fig. 3 and Fig. 4 where the transitions and HDRs are projected on a 3D model of the AHA LL.
TABLE I TESTING DATASETS RESULTS, EPS=0.06, HDR5 HDR6 HDR7 minPts Dataset (%)a (%)a (%)a (%)b Points 12.51 8.77
11.53 8.9
11.76 12.54
3078 1539
1 1
Description Walking with slow speed from region to region Walking with normal speed from region to region Walking with fast speed from region to region
3 13.06 13.16 12.28 12.09 12.28 12.18 9.55 1026 1 1-3 12.88 13.91 13.91 11.87 11.66 23.11 5643 1 1-3 12.35 13.66 13.10 11.63 11.36 8.75 10.38 5643 2 aThe proportion on points (with respect to the dataset’s total points) constituting a High Density Region (HDR) (c.f.Fig. 3) bThe minimum required points for a region with respect to the dataset’s total points. cThe recording session interval expressed in minutes.
Copyright (c) 2015 IEEE. Personal use is permitted. For any other purposes, permission must be obtained from the IEEE by emailing
[email protected].
This article has been accepted for publication in the Proceedings of the 15th IEEE International Conference on Bioinformatics & Bioengineering (BIBE), but has not been fully edited. Content may change prior to final publication. Citation information: DOI , IEEE International Conference on Bioinformatics & Bioengineering
TABLE II EXPERIMENTAL DATASETS RESULTS, EPS=0.06, 10 POINTS SKIPPED ON LOADING HDR1 HDR2 HDR3 HDR4 HDR5 HDR6 HDR7 HDR8 HDR9 minPts Dataset ID (%)a (%)a (%)a (%)a (%)a (%)a (%)a (%)a (%)a (%)b Points 4 1.31 27.61 11.56 28.2 2.47 1.18 11617 1 5 39.78 8.76 9.13 2.2 1.22 1.22 22443 1 6 1.31 14.06 39.70 1.49 1.66 11568 1 7 4.14 22.98 5.01 1.37 1.36 15.85 12.71 11805 1 8 41.29 3.87 2.17 16.57 2.13 11664 1 9 23.76 7.03 2.01 1.64 17.09 11676 1 10 21.43 6.91 1.29 1.99 7.79 17.59 46568 1 11 11.96 33.86 1.69 2.26 1772 1 12 13.53 14.3 2.4 33.97 1.31 5875 1 13 1.91 9.58 2.32 9653 1 14 10.07 1.22 10.82 1.57 12216 1 15 30.64 15.88 22.78 1.04 2.49 5176 1 16 48.75 1.97 6.52 7.22 11423 1 17 19.02 6.27 15.89 2.91 1819 1 18 13.82 18.5 30.2 5.17 4897 1 19 1.65 14.3 27.08 1.14 3.31 9284 1 20 25.58 49.61 1.43 1818 1 21 62.13 3.84 1772 1 4-21 6.33 3.95 6.74 5.47 14.63 3.59 193046 1 4-21 25.02 1.78 5.47 20.12 1.57 4.02 4.26 193046 0.5 aThe proportion of points (with respect to the dataset’s total points) constituting a High Density Region (HDR) (c.f. Fig. 3)) bThe minimum required points for a region with respect to the dataset’s total points. cThe recording session interval expressed in minutes.
A. Testing Datasets The application of DBScan on the individual testing datasets distinguished all the regions (ID1 – ID3). However, the aggregated analysis (ID1-3) could not distinguish HDR6 and HDR7, which were clustered as a common HDR, when the minPts parameter was set to 1%. However, DBScan successfully clustered them as two distinct HDRs when minPts was set to 2%.
Interval (Minutes)c 5603 1613 2639 1511 2837 1307 470 392 1539 1266 3095 422 1514 1186 1507 4090 1481 323 32795 32795
HDR5, HDR6 and HDR7 when minPts was set to 1% and among HDR1 and HDR2 and among HDR5 and HDR6 when minPts was set to 0.5%.
Fig. 4 The output of the DBScan on the experimental datasets is projected as HDRs along with the body transitions on the 3D model of the AHA LL.
IV. DISCUSSION
Fig. 3 3D model and HDRs of the AHA LL. The testing datasets are projected along with the captured transitions.
B. Experimental Datasets The DBScan algorithm identified the HDR 4 (water cooler) in the majority of the individual datasets (ID4 – ID21). The fact that some of the regions were not identified could be attributed to the fact that the certain regions were not visited so much at the specific dataset. A clearer view of the trajectories and HDRs is illustrated in Fig. 5. The aggregated analysis (ID4-21) could not distinguish among
As it has been already documented, clustering applies to a wide variety of research fields in data mining [20]. To the best of the authors’ knowledge, this is the first study applying one of the most common clustering algorithms [30], DBScan, on indoor location and trajectory datasets. High density body activity regions are the base for calculating gait and trajectory analysis. This is aligned with the authors’ insights for context aware indoor trajectory and gait analysis. The results show that DBScan clustering algorithm could be successfully applied to Kinect originated indoor location datasets. DBScan distinguished the majority of the predominant locations in the Active and Healthy Aging
Copyright (c) 2015 IEEE. Personal use is permitted. For any other purposes, permission must be obtained from the IEEE by emailing
[email protected].
This article has been accepted for publication in the Proceedings of the 15th IEEE International Conference on Bioinformatics & Bioengineering (BIBE), but has not been fully edited. Content may change prior to final publication. Citation information: DOI , IEEE International Conference on Bioinformatics & Bioengineering
Living Lab. Its accuracy on daily datasets (c.f. Fig. 5 and Table II) could be valuable for exploitation in real settings in seniors’ homes. On the other hand, the analysis of the aggregated datasets is not of great importance in real home settings where the analysis commonly takes place once per day [31]. The walking speed and gait analysis are usually calculated daily and the analysis’ outcome is aggregated or processed further [28].
Fig. 5 The trajectories and HDRs calculated for every experimental dataset.
To this end, recent work found in the literature focuses on average in-home gait speed investigating new metrics for mobility and fall risk assessment of elders [32]. However, the majority of these efforts, as well as most of the indoor gait analysis methodologies, refer to the average walking speed [31][32]. Going one step further, our approach opens up new ways for context aware indoor trajectory and gait analysis and consequently for Decision Support Systems on the field [33]. Following this notion, further research could exploit gait velocity with respect to the starting and ending location which constitute different routes. Moreover, according to Bridenbaugh et al. [5], gait analysis on singletask walking is often not enough to reveal underlying gait disorders during normal, everyday activities. Walking while simultaneously performing a second cognitive task could give early symptoms of divided attention on motor performance [5]. Hence, a context aware gait analysis, which could identify and group similar routes, would give an added value to the existing gait analysis techniques. For example, following the proposed approach, a certain indoor route that might be accompanied most of the times with a cognitive task, could be identified as a separate route with augmented information regarding underlying gait disorders. It is interesting to note, however, that the accuracy of
DBScan depends on the parameters, especially "eps" and "minPts". In our case, these parameters were empirically set to 6 cm (close to the discrimination accuracy of Kinect [34]) and 1% of the total points respectively. Apart from these, the results were greatly affected by the fact that some adjacent regions were really close to each other in the AHA LL. This paper presented initial evidence that density based clustering algorithms can accelerate the research in the field of indoor localization. The authors intention is to apply the proposed solution on the 1TB datasets that have been collected during the USEFIL trials carried out in the same AHA LL [23]. Furthermore, context aware gait velocity will be calculated for the participants and will be compared against the average speed. More importantly, the methodology presented in this paper will be applied on datasets coming from seniors’ homes. The CAC-framework has already been deployed in five seniors’ apartments, in the realm of the USEFIL project [28], handling the simultaneously Kinect’s exploitation of many applications in the realm of Active and Healthy Aging domain [23]. The Node.js CAC client application, presented in this paper, has already been installed in the seniors’ premises, collecting seniors’ trajectory data. Although seniors have major privacy concerns for camera sensors in their homes [31][35], the fact that Kinect was introduced as the gaming sensor [36] for the FitForAll exergaming seniors’ platform [37], persuade them to accept it. A. Limitations This study does have several limitations. First, Kinect’s position was not absolutely constant during the experiment period and slightly changes may have occurred. The datasets are not organized per day but per size which will be changed in the next client version. Sometimes, Kinect SDK identifies skeletons that do not exist in real. Given that these skeleton’s trajectories follow an easily recognizable pattern (same location over period), further research on overcoming this issue will take place. Finally, the authors did not take into account the available normative waking speed data [6] during testing datasets production. V. CONCLUSION The work presented in this paper attempts to give a different perspective in the gait monitoring and analysis by introducing the tools for context aware gait analysis. Exploiting current work as the basis, authors will investigate further gait analysis insights as a new way to explore active and healthy aging research. ACKNOWLEDGMENT This work was supported in part by the UNCAP Horizon 2020 project (grant number 643555), as well as, the business exploitation scheme of the ICT-PSP funded project LLM, namely, LLM Care which is a self-funded initiative at the Aristotle University of Thessaloniki (www.llmcare.gr).
Copyright (c) 2015 IEEE. Personal use is permitted. For any other purposes, permission must be obtained from the IEEE by emailing
[email protected].
This article has been accepted for publication in the Proceedings of the 15th IEEE International Conference on Bioinformatics & Bioengineering (BIBE), but has not been fully edited. Content may change prior to final publication. Citation information: DOI , IEEE International Conference on Bioinformatics & Bioengineering
REFERENCES [1]
[2]
[3]
[4]
[5]
[6]
[7]
[8]
[9]
[10]
[11]
[12]
[13]
[14]
[15]
[16]
[17]
[18]
S. Gillain, E. Warzee, F. Lekeu, V. Wojtasik, D. Maquet, J.-L. Croisier, E. Salmon, and J. Petermans, “The value of instrumental gait analysis in elderly healthy, MCI or Alzheimer’s disease subjects and a comparison with other clinical tests used in single and dualtask conditions.,” Ann. Phys. Rehabil. Med., vol. 52, no. 6, pp. 453– 74, Jul. 2009. S. Studenski, S. Perera, K. Patel, C. Rosano, K. Faulkner, M. Inzitari, J. Brach, J. Chandler, P. Cawthon, E. B. Connor, M. Nevitt, M. Visser, S. Kritchevsky, S. Badinelli, T. Harris, A. B. Newman, J. Cauley, L. Ferrucci, and J. Guralnik, “Gait speed and survival in older adults.,” JAMA, vol. 305, no. 1, pp. 50–8, Jan. 2011. M. Montero-Odasso, M. Schapira, E. R. Soriano, M. Varela, R. Kaplan, L. A. Camera, and L. M. Mayorga, “Gait Velocity as a Single Predictor of Adverse Events in Healthy Seniors Aged 75 Years and Older,” Journals Gerontol. Ser. A Biol. Sci. Med. Sci., vol. 60, no. 10, pp. 1304–1309, Oct. 2005. K. S. van Schooten, M. Pijnappels, S. M. Rispens, P. J. M. Elders, P. Lips, and J. H. van Dieën, “Ambulatory fall-risk assessment: amount and quality of daily-life gait predict falls in older adults.,” J. Gerontol. A. Biol. Sci. Med. Sci., vol. 70, no. 5, pp. 608–15, May 2015. S. A. Bridenbaugh and R. W. Kressig, “Laboratory review: the role of gait analysis in seniors’ mobility and fall prevention,” Gerontology, vol. 57, no. 3, pp. 256–264, 2011. R. W. Bohannon and A. Williams Andrews, “Normal walking speed: a descriptive meta-analysis.,” Physiotherapy, vol. 97, no. 3, pp. 182– 9, Sep. 2011. N. M. Peel, S. S. Kuys, and K. Klein, “Gait speed as a measure in geriatric assessment in clinical settings: a systematic review.,” J. Gerontol. A. Biol. Sci. Med. Sci., vol. 68, no. 1, pp. 39–46, Jan. 2013. H. Zou, X. Lu, H. Jiang, and L. Xie, “A fast and precise indoor localization algorithm based on an online sequential extreme learning machine.,” Sensors (Basel)., vol. 15, no. 1, pp. 1804–24, Jan. 2015. J. Hightower, R. Want, and G. Borriello, “SpotON: An indoor 3D location sensing technology based on RF signal strength,” UW CSE 00-02-02, Univ. Washington, Dep. Comput. Sci. Eng. Seattle, WA, vol. 1, 2000. K. Chintalapudi, A. Padmanabha Iyer, and V. N. Padmanabhan, “Indoor localization without the pain,” in Proceedings of the sixteenth annual international conference on Mobile computing and networking - MobiCom ’10, 2010, p. 173. L. M. Ni, Y. Liu, Y. C. Lau, and A. P. Patil, “LANDMARC: Indoor Location Sensing Using Active RFID,” Wirel. Networks, vol. 10, no. 6, pp. 701–710, Nov. 2004. H. Liu, H. Darabi, P. Banerjee, and J. Liu, “Survey of Wireless Indoor Positioning Techniques and Systems,” IEEE Trans. Syst. Man Cybern. Part C (Applications Rev., vol. 37, no. 6, pp. 1067–1080, Nov. 2007. M. R. U. Saputra, W. Widyawan, G. D. Putra, and P. I. Santosa, “Indoor human tracking application using multiple depth-cameras,” pp. 307–312. K. Appiah, A. Hunter, A. Lotfi, C. Waltham, and P. Dickinson, “Human behavioural analysis with self-organizing map for ambient assisted living,” in Fuzzy Systems (FUZZ-IEEE), 2014 IEEE International Conference on, 2014, pp. 2430–2437. Z. Zhou, X. Chen, Y.-C. Chung, Z. He, T. X. Han, and J. M. Keller, “Activity Analysis, Summarization, and Visualization for Indoor Human Activity Monitoring,” IEEE Trans. Circuits Syst. Video Technol., vol. 18, no. 11, pp. 1489–1498, 2008. C. Jung, J. Jacques, J. Soldera, and S. Musse, “Detection of Unusual Motion Using Computer Vision,” in XIX Brazilian Symposium on Computer Graphics and Image Processing, 2006, pp. 349–356. C. Ordonez, E. R. Omiecinski, S. B. Navathe, and N. F. Ezquerra, “A Clustering Algorithm to Discover Low and High Density HyperRectangles in Subspaces of Multidimensional Data.,” 1999. M. Ester, H.-P. Kriegel, J. Sander, and X. Xu, “A density-based algorithm for discovering clusters in large spatial databases with noise.,” in Kdd, 1996, vol. 96, no. 34, pp. 226–231.
[19] G. Andrade, G. Ramos, D. Madeira, R. Sachetto, R. Ferreira, and L. Rocha, “G-DBSCAN: A GPU Accelerated Algorithm for Densitybased Clustering,” Procedia Comput. Sci., vol. 18, pp. 369–378, 2013. [20] L. Ma, L. Gu, B. Li, S. yi Qiao, and J. Wang, “G-DBSCAN: An Improved DBSCAN Clustering Method Based On Grid,” Adv. Sci. Technol. Lett., vol. 74, pp. 23–28, 2014. [21] B. Wang, C. Zhang, L. Song, L. Zhao, Y. Dou, and Z. Yu, “Design and optimization of DBSCAN Algorithm based on CUDA,” arXiv Prepr. arXiv1506.02226, 2015. [22] R. J. Hyndman, “Computing and graphing highest density regions,” Am. Stat., vol. 50, no. 2, pp. 120–126, 1996. [23] E. I. Konstantinidis, P. E. Antoniou, G. Bamparopoulos, and P. D. Bamidis, “A lightweight framework for transparent cross platform communication of controller data in ambient assisted living environments,” Inform Sciences, vol. 300, pp. 124–139, Dec. 2014. [24] E. I. Konstantinidis, P. E. Antoniou, A. Billis, G. Bamparopoulos, C. Pappas, and P. D. Bamidis, “Leveraging Web Technologies to Expose Multiple Contemporary Controller Input in Smart TV Rich Internet Applications Utilized in Elderly Assisted Living Environments,” in Universal Access in Human-Computer Interaction. Aging and Assistive Environments, Springer, 2014, pp. 118–128. [25] Microsoft, “Microsoft Kinect SDK JointType Enumeration.” [Online]. Available: http://msdn.microsoft.com/enus/library/microsoft.Kinect.jointtype.aspx. [Accessed: 16-Dec-2013]. [26] R. A. Jarvis, “On the identification of the convex hull of a finite set of points in the plane,” Inf. Process. Lett., vol. 2, no. 1, pp. 18–21, 1973. [27] S. Xu, R. M. Freund, and J. Sun, “Solution methodologies for the smallest enclosing circle problem,” Comput. Optim. Appl., vol. 25, no. 1–3, pp. 283–292, 2003. [28] A. S. Billis, P. Kartsidis, D.-K. G. Garyfallos, M. S. Tsatali, M. Karagianni, and P. D. Bamidis, “Ecologically valid trials of elderly unobtrusive monitoring: analysis and first results,” in 4th International Workshop on Artificial Intelligence and Assistive Medicine, 2015, pp. 32–41. [29] A. Artikis, P. D. Bamidis, A. Billis, C. Bratsas, C. Frantzidis, V. Karkaletsis, M. Klados, E. Konstantinidis, S. Konstantopoulos, D. Kosmopoulos, H. Papadopoulos, S. Perantonis, S. Petridis, and C. S. Spyropoulos, “Supporting tele-health and AI-based clinical decision making with sensor data fusion and semantic interpretation: The USEFIL case study,” in International Workshop on Artificial Intelligence and NetMedicine, 2012, p. 21. [30] “DBSCAN, Wikipedia the free encyclopedia.” [Online]. Available: https://en.wikipedia.org/wiki/DBSCAN#cite_note-2. [Accessed: 05Aug-2015]. [31] E. E. Stone and M. Skubic, “Passive, in-home gait measurement using an inexpensive depth camera: Initial results,” pp. 183–186. [32] E. Stone, M. Skubic, M. Rantz, C. Abbott, and S. Miller, “Average in-home gait speed: investigation of a new metric for mobility and fall risk assessment of elders.,” Gait Posture, vol. 41, no. 1, pp. 57– 62, Jan. 2015. [33] A. S. Billis, E. I. Papageorgiou, C. A. Frantzidis, M. S. Tsatali, A. C. Tsolaki, and P. D. Bamidis, “A Decision-Support Framework for Promoting Independent Living and Ageing Well,” IEEE J. Biomed. Health Inform, vol. 19, no. 99, pp. 199–209, 2015. [34] K. Khoshelham and S. O. Elberink, “Accuracy and resolution of Kinect depth data for indoor mapping applications.,” Sensors (Basel)., vol. 12, no. 2, pp. 1437–54, Jan. 2012. [35] M. Kepski and B. Kwolek, “Fall detection using ceiling-mounted 3d depth camera,” in Int. Conf. VISAPP, pages II, 2014, pp. 640–647. [36] E. I. Konstantinidis, G. Bamparopoulos, and P. D. Bamidis, “Moving Real Exergaming Platforms on the Web: The webFitForAll case study,” IEEE J. Biomed. Health Inform, vol. Under Prep, 2015. [37] E. I. Konstantinidis, A. S. Billis, C. Mouzakidis, V. Zilidou, P. E. Antoniou, and P. D. Bamidis, “Design, implementation and wide pilot deployment of FitForAll: an easy to use exergaming platform improving physical fitness and life quality of senior citizens,” IEEE J. Biomed. Health Inform, 2014, DOI:10.1109/JBHI.2014.2378814.
Copyright (c) 2015 IEEE. Personal use is permitted. For any other purposes, permission must be obtained from the IEEE by emailing
[email protected].